

A mini-review of single-cell Hi-C embedding methods
- PMID: 39610904
- PMCID: PMC11603012
- DOI: 10.1016/j.csbj.2024.11.002
A mini-review of single-cell Hi-C embedding methods
Abstract
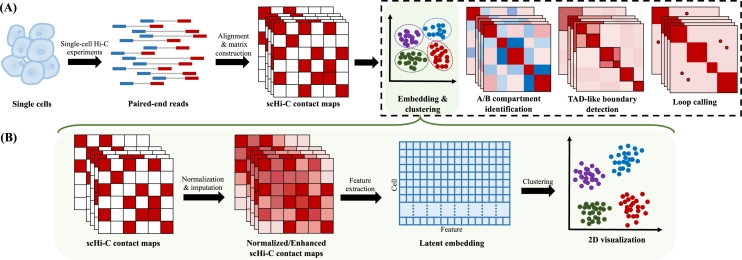
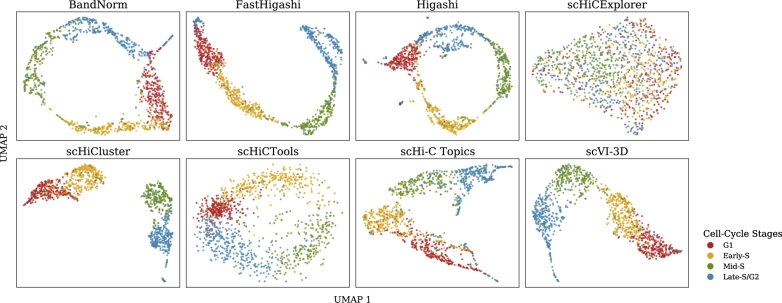
Single-cell Hi-C (scHi-C) techniques have significantly advanced our understanding of the 3D genome organization, providing crucial insights into the spatial genome architecture within individual nuclei. Numerous computational and statistical methods have been developed to analyze scHi-C data, with embedding methods playing a key role. Embedding reduces the dimensionality of complex scHi-C contact maps, making it easier to extract biologically meaningful patterns. These methods not only enhance cell clustering based on chromatin structures but also facilitate visualization and other downstream analyses. Most scHi-C embedding methods incorporate strategies such as normalization and imputation to address the inherent sparsity of scHi-C data, thereby further improving data quality and interpretability. In this review, we systematically examine the existing methods designed for scHi-C embedding, outlining their methodologies and discussing their capabilities in handling normalization and imputation. Additionally, we present a comprehensive benchmarking analysis to compare both embedding techniques and their clustering performances. This review serves as a practical guide for researchers seeking to select suitable scHi-C embedding tools, ultimately contributing to the understanding of the 3D organization of the genome.
Keywords: Dimensionality reduction; Embedding; Genome architecture; Single-cell Hi-C.
© 2024 The Authors.
Conflict of interest statement
The authors declare that they have no known competing financial interests or personal relationships that could have appeared to influence the work reported in this paper.
Figures


Similar articles
-
Single-Cell Hi-C Technologies and Computational Data Analysis.Adv Sci (Weinh). 2025 Mar;12(9):e2412232. doi: 10.1002/advs.202412232. Epub 2025 Jan 30. Adv Sci (Weinh). 2025. PMID: 39887949 Free PMC article. Review.
-
scHiCcompare: An R Package for Differential Analysis of Single-cell Hi-C Data.J Mol Biol. 2025 Aug 1;437(15):169155. doi: 10.1016/j.jmb.2025.169155. Epub 2025 Apr 15. J Mol Biol. 2025. PMID: 40246224
-
Enhancing Single-Cell and Bulk Hi-C Data Using a Generative Transformer Model.Biology (Basel). 2025 Mar 12;14(3):288. doi: 10.3390/biology14030288. Biology (Basel). 2025. PMID: 40136544 Free PMC article.
-
scGHOST: Identifying single-cell 3D genome subcompartments.bioRxiv [Preprint]. 2023 May 25:2023.05.24.542032. doi: 10.1101/2023.05.24.542032. bioRxiv. 2023. Update in: Nat Methods. 2024 May;21(5):814-822. doi: 10.1038/s41592-024-02230-9. PMID: 37292994 Free PMC article. Updated. Preprint.
-
The 3D Genome Structure of Single Cells.Annu Rev Biomed Data Sci. 2021 Jul 20;4:21-41. doi: 10.1146/annurev-biodatasci-020121-084709. Epub 2021 Apr 23. Annu Rev Biomed Data Sci. 2021. PMID: 34465168 Review.
Cited by
-
Integrated explainable machine learning and multi-omics analysis for survival prediction in cancer with immunotherapy response.Apoptosis. 2025 Feb;30(1-2):364-388. doi: 10.1007/s10495-024-02050-4. Epub 2024 Dec 4. Apoptosis. 2025. PMID: 39633110
-
ChromMovie: A Molecular Dynamics Approach for Simultaneous Modeling of Chromatin Conformation Changes from Multiple Single-Cell Hi-C Maps.bioRxiv [Preprint]. 2025 May 21:2025.05.16.654550. doi: 10.1101/2025.05.16.654550. bioRxiv. 2025. PMID: 40475498 Free PMC article. Preprint.