Review
. 2024 Nov 27;15(48):20122-20154.
doi: 10.1039/d4sc04849k. eCollection 2024 Dec 11.

The role of responsive MRI probes in the past and the future of molecular imaging

Affiliations
Review

The role of responsive MRI probes in the past and the future of molecular imaging

Ping Yue et al. Chem Sci. .

Abstract

Magnetic resonance imaging (MRI) has become an indispensable tool in biomedical research and clinical radiology today. It enables the tracking of physiological changes noninvasively and allows imaging of specific biological processes at the molecular or cellular level. To this end, bioresponsive MRI probes can greatly contribute to improving the specificity of MRI, as well as significantly expanding the scope of its application. A large number of these sensor probes has been reported in the past two decades. Importantly, their development was done hand in hand with the ongoing advances in MRI, including emerging methodologies such as chemical exchange saturation transfer (CEST) or hyperpolarised MRI. Consequently, several approaches on successfully using these probes in functional imaging studies have been reported recently, giving new momentum to the field of molecular imaging, also the chemistry of MRI probes. This Perspective summarizes the major strategies in the development of bioresponsive MRI probes, highlights the major research directions within an individual group of probes (T 1- and T 2-weighted, CEST, fluorinated, hyperpolarised) and discusses the practical aspects that should be considered in designing the MRI sensors, up to their intended application in vivo.


Conflict of interest statement

There are no conflicts to declare.

Figures

Fig. 1
Fig. 1. Main parameters that influence r1 and r2, and typical mechanisms that cause their changes in T1 and T2 bioresponsive MRI CAs. (a) Typical T1 agents are paramagnetic metal ion complexes and the key parameters that influence their r1 are: hydration number (q), mean residence time of bound water (τm) and rotational correlation time (τR) of the complex. (b) The recognition unit (yellow cap) of the responsive CA interacts with the target analyte (e.g. biologically relevant metal ions); the switch of recognition unit concurrently changes the q and r1 values of the CA. (c) The recognition unit on the responsive CA interacts with the target analyte, but also forms ternary complexes with large molecules, such as proteins. This leads to a decrease in τR due to formation of the high molecular weight species, which increases r1 at low-to-intermediate magnetic fields. (d) The fixed geometry and functional groups of the responsive CA interact with ditopic guests, such as zwitterionic amino acid neurotransmitters. In the absence of the analyte, water is coordinated to the paramagnetic metal ion. In the presence of the ditopic guest molecule, the formation of the ternary complex with the responsive CA decreases q, and hence the r1. (e) The enzyme activity causes the removal of functional and paramagnetic ion-coordinating group from the responsive CA, which results in increases of the q and r1 values. (f) Typical T2 CAs are composed of superparamagnetic nanoparticles with target-specific coatings on the surface. In the presence of the target analyte, the interaction between functional surfaces typically induces the aggregation of nanoparticles, which affects the τR of the agent and diffusion of water on the responsive CA surface, resulting in strong r2 changes. The processes described here lead to (b), (c), (e), (f) increase, and (d) decrease of the MRI signal.
Fig. 2
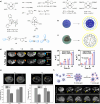
Fig. 2. Bioresponsive MRI probes sensitive to pH T1- and T2- weighted MRI experiments in vivo with these probes. (a) The structures of 1–16 that are responsive to pH. (b and c) The mechanism responsible for pH-dependent r1 changes of (b) MSN-NPs and (c) polymer-NP-based responsive CAs at neutral (left) and acidic (right) conditions. (d) T1 and T2 maps of NP-SSM-PEG-bearing mice (left) and corresponding R1 and R2 values (middle and right) at tumor sites at different time points. (e) T1- and T2-weighted MR images in vivo with NP-SGM-bearing VX2 tumors in rabbits. (f) Schematic illustration of the assembly and disassembly of the i-motif linker under different pH conditions switching from T2 to T1 effects (top) and corresponding in vivo small hepatocellular carcinoma diagnosis using responsive and irresponsive ultra-small iron oxide nanoclusters (bottom). Adapted with permission from (d) ref. Copyright © 2022 Springer Nature, (e) ref. © 2015 Elsevier, (f) ref. Copyright © 2018 American Chemical Society.
Fig. 3
Fig. 3. Calcium-responsive CAs. (a) Selected T1-weighted bioresponsive CA structures 17–24, which are based on paramagnetic Gd(iii) (17–23) and Mn(ii) (24). (b) Schematic illustrations of the Ca(ii)-sensitive nanosized CAs, with a dendrimeric core, siloxane core–shell particle core, or a liposome formulation. Before coupling to the nanocarrier surface, structural modifications must be performed on the responsive CA unit (left) to allow the conjugation.
Fig. 4
Fig. 4. Calcium-responsive probes (second part). Functional MRI experiments in vivo with Ca(ii)-sensitive CAs. (a) MRI images of probe 23 in the rat somatosensory cortex (upper left) and the regions of interest (ROIs) with signals enhanced by a paramagnetic probe <3 mm away were recorded and analyzed (upper right), while transient cerebral ischemia was induced via occlusion of the middle cerebral artery. The collected signals showed significant signal fluctuations using probe 23 (lower left) compared to the control probe that is Ca(ii)-insensitive (lower middle) during the pre-ischemia, ischemia, post-ischemia periods. Average values of the detrended signals indicate that only 23 can detect changes in the Ca(ii) concentration (lower right). (b) The use of probe 24 to detect neural activation in rat brain. Infusion of 24 or the control agent (left and right, respectively) into the rat striatum resulted in the signal enhancement (upper left), with an average MRI signal increase by 20 ± 2% (upper right); under K(i) stimulation, only the brain area perfused with probe 24 showed an increase in MRI signal (lower left). The time course of mean MR signals exhibited significantly greater changes during K(i) stimulation with probe 24 then both control experiments using Na(i) stimulation with probe 24 or K(i) stimulation with the control probe (lower right). (c) Mechanism of Ca(ii)-triggered T1-weighted MRI change of the NP-calprotectin; in the presence of Ca(ii), NP-calprotectin prevents the contact between free paramagnetic Mn(ii) and water, reducing MRI signals. (d) Mechanism of Ca(ii)-triggered T2-weighted MRI change of the probe NP-MaCaReNa. In the presence of Ca(ii), the C2AB moieties (red) induce the aggregation of nanoparticles prepared by coating oleate-stabilized magnetic iron oxide cores with a mixture of PC and PS (grain), changing MRI signals. (e) MRI experiments with NP-MaCaReNa in living rat brain. MRI signal increases in the presence of NP-MaCaReNa but not controls (right and left, respectively)(upper left). The time courses of MR signals near areas of contrast-agent delivery show that K(i) infusion (grey shading) in the presence of NP-MaCaReNa induces clear responses (red trace), whereas controls barely affect the MRI signal (upper right). The average time courses of three consecutive K(i) stimuli (grey shading) show the reproducibility of NP-MaCaReNa responses (bottom). Adapted with permission from: (a) ref. Copyright © 2019 National Academy of Sciences, (b) ref. Copyright © 2019, The Author(s), (e) ref. Copyright © 2018, The Author(s).
Fig. 5
Fig. 5. Zn(ii)-sensitive CAs and functional MRI imaging experiments in vivo with these probes. (a) The structures of Zn(ii)-sensitive CAs 25–36. (b) MR images of the probe 32 before (left) and 10 min after administration of glucose (right) in the pancreatic tissue of mouse, which causes the release of Zn(ii). (c) MRI in vivo of the prostate during various states of tumor development before and after the administration of probe 33 (left). The average signal enhancement results indicate the lower MR signal intensities in the tumor cells, which is related to progressively lower Zn(ii) secretion (right). (d) MRI in vivo of Zn(ii)-sensitive CAs with different affinities. Saline was co-injected with the probes in the controls (upper panels), whereas Zn(ii) was released after co-injection of glucose with the probes (lower panels). The difference between the two probes shows that the high affinity probe 35 produces a larger background signal, while the low affinity probe 36 produced higher contrast images after glucose injection. Adapted with permission from: (b) ref. Copyright © 2011 National Academy of Sciences, and (c) ref. Copyright © 2016 National Academy of Sciences and (d) ref. Copyright © 2018 American Chemical Society.
Fig. 6
Fig. 6. Cu(i)/(ii)-sensitive CAs and functional MRI experiments in vivo with these probes. (a) The structures of probes 37–45 that are sensitive to Cu(i)/(ii). (b) MRI in vivo of the wild type mouse pre- and postinjection of probe 43 without (top) or with (bottom) pretreatment with ATN-224 (the copper ion chelator). The decreased intensity reflects a reduction in freely available Cu(ii) in liver. (c) The average MR signal intensity of mouse liver increases after injection of probe 43 in control mice (black bars) versus mice pretreated with ATN-224 (white bars). Mice imaged with Gadavist (an extracellular agent) and Multihance (a hepatobiliary agent) was used as control. Adapted with permission from ref. Copyright © 2019 American Chemical Society.
Fig. 7
Fig. 7. Redox- and hypoxia-sensitive CAs and MRI experiments in vivo with these probes. (a) The structures of redox- and hypoxia-sensitive MRI probes 46–50. (b) Schematic illustrations of cleavage of S–S bond, followed by the GSH-induced agglomeration of the NP-S-S-Pep probes (top). GSH levels were determined in the brains of mice bearing orthotopic U87MG glioma xenografts using NP-S-S-Pep and NP-S-Pep, administered at various time intervals before and after injection. It takes 3 h for the probes and hence the T1-weighted MR signal to be evenly dispersed throughout the brain region. In addition, the T1 signal was unevenly distributed at 9 h after injection (middle). Similarly, the T2 signal showed the same maximum intensity at 3 to 5 h post-injection and doubled signals were observed after 7 h, indicating the switch from T1 to T2 effect (bottom). (c) Schematic illustration of magnetic relaxation switch (MGRS) functions of core–shell NP-RANS with reduced intracellular targeting (top). T1- and T2-weighted MR images of MKN-45 tumor-bearing animals acquired before and after NP-RANS intravenous injection (immediate, 1 h, and 2 h) (bottom). (d) The NP-UIO self-assembly principle increases MRI and fluorescence signals generated by hypoxia (top). MRI images of 4T1 tumor-bearing mice showed a decrease in the brightness of NP-UIO-Pimo at 4 h after the intravenous NP injection as the oxygen concentration decreased, indicating hypoxia-induced self-assembly; in contrast, UIO-B did not show any similar changes with decreasing oxygen concentration (bottom). (e) Pre- and post-injection of NP-D-Fe3O4@PMn in Panc-1 tumor-bearing nude mice of T1- (upper left and middle) and T2-weighted (bottom left and middle) MRI images at 3T and corresponding signal intensity analysis (right top and bottom). Adapted with permission from: (b) ref. Copyright © 2021 John Wiley and Sons, (c) ref. Copyright © 2016 Elsevier, (d) ref. Copyright © 2021 American Chemical Society, (e) ref. Copyright © 2016, Springer Nature.
Fig. 8
Fig. 8. Neurotransmitter-sensitive MRI probes functional MRI experiments with these probes. (a) Dopamine-sensitive, genetically engineered protein-based probe BM3h-8C8 (purple dashed circle, left) reports significant changes compared to the wild-type protein (control probe WT BM3h, black dashed circle, right) in statistical parametric map that correlates MR intensity with low- and high-K(i) conditions (upper left). Maps of percent signal difference (SD) between high- and low-K(i) conditions observed in 2.7 mm-diameter ROIs centered around BM3h-8C8 sensor (left) and WT BM3h (right) injection sites, after spatial co-registration and averaging across multiple animals (upper right). (b) Protein-based probe BM3h-9D7 for quantitative functional imaging of DA concentration. The raw maps of average brain signal changes are significant in animals injected with BM3h-9D7 (upper left). In the unsaturated state of the probe, linearity function can be fitted between % SC and [DA], which is used as the basis for quantitative calculations. In areas that received substantial contrast agent infusion, a ratio of 8 mM DA per %SC can be used to estimate DA concentrations (lower left). Quantitative mapping of the average peak DA concentration on the infusion probe area. Plots show means (black lines) and SEMs (shading) of DA concentrations along dashed lines in respective images (right). (c) T2-weighted MRI (left) and R2 maps (right) of NP-DaReNa showing its effective diffusion in the brain. (d) The structures of ZNTs-sensitive small molecular CAs 51–59. The azacrown ethers AE54-58 are coupled to the remaining parts of the probes 54–58via the amine group indicated with the red dashed circle. (e) MRI imaging on acute brain slices with probe 53. The orientation of the investigated slices and brain structures with the ROIs (top left) and MRI of the slices in the presence of probe 53 before (lower left) and after (lower right) addition of KCl. Time courses of the normalized signal intensities in different ROIs when stimulated (membrane potential depolarization) with KCl only (middle) or KCl + tetrodotoxin (right), showing that only KCl alone caused the ZNT release and detection by the responsive CA. Adapted with permission from: (a) ref. Copyright © 2010, Springer Nature America, Inc. (b) ref. Copyright © 2014, The American Association for the Advancement of Science. (c) ref. Copyright © 2019, American Chemical Society, (e) ref. Copyright © 2015 American Chemical Society.
Fig. 9
Fig. 9. Enzyme responsive MRI probes. (a) The structures of enzyme-sensitive MRI probes 60–63. (b) MR images of two embryos injected with probe 61 at the two-cell stage (top), while the embryo on the right was also injected with β-gal mRNA. Consequently, the signal strength is 45–65% greater in the embryo on the right that contains β-gal; pseudocolor rendering of the same image (top) with water made transparent (bottom). (c) Schematic illustration of the self-assembly and aggregation processes of NP-KID-FtNs in response to PKA activity. Genes encoding Ft are premixed and co-transfected into cells, where proteins are expressed and spontaneously assembled into KID-FtNs and KIX-FtNs (left). KID-LF chains are phosphorylated by PKA to form pKID-LF. Modified KID-FtNs (pKID-FtNs) containing pKID-LF form supramolecular aggregates with KIX-FtNs, which affect the MRI signal (right). (d) Measurements of the transverse relaxivity of Ft-based NP sensors in response to PKA activity. Incubation of the sensor (3 : 2 ratio of KID-FtNs with KIX-FtNs) with PKA for 2 h roughly doubled the r2 relaxivity. Adapted with permission from: (b) ref. Copyright © 1969, Springer Nature, and (d) ref. Copyright © 2009 American Chemical Society.
Fig. 10
Fig. 10. CEST effect, selected bioresponsive CEST probes and CEST MRI in vivo. (a) The illustration of CEST effect and CEST-responsive mechanism. A bioresponsive CEST probe is bearing exchangeable protons, which can be saturated by an RF pulse and can chemically exchange with bulk water protons; the chemical exchange of protons results in a partially saturated water pool, which results in a decrease of the water protons signal intensity (left). If an analyte or a target interacts with probes, the CEST signal can be affected (a turn-off CEST effect illustrated in the z-spectra) (right). (b) CEST MRI of iobitridol in the tumor-bearing mouse model: T2-weighted anatomical image of two tumour regions (top left), CEST MRI before and after injection of iobitridol at 1.5 μT (top right) and at 6 μT (bottom left), and a corresponding pH map obtained as a ratio of saturation transfer maps from these two CEST measurements (bottom right). (c) The representative CEST probes sensitive to pH (64–66), Ca(ii) (67–69), Zn(ii) (70), Cu(ii/i) (71–72) and hypoxia (73). (d) CEST MRI of bioresponsive probe 73 in the CT26 xenograft mouse model (tumor area shown by red arrow). The panels are images obtained by recording T2-weighted and CEST MRI along with the merged image before (three left panels) and 1 h after (three right panels) intratumoral injection of probe 73, respectively. The quantitative analysis compares the mean MTRasym (%) values for the tumor region from of three measurements (right). Adapted with permission from: (b) ref. Copyright © 2014, American Chemical Society. (d) Ref. Copyright © 2022, American Chemical Society.
Fig. 11
Fig. 11. Selected bioresponsive CEST probes and CEST MRI in vivo experiments with bioresponsive CEST probes. (a) The representative CEST probes that are sensitive to lactate (74), α-hydroxyl acids (75–77) and enzymes (80–82). (b) CEST imaging of extracellular lactate in a mouse bladder by employing the probe 74. In the absence of lactate, probe 74 shows no CEST signal. Upon the injection of 1 : 1 mixture of probe 74 and lactate in a mouse, a strong CEST MRI signal was evident in the bladder. Adapted with permission from ref. Copyright © 2017, Wiley-VCH Verlag GmbH & Co. KGaA.
Fig. 12
Fig. 12. The most common mechanisms used for preparation of responsive fluorinated MRI probes. (a) The design principle that uses a chelate with the paramagnetic lanthanide or transition metal ion (green ball) covalently bound to a fluorinated functional group (yellow polyhedron). The effect of paramagnetic metal ions on fluorine atoms varies depending on the distance, leading to changes in 19F MR signals: at shorter distances, T1 and T2 relaxation times are shortening (PRE) or 19F NMR frequency changes (LIS). (b) Fluorinated bioresponsive nanoprobes utilize the principle in which the low 19F MRI signal exists in assembled nanoprobe due to the significant T2 shortening (left), which, in the presence of the analyte, triggers the NP disassembly and hence an enhanced 19F MRI signal (right). (c) The structures of fluorinated bioresponsive probes 83–98, which take advantage of PRE or LIS effect.
Fig. 13
Fig. 13. Fluorinated bioresponsive MRI probes and 19F MRI in vivo studies with these probes. (a) The structures of fluorinated responsive probes 99–109, which respond to enzyme activity or are suitable for iCEST. (b) 1H and 19F MRI with pH responsive probe NP-FNPs-PEG. The 19F MRI signal in vitro at pH 7.4 is low due to the probe assembly (top left) and increases at pH 5.5 (top right), while the 1H MRI signal does not change significantly. When applied in vivo in the tumour-bearing mice, NP-FNPs-PEG delineate the boundaries of tumours from surrounding normal tissues by means of 19F MRI (bottom middle and right), when compared to 1H MRI with the same probe (bottom left and right). (c) MRI experiments with pH responsive NP-Mn-LDH@PFPE in a mouse subcutaneous MDA-MB-468 tumour model. A strong 19F MRI signal was observed at the tumour area 24 h after probe injection (left), which can also be followed over time by means of T1-weighted 1H (black) and 19F MRI (red) signal intensities (right). (d) The use of probe 103 for detecting Zn(ii) secretion in a transgenic adenocarcinoma of the mouse prostate model in vivo. 19F MRI (top), iCEST MRI (middle), and iCEST spectra (bottom) of 10 week and 17 week-old mice (two left and two right panels, respectively) before and after of d-glucose injection. (e) In vivo19F iCEST maps of labile Zn(ii) pools with probe 108 in the mouse brain. The probe was administered in a zinc-rich (top) and zinc-poor (bottom) regions (CA3 in hippocampus and thalamus, respectively). From left to right: schematic illustration of the setup for the delivery of 108, 1H MRI, 19F MRI at the off-resonance, 19F MRI at the on-resonance, 19F iCEST (subtracted 19F MR images overlaid on the 1H MRI). Adapted with permission from: (b) ref. , Copyright © 2018 Royal Society of Chemistry (c) ref. Copyright © 2019 WILEY-VCH Verlag GmbH & Co. KGaA, Weinheim (d) ref. Copyright © 2019 Wiley-VCH Verlag GmbH & Co. KGaA, Weinheim (e) ref. Copyright © 2021 The Authors.
Fig. 14
Fig. 14. The representative HP probes that are sensitive to pH (110–114), Ca(ii) (115), Zn(ii) (116–118), HOCl (119) and H2O2 (120–122). These presented probes contain either 3He, 13C, 15N, 89Y or 129Xe nuclei to generate HP signal. The following techniques were employed for the signal amplification: dDNP for probes 110–111, 114–117 and 119–120; SABRE for probes 112–113 and 121; SEOP for probes 118 and 122.
None
Ping Yue
None
Thavasilingam Nagendraraj
None
Gaoji Wang
None
Ziyi Jin
None
Goran Angelovski

References

    1. Wahsner J. Gale E. M. Rodríguez-Rodríguez A. Caravan P. Chem. Rev. 2019;119:957–1057. doi: 10.1021/acs.chemrev.8b00363. - DOI - PMC - PubMed
    1. Hingorani D. V. Bernstein A. S. Pagel M. D. Contrast Media Mol. Imaging. 2015;10:245–265. doi: 10.1002/cmmi.1629. - DOI - PMC - PubMed
    1. Meng Q. Wu M. Shang Z. Zhang Z. Zhang R. Coord. Chem. Rev. 2022;457:214398. doi: 10.1016/j.ccr.2021.214398. - DOI
    1. Mo Y. Huang C. Liu C. Duan Z. Liu J. Wu D. Macromol. Rapid Commun. 2023;44:2200744. doi: 10.1002/marc.202200744. - DOI - PubMed
    1. Angelovski G. Tickner B. J. Wang G. Nat. Chem. 2023;15:755–763. doi: 10.1038/s41557-023-01211-3. - DOI - PubMed

LinkOut - more resources