. 2024 Aug 22;6(12):101189.
doi: 10.1016/j.jhepr.2024.101189. eCollection 2024 Dec.

Essential roles of B cell subsets in the progression of MASLD and HCC

Affiliations

Essential roles of B cell subsets in the progression of MASLD and HCC

Nataliia Petriv et al. JHEP Rep. .

Abstract

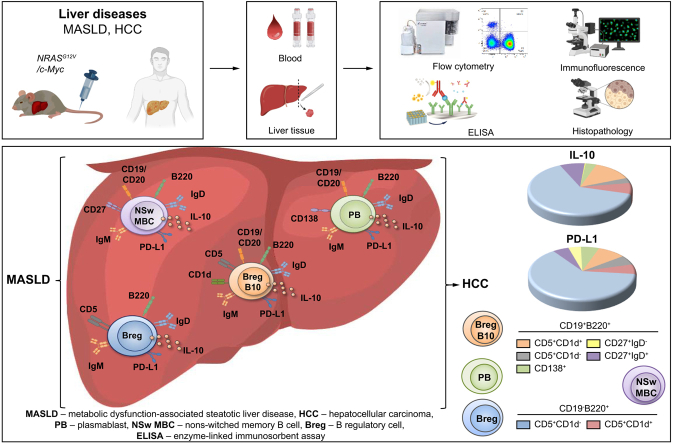
Background & aims: Hepatocellular carcinoma (HCC) is the third leading cause of cancer-related death. Metabolic dysfunction-associated steatotic liver disease (MASLD) is a significant cause of HCC. Current treatment options for HCC are very limited. Recent evidence highlights B cells as key drivers in MASLD progression toward HCC. However, it remains unclear whether multiple B cell populations or a distinct B cell subset regulates inflammatory responses during liver disease progression. The scope of this study was to define protumorigenic B cell subsets in MASLD and HCC.

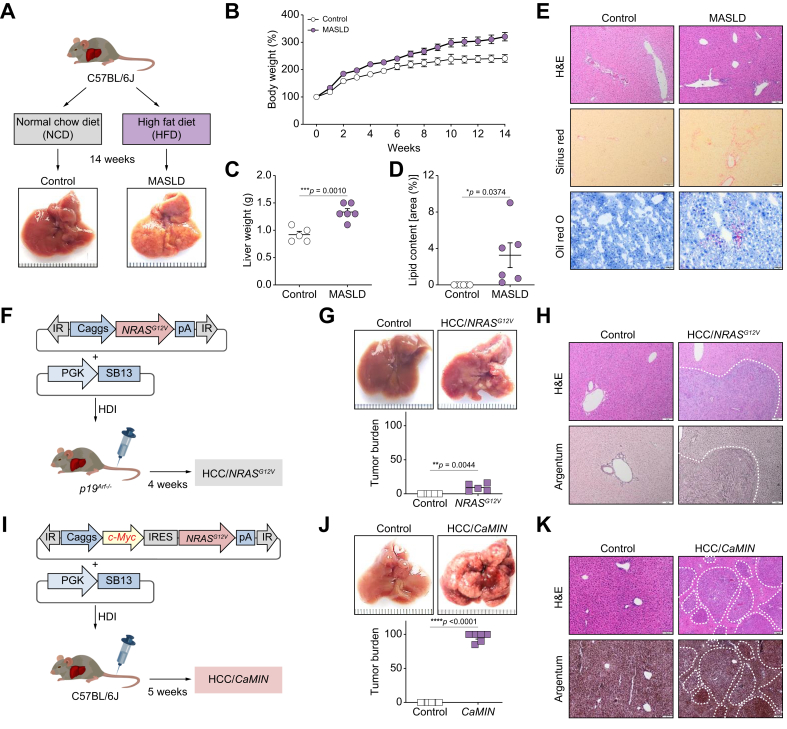
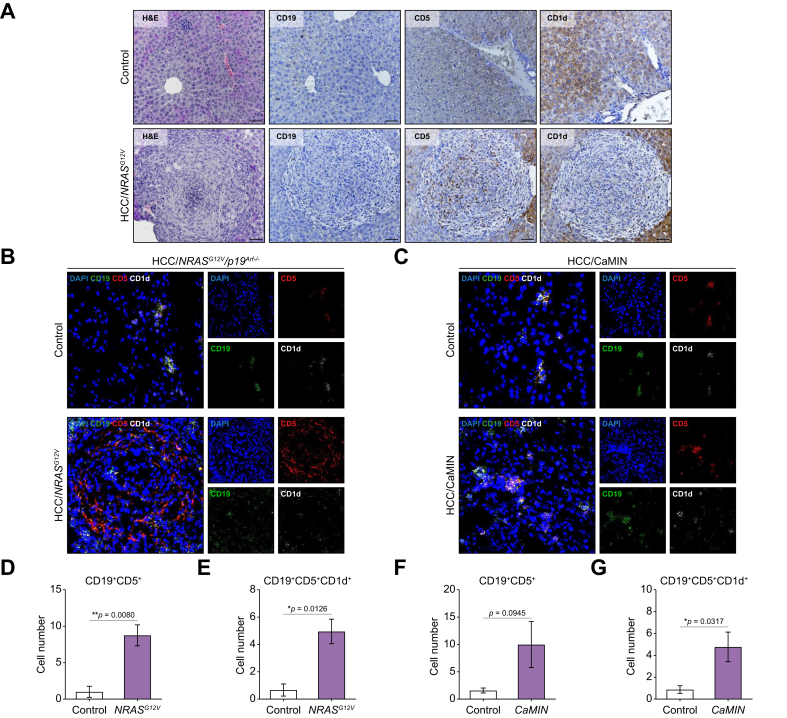
Methods: Multicolor flow cytometry, immunohistochemistry, and immunofluorescence analyses were performed to investigate B cell populations locally (in liver tissue) and systemically (in the blood) in mice with MASLD (n = 6) and HCC (n = 5-6). The results obtained in mice were also verified in patients with MASLD (n = 19) and HCC (n = 16).

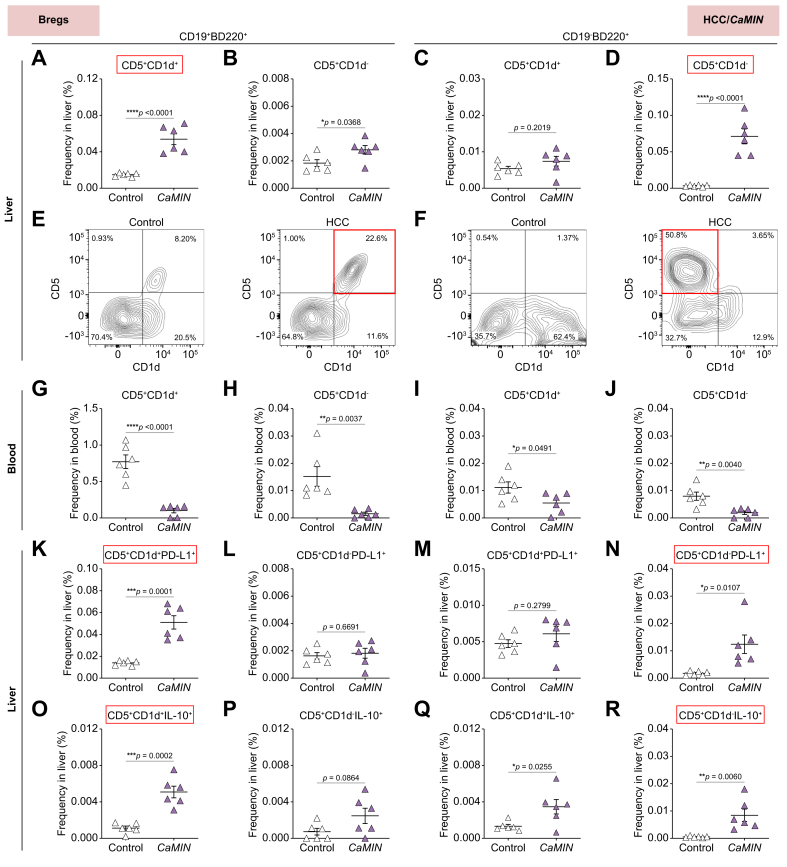
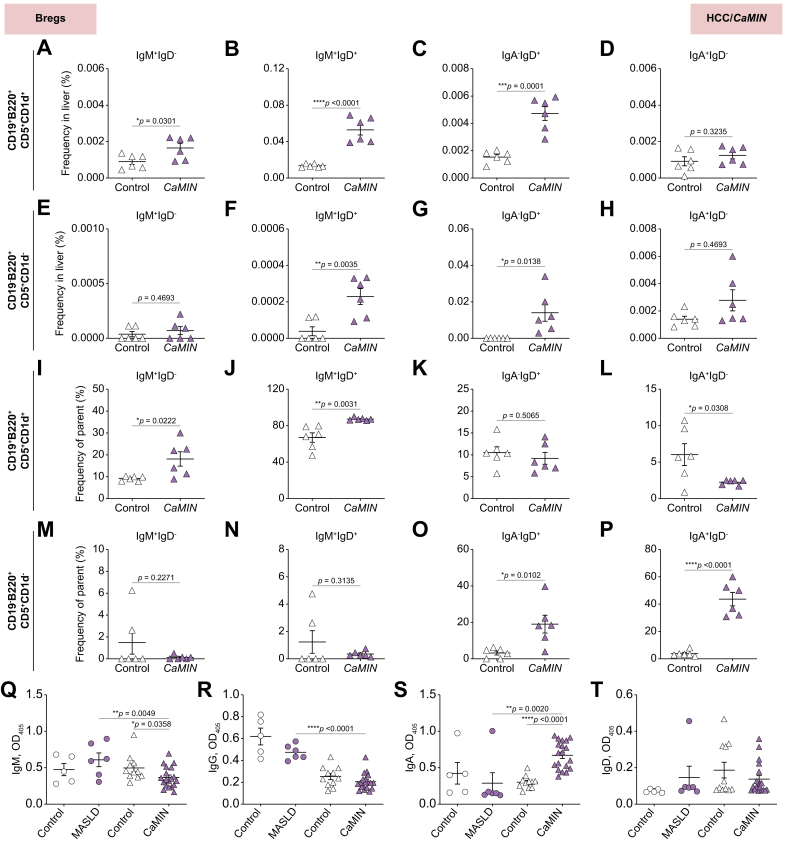
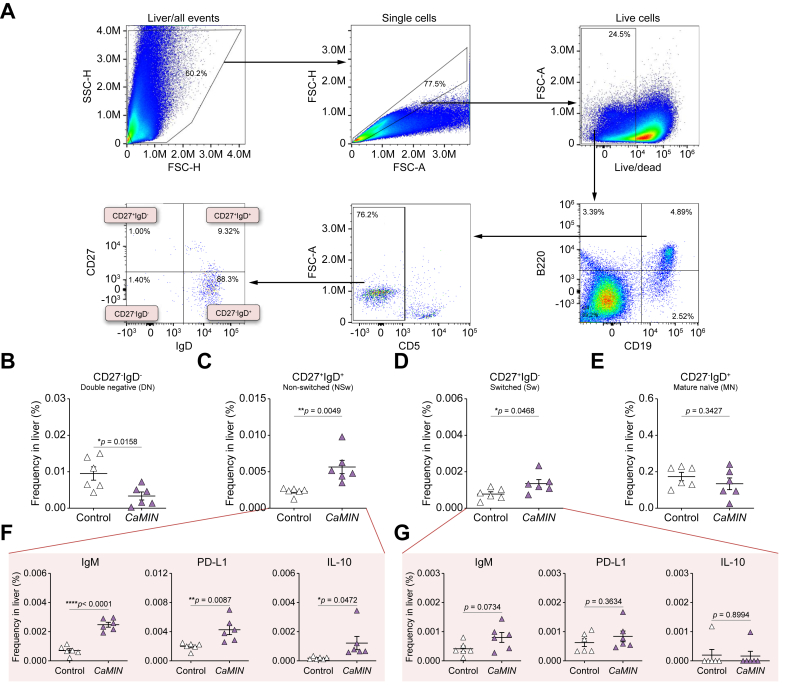
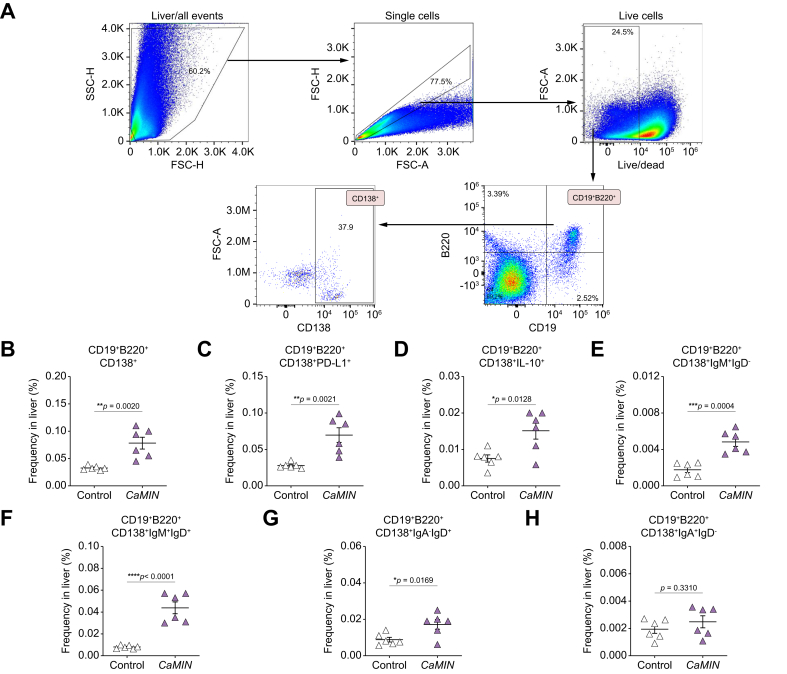
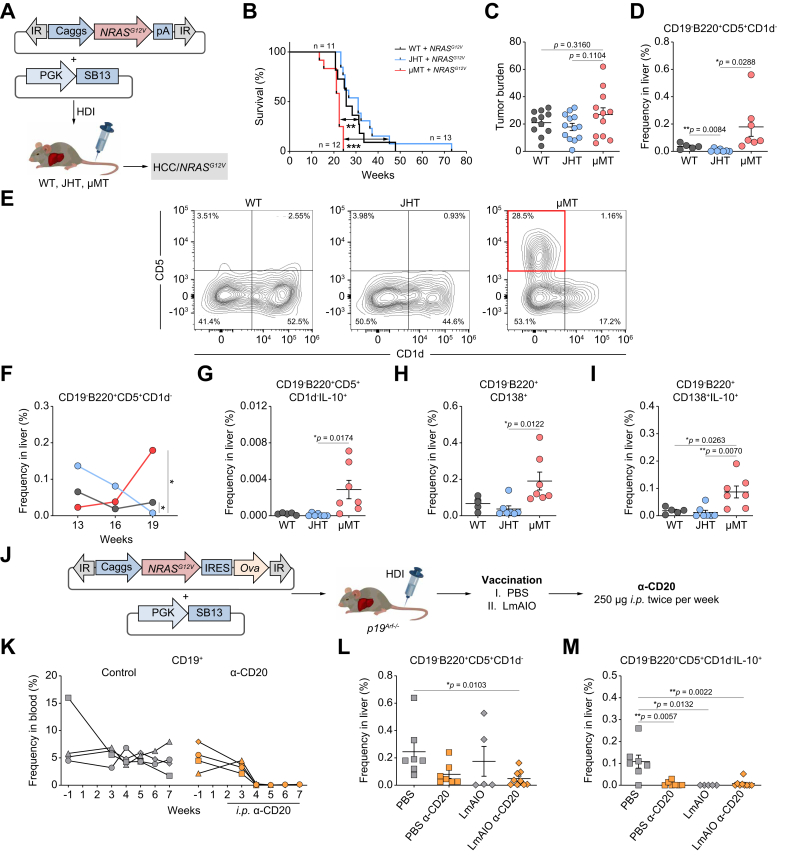
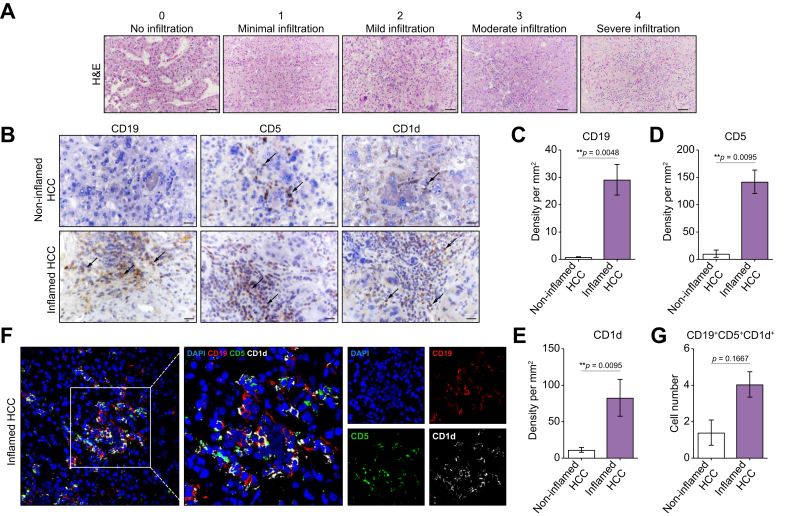
Results: Our study revealed an increase of two regulatory B cell (Breg) subsets, CD19+B220+CD5+CD1d+ (p <0.0001) and CD19-B220+CD5+CD1d- (p <0.0001), both of which highly overexpress IgM/IgD, PD-L1, and IL-10, in the livers of mice with MASLD and HCC. Furthermore, we showed that B-cell depletion therapy in combination with a Listeria-based vaccine decreased CD19-B220+CD5+CD1d- Bregs (p = 0.0103), and improved survival of mice with HCC. We also found CD19+CD5+IL-10+ (p = 0.0167), CD19+CD5+PD-L1+ (p = 0.0333) and CD19+CD5+IgM+IgD+ (p = 0.0317) B cells in human HCCs. In addition, strong overexpression of IgM/IgD, PD-L1, IL-10, were detected on non-switched memory B cells (p = 0.0049) and plasmablasts (p = 0.0020). The examination of blood samples obtained from patients with MASLD showed an increase of total B cells expressing IL-10 (p <0.0001) and IgM/IgD (p = 0.3361), CD19+CD20+CD5+CD1d+ Bregs (p = 0.6424) and CD19+CD20+CD27+ non-switched memory B cells (p = 0.0003).

Conclusions: Our results provide novel insights into the protumorigenic roles of several B cell subsets, the specific targeting of which could abrogate the progression of liver disease.

Impact and implications: Hepatocellular carcinoma (HCC) is the primary liver cancer with a constantly rising mortality rate. Metabolic dysfunction-associated steatotic liver disease (MASLD) is an emerging important cause of HCC. Current treatment options for HCC are limited and there is a high risk of recurrence. The study aims to identify new therapeutic strategies by exploring the immunological aspects of MASLD and HCC. Our findings extend the current knowledge on the role of B cells in the progression of MASLD and HCC. This study emphasizes the involvement of IgM+IgD+ regulatory B cells (Bregs) in malignant liver disease progression. These Bregs characterized by a high expression of PD-L1, IL-10, IgM, and IgD. Two other B cell subsets with immunosuppressive phenotype have been found in the study in murine liver disease - plasmablasts and non-switched memory B cells. Targeting these B cells could lead to more effective treatments of HCC.

Keywords: B cells; B regulatory cells; Hepatocellular carcinoma; Memory B cells; Metabolic dysfunction-associated steatotic liver disease; Non-alcoholic fatty liver disease; plasmablasts.


Figures

Image 1
Graphical abstract
Fig. 1
Fig. 1
Experimental models and vectors. Three study models are shown: (A–E) MASLD, (F–H) HCC/NRASG12V/p19Arf-/-, and (I–K) HCC/CaMIN. (A) Schematic outline of the MASLD mouse model. (B) Body weight and (C) liver weight development in the MASLD model. (D) Quantification of lipid content in the MASLD model. (E) Representative liver sections stained with H&E, Sirius red, and Oil red O in the MASLD model. Scale bar, 50 μm. (F) Schematic outline of the HCC/NRASG12V/p19Arf-/- mouse model. (G) Representative liver images and the liver tumor burden in the HCC/NRASG12V/p19Arf-/- mouse model. (H) Representative liver sections from the HCC/NRASG12V/p19Arf-/- model mice stained with H&E and argentum. The dotted line shows the border of a tumor nodule. Scale bar, 50 μm. (I) Schematic outline of the HCC/CaMIN mouse model. (J) Representative liver images and the liver tumor burden in the HCC/CaMIN mouse model. (K) Representative liver sections from the HCC/CaMIN model mice stained with H&E and argentum. Scale bar, 50 μm. The data were analyzed using the unpaired Student’s t test. The data are shown as the mean ± SEM, n = 5–6. ∗p <0.05, ∗∗p <0.01, ∗∗∗p <0.001, ∗∗∗∗p <0.0001. HCC, hepatocellular carcinoma; HDI, hydrodynamic tail vein injection; HFD, high-fat diet; IR, inverted repeats; IRES, internal ribosome entry site; MASLD, metabolic dysfunction-associated steatotic liver disease; NCD, normal chow diet; pA, polyadenylation site; pCaggs, synthetic CAG promoter; PGK, phosphoglycerate kinase promoter; SB13Sleeping Beauty 13 (transposase).
Fig. 2
Fig. 2
There was a strong increase in the number of CD19+B220+CD5+CD1d+ and CD19-B220+CD5+CD1d- Bregs and high PD-L1 and IL-10 expression in murine HCC/CaMIN. (A, B) Frequencies of (A) CD19+B220+CD5+CD1d+ and (B) CD19+B220+CD5+CD1d- B cells in the liver. (C, D) Frequencies of (C) CD19-B220+CD5+CD1d+ and (D) CD19-B220+CD5+CD1d- B cells in the liver. (E, F) Representative FACS plots of Breg subsets gated on (E) CD19+B220+ and (F) CD19-B220+ B cells in the liver. (G–J) Frequencies of Breg subsets in the blood. (K–N) Frequencies of PD-L1+-expressing (K-L) CD19+B220+ and (M, N) CD19-B220+ Bregs in the liver. (O–R) Frequencies of IL-10+-expressing (O, P) CD19+B220+ and (Q, R) CD19-B220+ Bregs in the liver. The data were analyzed using the unpaired Student’s t test. The data are shown as the mean ± SEM, n = 6. ∗p <0.05, ∗∗p <0.01, ∗∗∗p <0.001, ∗∗∗∗p <0.0001. Fig. S2 shows the MASLD and HCC/NRASG12V/p19Arf-/- models. Bregs, B regulatory cells; HCC, hepatocellular carcinoma; PD-L1, programmed death-ligand 1.
Fig. 3
Fig. 3
Upregulation of IgM+- and IgD+-expressing CD19+B220+CD5+CD1d+ and CD19-B220+CD5+CD1d- Bregs in the livers of HCC/CaMIN mice. (A–D) Frequencies of (A) IgM+IgD--, (B) IgM+IgD+-, (C), IgA-IgD+-, and (D) IgA+IgD--expressing CD19+B220+CD5+CD1d+ Bregs. (E–H) Frequencies of (E) IgM+IgD--, (F) IgM+IgD+-, (G) IgA-IgD+-, and (H) IgA+IgD--expressing CD19-B220+CD5+CD1d- Bregs. (I–L) Percentage of (I) IgM+IgD-, (J) IgM+IgD+, (K), IgA-IgD+, and (L) IgA+IgD- among CD19+B220+CD5+CD1d+ Bregs. (M–P) Percentage of (M) IgM+IgD-, (N) IgM+IgD+, (O), IgA-IgD+, and (P) IgA+IgD- among CD19-B220+CD5+CD1d- Bregs. (Q–T) ELISA to determine the levels of (Q) IgM, (R) IgG, (S) IgA and (T) IgD in the plasma samples of mice with MASLD and HCC/CaMIN. The data were analyzed using the unpaired Student’s t test. The data are shown as the mean ± SEM, n = 6. ∗p <0.05, ∗∗p <0.01, ∗∗∗p <0.001, ∗∗∗∗p <0.0001. Fig. S3 shows the MASLD and HCC/NRASG12V/p19Arf-/- models. Bregs, B regulatory cells; HCC, hepatocellular carcinoma; MASLD, metabolic dysfunction-associated steatotic liver disease.
Fig. 4
Fig. 4
Increased numbers of CD27+IgD+ NSw MBCs with elevated local IgM, PD-L1, and IL-10 expression in the livers of HCC/CaMIN mice. (A) Gating strategy to identify and characterize the phenotype of MBCs in the liver. (B–E) Frequencies of (B) CD27-IgD- DN, (C) CD27+IgD+ NSw, (D) CD27+IgD- Sw, and (E) CD27-IgD+ MN MBCs. (F, G) Frequencies of IgM+-, PD-L1+- and IL-10+-expressing (F) CD27+IgD+ NSw and (G) CD27+IgD- Sw MBCs. The data were analyzed using the unpaired Student’s t test. The data were shown as the mean ± SEM, n = 6. ∗p <0.05, ∗∗p <0.01, ∗∗∗∗p <0.0001. Fig. S4 shows the MASLD and HCC/NRASG12V/p19Arf-/- models. DN, double-negative; FSC-A, forward scatter area; FSC-H, forward scatter height; HCC, hepatocellular carcinoma; MBCs, memory B cells; NSw, non-switched; PD-L1, programmed death-ligand 1; SSC-H, side scatter height; Sw, switched.
Fig. 5
Fig. 5
There was a strong increase in the frequencies of PD-L1+-, IL-10+-, and IgM+IgD+-expressing CD19+B220+CD138+ PBs in the livers of HCC/CaMIN mice. (A) Gating strategy. (B) Frequencies of CD19+B220+CD138+ PBs. (C, D) Frequencies of (C) PD-L1+- and (D) IL-10+-expressing CD19+B220+CD138+ PBs. (E–H) Frequencies of (E) IgM+IgD--, (F) IgM+IgD+-, (G), IgA-IgD+-, and (H) IgA+IgD--expressing CD19+B220+CD138+ PBs. The data were analyzed using the unpaired Student’s t test. The data are shown as the mean ± SEM, n = 6. ∗p <0.05, ∗∗p <0.01, ∗∗∗p <0.001, ∗∗∗∗p <0.0001. Fig. S5 shows the MASLD and HCC/NRASG12V/p19Arf-/- models. FSC-A, forward scatter area; FSC-H, forward scatter height; HCC, hepatocellular carcinoma; PBs, plasmablasts; PD-L1, programmed death-ligand 1; SSC-H, side scatter height.
Fig. 6
Fig. 6
An increase in the numbers of CD19-B220+CD5+CD1d- and CD19-B220+CD138+ cell subsets expressing IL-10 in the liver correlates with HCC/NRASG12V/p19Arf-/- progression in B-cell-deficient μMT mice. A reduction in CD19-B220+CD5+CD1d- Bregs as well as in IL-10 on these cells correlated with protection against HCC-Ova/NRASG12V−Ova/p19Arf-/- development. (A) NRASG12V transposon constructs were codelivered with a transposase (SB13) into C57BL/6J (WT) and B-cell-deficient mice (JHT and μMT) via HDI. (B) Kaplan‒Meier survival curves of WT, JHT and μMT mice. (C) Tumor burdens in JHT, μMT, and WT mice. (D) Frequencies of CD19-B220+CD5+CD1d- cells in the livers of WT, JHT, and μMT mice at week 19 after HDI. (E) Representative FACS plots of CD19-B220+CD5+CD1d- cells in the livers of WT, JHT, and μMT mice at week 19 after HDI. (F) Kinetics of the frequencies of CD19-B220+CD5+CD1d- cells monitored at weeks 13, 16, and 19 after HDI in the livers of WT and B-cell-deficient JHT and μMT mice. (G–I) Frequencies of (G) CD5+CD1d-IL-10+, (H) CD138+, and (I) CD138+IL-10+ cells in the livers of WT, JHT, and μMT mice at week 19 after HDI. (J) Experimental setup to study the therapeutic potential of α-CD20 and LmAIO administered either alone or in combination to p19Arf-/- mice harboring HCC-Ova. (K) Kinetics of CD19+ B cells monitored in the blood of HCC-Ova/NRASG12V−Ova/p19Arf-/- mice. (L-M) Frequencies of (L) CD19-B220+CD5+CD1d- and (M) CD19-B220+CD5+CD1d-IL-10+ Breg cells at the survival endpoint in the livers of HCC-Ova/NRASG12V−Ova/p19Arf-/- mice treated with α-CD20 and LmAIO either alone or in combination. The data were analyzed using the unpaired Student’s t test. The data are shown as the mean ± SEM, n = 5–13. ∗p <0.05, ∗∗p <0.01, ∗∗∗p <0.001. Bregs, B regulatory cells; Caggs, synthetic CAG; IR, inverted repeats; HCC, hepatocellular carcinoma; HDI, hydrodynamic tail vein injection; IR, inverted repeats; IRES, internal ribosome entry site; LmAIO, Listeria monocytogenes ΔactA/ΔinlB + Ova; Ova, ovalbumin; pA, polyadenylation site; PGK, phosphoglycerate kinase promoter; SB13, Sleeping Beauty 13; WT, wild-type.
Fig. 7
Fig. 7
Histopathological examination and multicolor IF staining revealed elevated numbers of CD19+CD5+ and CD19+CD5+CD1d+ Bregs in the livers of HCC/NRASG12V/p19Arf-/- and HCC/CaMIN mice. (A) Representative images of H&E and IHC staining for CD19, CD5, and CD1d expression in the liver tissues of the HCC/NRASG12V/p19Arf-/- mice. Scale bar, 100 μm. (B, C) Representative IF images of frozen liver sections obtained from (B) HCC/NRASG12V/p19Arf-/- and (C) HCC/CaMIN mice stained with CD19 (green), CD5 (red), and CD1d (white) antibodies and counterstained with DAPI (blue). (D, E) Quantification of (D) CD19+CD5+ and (E) CD19+CD5+CD1d+ cells in the livers of mice with HCC/NRASG12V/p19Arf-/-. (F, G) Quantification of (F) CD19+CD5+ and (G) CD19+CD5+CD1d+ cells in the livers of mice with HCC/CaMIN. The data were analyzed using the unpaired Student’s t test. The data are shown as the mean ± SEM, n = 5–6. ∗p <0.05, ∗∗p <0.01. Fig. S6 shows the MASLD model. Bregs, B regulatory cells; HCC, hepatocellular carcinoma; IF, immunofluorescence.
Fig. 8
Fig. 8
The inflamed subtype of human HCC is characterized by the presence of high numbers of CD19+-, CD5+-, and CD1d+-expressing B cells. (A) Representative H&E images of human HCC liver tissues and immune infiltration assessment scores (non-inflamed HCC [≤2 infiltration score]; inflamed HCC [≥3 infiltration score]). (B) Representative images of IHC of CD19, CD5, and CD1d expression in non-inflamed and inflamed human HCC tissues. Scale bar, 100 μm. (C–E) Density of cellular markers (C) CD19, (D) CD5, and (E) CD1d in human non-inflamed and inflamed HCC tissues. The data were analyzed using the Mann‒Whitney nonparametric test, n = 10. ∗∗p <0.01. (F) Representative IF images of frozen liver sections from patients with inflamed HCC stained with CD19 (red), CD5 (green), and CD1d (white) antibodies and counterstained with DAPI (blue). (G) Quantification of CD19+CD5+CD1d+ B cells in human non-inflamed and inflamed HCC tissues. The data were analyzed using the Mann‒Whitney nonparametric test, n = 7. ∗∗p <0.01. HCC, hepatocellular carcinoma; IHC, immunohistochemistry; IF, immunofluorescence.

References

    1. Singal A.G., Lampertico P., Nahon P., et al. Epidemiology and surveillance for hepatocellular carcinoma: new trends. J Hepatol. 2020;72:250–261. - PMC - PubMed
    1. Llovet J.M., Kelley R.K., Villanueva A., et al. Hepatocellular carcinoma. Nat Rev Dis Primers. 2021;7:6. - PubMed
    1. Rinella M.E., Lazarus J.V., Ratziu V., et al. A multisociety Delphi consensus statement on new fatty liver disease nomenclature. J Hepatol. 2023;79:1542–1556. - PubMed
    1. Younossi Z.M., Golabi P., Paik J.M., et al. The global epidemiology of nonalcoholic fatty liver disease (NAFLD) and nonalcoholic steatohepatitis (NASH): a systematic review. Hepatology. 2023;77:1335–1347. - PMC - PubMed
    1. Finn R.S., Qin S., Ikeda M., et al. Atezolizumab plus bevacizumab in unresectable hepatocellular carcinoma. New Engl J Med. 2020;382:1894–1905. - PubMed

LinkOut - more resources