. 2024 Nov 14:15:1405217.
doi: 10.3389/fimmu.2024.1405217. eCollection 2024.

Unbiased immunome characterisation correlates with COVID-19 mRNA vaccine failure in immunocompromised adults

Affiliations

Unbiased immunome characterisation correlates with COVID-19 mRNA vaccine failure in immunocompromised adults

Juan H-Vázquez et al. Front Immunol. .

Abstract

Introduction: Coronavirus disease 2019 (COVID-19) affects the population unequally, with a greater impact on older and immunosuppressed people.

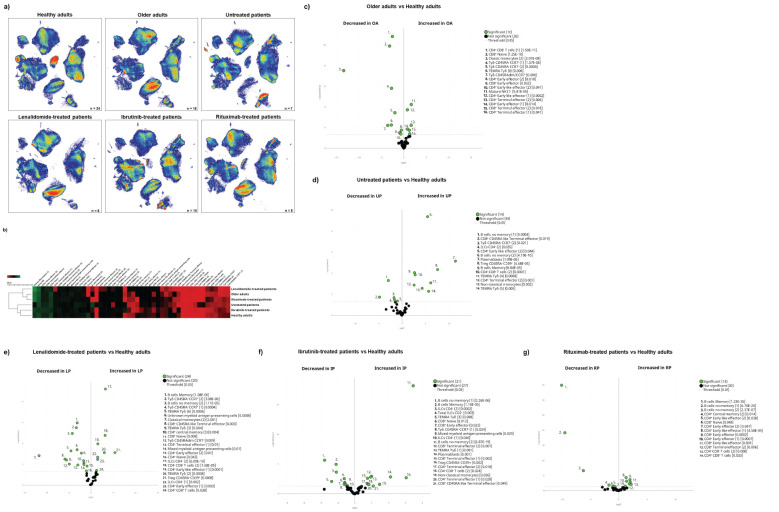
Methods: Hence, we performed a prospective experimental cohort study to characterise the effect of severe acute respiratory syndrome coronavirus 2 (SARS-CoV-2) vaccination in immune-compromised patients (older adults and oncohaematologic patients), compared with healthy counterparts, based on deep characterisation of the circulating immune cell subsets.

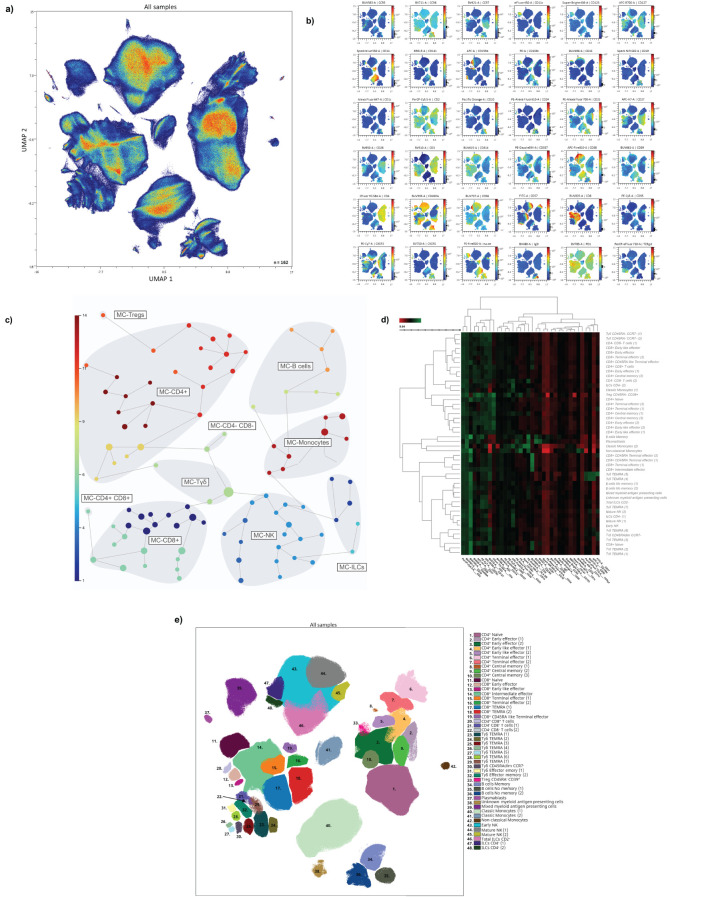
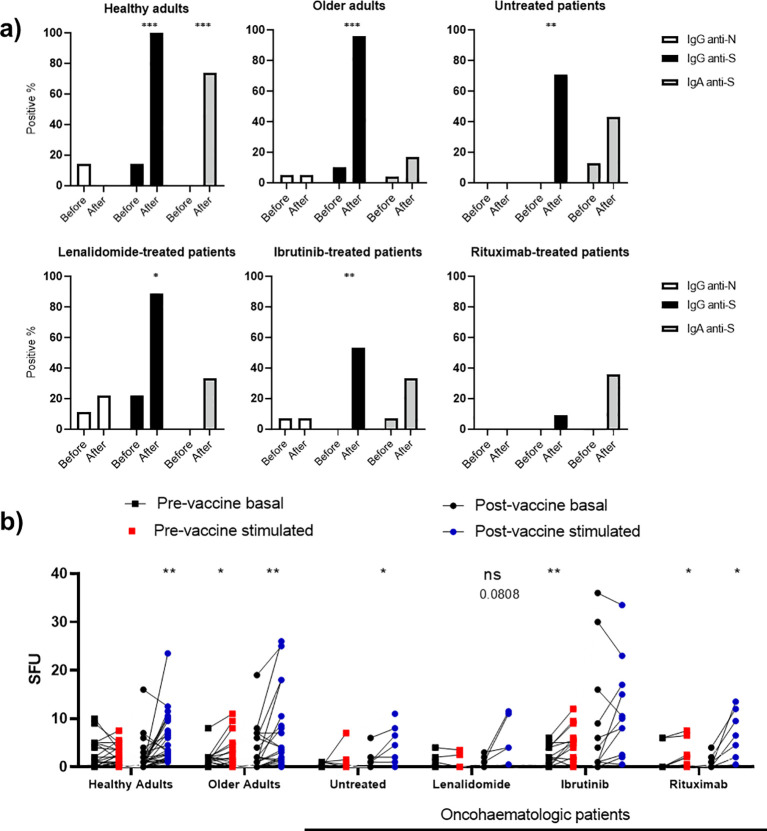
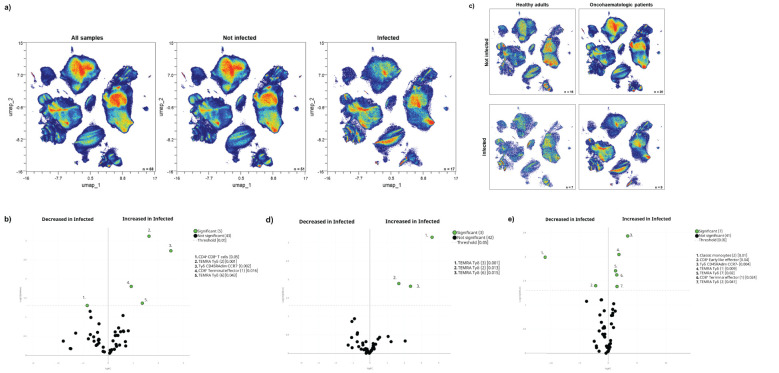
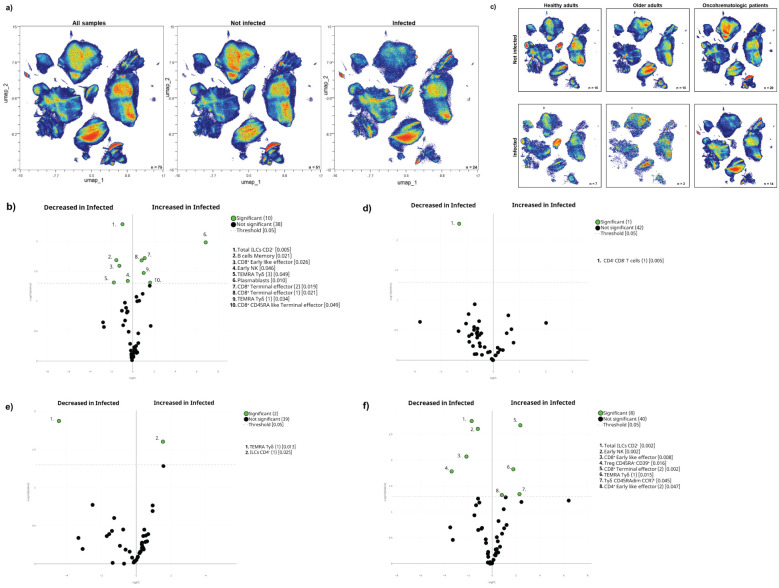
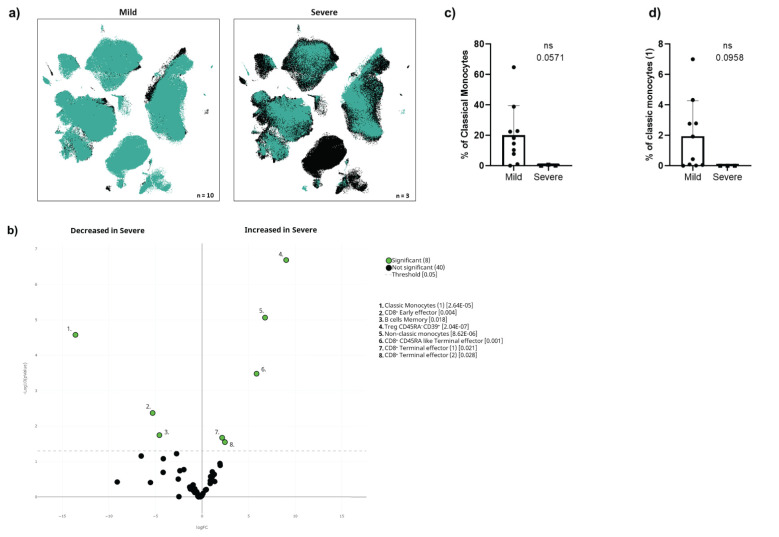
Results and discussion: While acquired humoral and cellular memory did not predict subsequent infection 18 months after full vaccination, spectral and computational cytometry revealed several subsets within the CD8+ T-cells, B-cells, natural killer (NK) cells, monocytes and TEMRA Tγδ cells that were differentially expressed in individuals who were subsequently infected and not infected not just following immunisation, but also prior to vaccination. Of note, we found up to seven clusters within the TEMRA Tγδ cell population, with some of them being expanded and others decreased in subsequently infected individuals. Moreover, some of these cellular clusters were also related to COVID-19-induced hospitalisation in oncohaematologic patients. Therefore, we have identified a cellular signature that even before vaccination is related to COVID-19 vulnerability as opposed to the acquisition of cellular and/or humoral memory following vaccination with SARS-CoV-2 messenger RNA (mRNA) vaccines.

Keywords: COVID-19; computational cytometry; immunocompromised adult; immunome; vaccine failure.


Conflict of interest statement

The authors declare that the research was conducted in the absence of any commercial or financial relationships that could be construed as a potential conflict of interest.

Figures

Figure 1
Figure 1
Immunome characterisation following UMAP analysis. (A) UMAP analysis was performed within total singlet viable CD45+ cells from all samples (n = 162). Subsequent down-sampling to a total of 4 × 10⁶ events was performed so that each cohort was equally represented. Surface expression intensities of the remaining 36 analysed markers are shown in (B). The colour code is based on the intensity, where red represents higher expression and blue represents lower expression. (C) FlowSOM analysis of total singlet viable CD45+ cells identified the main metaclusters of the dataset: B-cells, NK cells, ILCs, Tγδ cells, Tregs, CD4+ T-cells, CD8+ T-cells, CD4+CD8+ T-cells and CD4CD8 T-cells. (D) Heatmap displaying the intensity levels of each marker within the 48 identified clusters. The colour code is based on the expression intensity, where green represents higher expression and the transition to red represents lower expression. A dendrogram was generated by unsupervised hierarchical clustering. (E) All 48 identified clusters were overlaid on the UMAP projection (n = 162). Each identified cluster is tagged with a specific colour and number as shown in the legend.
Figure 2
Figure 2
Cohort differences before vaccination. (A) The general UMAP plot displays the cohort distribution before vaccination, including healthy adults (n = 24), older adults (n = 18), untreated oncohaematologic patients (n = 7), lenalidomide-treated oncohaematologic patients (n = 8), ibrutinib-treated oncohaematologic patients (n = 14) and rituximab-treated oncohaematologic patients (n = 8). (B) The heatmap displays the intensity levels of each of the 48 identified clusters within the cohorts. The colour code is based on the expression intensity, where green represents higher expression and the transition to red represents lower expression. The dendrogram was generated by unsupervised hierarchical clustering. Volcano plots comparing the clusters identified in Table 1 and Figure 1 between healthy adults (n = 24) and (C) older adults (n = 18), (D) untreated patients (n = 7), (E) lenalidomide-treated oncohaematologic patients (n = 8), (F) ibrutinib-treated oncohaematologic patients (n = 14) and (G) rituximab-treated oncohaematologic patients (n = 8). The colour code is based on the expression intensity, where red represents higher expression and the transition to green represents lower expression. For the volcano plots, differentially expressed clusters (p < 0.05) in the comparisons are highlighted in green. Due to the low number of events, some clusters could not be analysed in (C) (CD45RA CD39 + Tregs, non-classical monocytes, plasmablasts, CD4CD8 T-cells [2], TEMRA Tγδ cells [4] and TEMRA Tγδ cells [5]), (D) (non-classical monocytes, plasmablasts, TEMRA Tγδ cells [4] and TEMRA Tγδ cells [5]) and (G) (Tregs CD45RA –/ CD39 + , non-classical monocytes, plasmablasts and TEMRA Tγδ cells [4]).
Figure 3
Figure 3
Vaccine-induced humoral and cellular memory. (A) Humoral memory against SARS-CoV-2 before and after vaccination. Anti-S IgG (black) and IgA (shaded) and anti-N IgG (white) were analysed. The results are based on the number of patients with positive serology. (B) Cellular memory against SARS-CoV-2 before and after vaccination analysed with an IFN-γ ELISpot assay. Each cohort was analysed independently by comparing the SFU under both basal (black dots) and SARS-CoV-2 peptide-stimulated (blue and red dots) conditions. Fisher’s exact test was applied in (A), while a paired one-way ANOVA was applied in (B). In all cases, p < 0.05 was considered significant (*p < 0.05; **p < 0.01; ***p < 0.001), while p < 0.10 was considered not significant (ns) but with a relevant trend (the exact p-value is shown).
Figure 4
Figure 4
Cellular immunome post-vaccination predicts subsequent SARS-CoV-2 infection. (A) All samples following full vaccination (n = 68) are displayed in the UMAP density plots based on their subsequent infection (n = 17) defined by a positive PCR test. (B) Volcano plot comparing the clusters identified in Table 1 and Figure 1 based on subsequent infection (n = 17). (C) UMAP density plots of the infected and non-infected samples are displayed for healthy adults and oncohaematologic patients. Volcano plots comparing infected versus non-infected (D) healthy adults (n = 7 and n = 16, respectively) and (E) oncohaematologic patients (n = 9 and n = 20, respectively). For the UMAP plots, the colour code is based on the intensity, where red represents higher expression and blue represents lower expression. For the volcano plots, differentially expressed clusters (p < 0.05) in the comparisons are highlighted in green. Due to the low number of events, some clusters could not be analysed in (D) (plasmablasts, CD4 CD8 T-cells [2] and TEMRA Tγδ cells [4]).
Figure 5
Figure 5
The pre-vaccination cellular immunome predicts SARS-CoV-2 infection. (A) All samples before the first vaccine dose (n = 75) are displayed in the UMAP density plots based on their subsequent infection. (B) A general volcano plot comparing the clusters identified in Table 1 and Figure 1 before vaccination based on subsequent infection. (C) UMAP density plots of the cohorts before being vaccinated are shown with the following colours: blue (healthy adults), purple (older adults) and green (oncohaematologic patients), relative to all samples (shown in black). Specific volcano plots of infected versus non-infected (D) healthy controls (n = 7 and n = 16, respectively), (E) older adults (n = 3 and n = 15, respectively) and (F) oncohaematologic patients (n = 14 and n = 20, respectively) are also shown. For the UMAP plots, the colour code is based on the intensity, where red represents higher expression and blue represents lower expression. For the volcano plots, differentially expressed clusters (p < 0.05) in the comparisons are highlighted in green. Due to the low number of events, some clusters could not be analysed in (D) (CD45RA /CD39 + Tregs, non-classical monocytes, plasmablasts, CD4 /CD8 T-cells [2] and TEMRA Tγδ cells [4]) and (E) (classic monocytes [2], CD45RA /CD39 + Tregs, non-classical monocytes, plasmablasts, CD4 /CD8 T-cells [2], TEMRA Tγδ cells [4] and TEMRA Tγδ cells [5]).
Figure 6
Figure 6
Cellular immunome before vaccination predicts COVID-19-induced hospitalisation. (A) UMAP plot of pre-vaccination samples of infected oncohaematologic patients according to the COVID-19 outcome defined as mild (left, no need for hospitalisation, n = 10) or severe (right, hospitalisation required, n = 3). (B) Volcano plot analysis comparing the clusters identified in Table 1 and Figure 1 for the infected oncohaematologic patients based on the COVID-19 outcome. (C) Classical validation, following the gating strategy shown in Supplementary Figure S1 , of total monocytes, and (D) the classic monocyte (1) cluster. In (B), green dots represent those clusters that showed significant differences (p < 0.05). A one-tailed t-test was applied for (C) and (D); the p-values are shown in the figures (ns, not statistically significant).

References

    1. Perico L, Todeschini M, Casiraghi F, Mister M, Pezzotta A, Peracchi T, et al. . Long-term adaptive response in COVID-19 vaccine recipients and the effect of a booster dose. Front Immunol. (2023) 14. doi: 10.3389/fimmu.2023.1123158 - DOI - PMC - PubMed
    1. Li H, Ma Q, Ren J, Guo W, Feng K, Li Z, et al. . Immune responses of different COVID-19 vaccination strategies by analyzing single-cell RNA sequencing data from multiple tissues using machine learning methods. Front Genet. (2023) 14. doi: 10.3389/fgene.2023.1157305 - DOI - PMC - PubMed
    1. Sagar M, Reifler K, Rossi M, Miller NS, Sinha P, White LF, et al. . Recent endemic coronavirus infection is associated with less-severe COVID-19. J Clin Invest. (2021) 131. doi: 10.1172/JCI143380 - DOI - PMC - PubMed
    1. Casado JL, Vizcarra P, Martín-Hondarza A, Blasco M, Grandal-Platero M, Haemmerle J, et al. . Impact of Previous Common Human Coronavirus Exposure on SARS-CoV-2-Specific T-Cell and Memory B-Cell Response after mRNA-Based Vaccination. Viruses. (2023) 15:627. doi: 10.3390/v15030627 - DOI - PMC - PubMed
    1. Rescigno M, Agrati C, Salvarani C, Giannarelli D, Costantini M, Mantovani A, et al. . Neutralizing antibodies to Omicron after the fourth SARS-CoV-2 mRNA vaccine dose in immunocompromised patients highlight the need of additional boosters. Front Immunol. (2023) 14. doi: 10.3389/fimmu.2023.1104124 - DOI - PMC - PubMed