. 2024 Nov 12;6(6):fcae400.
doi: 10.1093/braincomms/fcae400. eCollection 2024.

Alternatively activated macrophages are associated with faster growth rate in vestibular schwannoma

Affiliations

Alternatively activated macrophages are associated with faster growth rate in vestibular schwannoma

Grace E Gregory et al. Brain Commun. .

Abstract

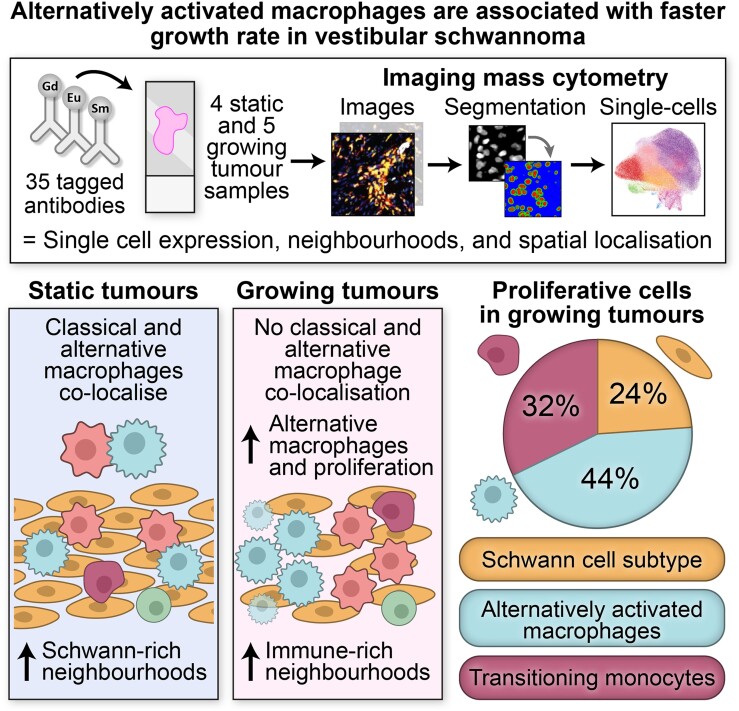
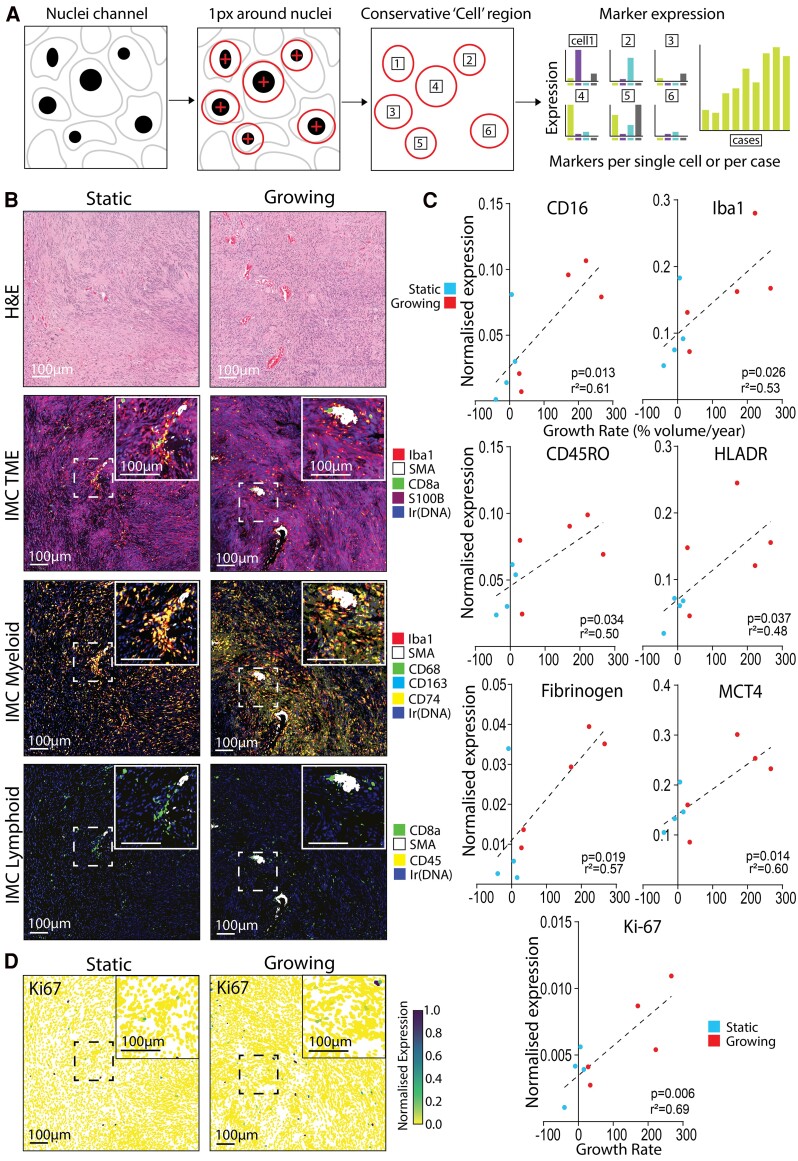
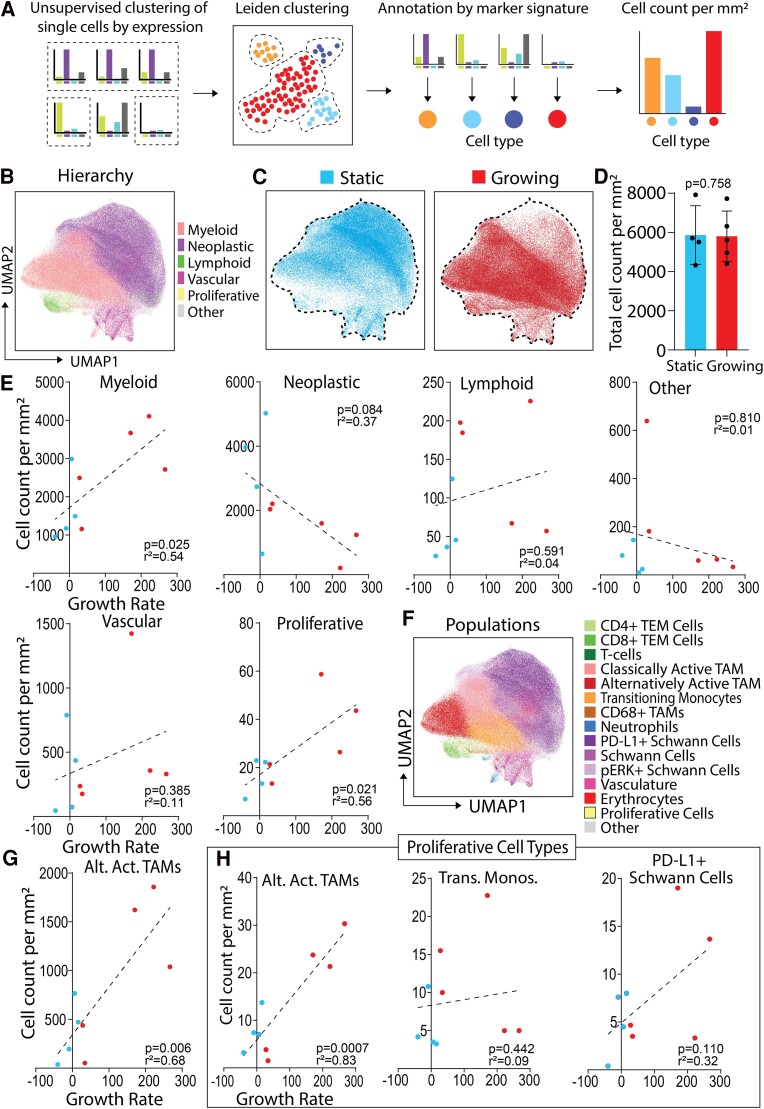
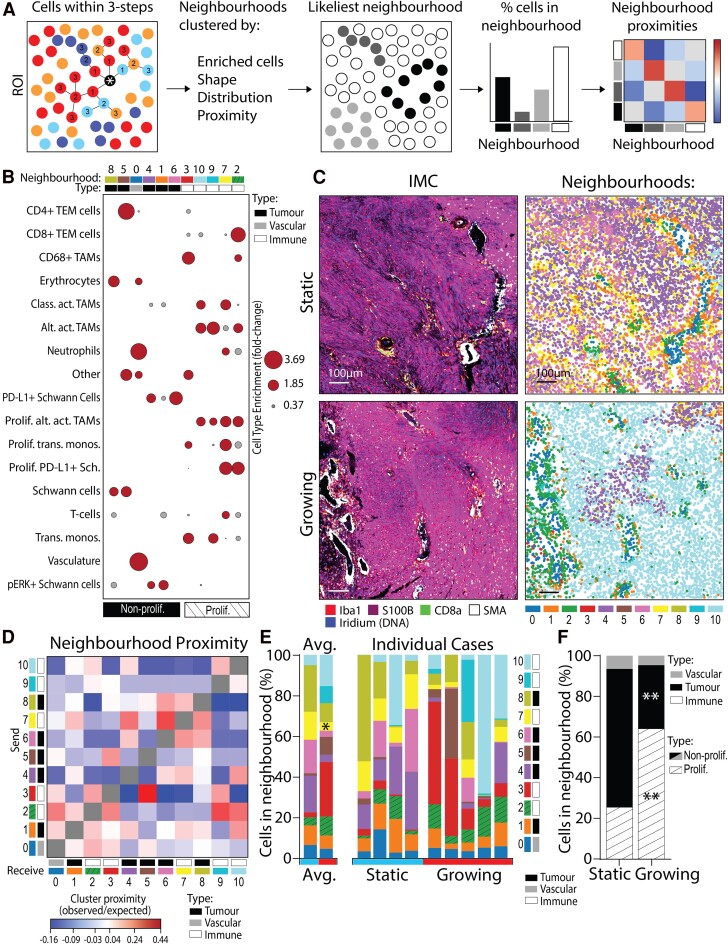
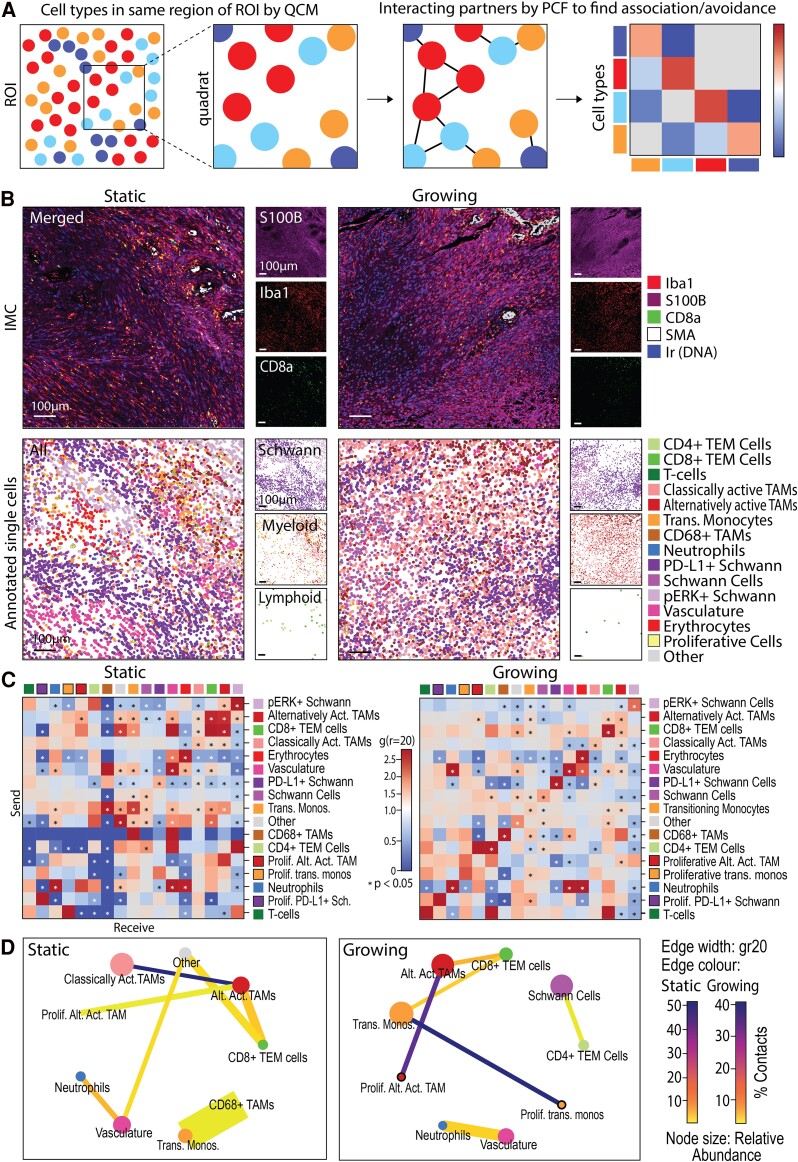
The variability in vestibular schwannoma growth rates greatly complicates clinical treatment. Management options are limited to radiological observation, surgery, radiotherapy and, in specific cases, bevacizumab therapy. As such, there is a pressing requirement for growth restricting drugs for vestibular schwannoma. This study explored potential predictors of vestibular schwannoma growth in depth, highlighting differences between static and growing vestibular schwannoma to identify potential therapeutic targets. High-dimensional imaging was used to characterize the tumour micro-environment of four static and five growing vestibular schwannoma (indicated by volumetric change < 20% or ≥ 20% per year, respectively). Single-cell spatial information and protein expression data from a panel of 35 tumour immune-targeted antibodies identified specific cell populations, their expression profiles and their spatial localization within the tumour micro-environment. Growing vestibular schwannoma contained significantly more proliferative and non-proliferative alternatively activated tumour-associated macrophages per millimetre square compared with static vestibular schwannoma. Furthermore, two additional proliferative cell types were identified in growing and static vestibular schwannoma: transitioning monocytes and programmed cell death ligand 1 (PD-L1+) Schwann cells. In agreement, growing vestibular schwannoma was characterized by a tumour micro-environment composed of immune-enriched, proliferative neighbourhoods, whereas static vestibular schwannoma were composed of tumour-enriched, non-proliferative neighbourhoods. Finally, classically activated macrophages significantly colocalized with alternatively activated macrophages in static vestibular schwannoma, but this sequestration was reduced in growing vestibular schwannoma. This study provides a novel, spatial characterization of the immune landscape in growing vestibular schwannoma, whilst highlighting the need for new therapeutic targets that modulate the tumour immune micro-environment.

Keywords: acoustic neuroma; inflammation; tumour micro-environment; tumour-associated macrophage; vestibular schwannoma.


Conflict of interest statement

The authors report no competing interests.

Figures

Graphical Abstract
Graphical Abstract
Figure 1
Figure 1
Enriched expression of myeloid and effector T cell markers correlate with growth rate in VS. (A) Schematic detailing how single cell expression data were generated from hyperion IMC images. (B) H&E and IMC-stained static and growing VS tissue (volume change/year < 20% or ≥ 20%, respectively) where inserts highlight areas of vascular-associated higher immune cell density within the VS region of interest. IMC images illustrate cell state–specific markers for general tumour micro-environment, myeloid cells and lymphoid cells. (C) Single-cell expression data extracted from the IMC images from four static (three male and one female) and five growing (four male and one female) VS and single-cell marker expression was averaged per case. All markers with expression that significantly correlated with volumetric growth rate are visualized. Shapiro–Wilk normality test followed by two-tailed Pearson correlation with simple linear regression. Correlation coefficient significance when P < 0.05. (D) Single-cell normalized expression of Ki-67, marker of cell proliferation, across all cells within the same regions of interest for static and growing VS displayed in (B). All scale bars denote 100 µm.
Figure 2
Figure 2
Myeloid alternatively activated TAMs correlate with VS growth rate and have increased proliferative marker expression. (A) Schematic detailing of how single-cell expression data were clustered and annotated into specific cell type populations. (B) Leiden clustering of all single cells from four static (three male and one female) and five growing (four male and one female) VS manually annotated into hierarchical cell types, visualized by UMAP. Static or growing VS were defined as volume change/year < 20% or ≥ 20%, respectively. (C) UMAPs of single cells from either static or growing VS. (D) Total cell count per millimetre square from static (N = 4) or growing (N = 5) cases. Shapiro–Wilk normality test followed by two-tailed unpaired t-test. Statistical significance when P < 0.05. (E) Correlations of cell count per millimetre square of hierarchical cell types per case (N = 9) with VS growth rate. Shapiro–Wilk normality test followed by two-tailed Pearson correlation or two-tailed Spearman correlation with simple linear regression for cell count per millimetre square against growth rate. Correlation coefficient significance when P < 0.05. (F) Leiden clustering and annotation of the six hierarchical cell types into 15 more granular populations, visualized on UMAP. (G and H) Statistical analysis as per (E). Alternatively activated TAMs correlated with volumetric growth rate (G). Growth rate correlations from Leiden sub-clustering of proliferative cells into proliferative populations of alternatively activated TAMs, transitioning monocytes and PD-L1+ Schwann cells (H). Alt. Act. TAMs, alternatively activated TAMs; trans. monos., transitioning monocytes.
Figure 3
Figure 3
Growing VS have more cells residing in proliferative, immune-enriched neighbourhoods. (A) Schematic detailing how the cells within a three-step connection from the target cell define a single cell’s local environment (neighbourhood). (B) Cell types enriched within each neighbourhood plotted and used to annotate whether neighbourhoods were tumour-enriched, vasculature-enriched or immune-enriched, as well as whether they contained proliferative cells. Fold change (FC) of cell type enrichment represented by node size, with grey FC < 1 and red FC ≥ 1. Neighbourhood cell type enrichment analysis included all cells from all VS cases (N = 9). (C) IMC images with matched neighbourhood plots of cells coloured by 11 annotated neighbourhoods. Scale bars denote 100 µm. (D) Neighbourhood proximity analysis used pairwise analytical neighbourhood enrichment (CellCharter) to define whether pairs of the 11 neighbourhoods were likely to associate positively or negatively with one-another when compared with random chance (observed/expected). Neighbourhood proximity analysis included all cells from all VS cases (N = 9). (E) Proportions of cells within each neighbourhood by individual case and averaged from in four static (three male and one female) and five growing (four male and one female) VS. Static or growing VS defined as volume change/year < 20% or ≥ 20%, respectively. Shapiro–Wilk normality test followed by Mann–Whitney test for static (N = 4) and growing (N = 5) cases. (F) Proportion of cells in proliferative/non-proliferative neighbourhoods in static and growing VS, as per annotation in (D). Shapiro–Wilk normality test followed by 2-way ANOVA for static (N = 4) and growing (N = 5) cases. Statistical significance *P < 0.05, **P < 0.01. Prolif., proliferative; Alt. Act. TAMs, alternatively activated TAMs; Class. Act. TAMs, classically activated TAMs; trans. monos., transitioning monocytes; IMC, imaging mass cytometry.
Figure 4
Figure 4
Classically activated TAMs associate with alternatively activated TAMs in static but not growing VS. (A) Schematic detailing how significant positive and negative cell–cell spatial associations are first determined by QCM in 100 µm2 quadrats and then cross pair correlation functions (cross-PCF). (B) IMC images matched with centroid XY location plots of cells coloured by their annotated populations. Scale bars denote 100 µm. (C) Significant positively and negatively associating cell type pairs at a distance of 20 µm (gr20) by cross-PCF (significance when P < 0.05) in static (N = 4, three male and one female) and growing (N = 5, four male and one female) VS cases (volume change/year < 20% or ≥ 20%, respectively). (D) Summary adjacency cell networks of cell populations in static (N = 4) and growing (N = 5) VS indicating significant spatial associations by both QCM and PCF (significance when P < 0.05). Edge width proportional to gr20, edge colour by % total contacts of the sending cell type to receiving cell type. Node size by proportional relative abundance, node colour by cell type. prolif., proliferative; trans. monos., transitioning monocytes; Sch., Schwann cells; Alt. Act. TAMs, alternatively activated TAMs.

References

    1. Gareth Evans DR, Moran A, King A, Saeed S, Gurusinghe N, Ramsden R. Incidence of vestibular schwannoma and neurofibromatosis 2 in the north west of England over a 10-year period: Higher incidence than previously thought. 2005. Accessed 16 May 2024. http://journals.lww.com/otology-neurotology - PubMed
    1. Ren Y, Chari DA, Vasilijic S, Welling DB, Stankovic KM. New developments in neurofibromatosis type 2 and vestibular schwannoma. Neurooncol Adv. 2021;3(1):vdaa153. - PMC - PubMed
    1. Schnurman Z, Nakamura A, McQuinn MW, Golfinos JG, Roland JT, Kondziolka D. Volumetric growth rates of untreated vestibular schwannomas. J Neurosurg. 2020;133(3):742–748. - PubMed
    1. Marinelli JP, Beeler CJ, Carlson ML, Caye-Thomasen P, Spear SA, Erbele ID. Global incidence of sporadic vestibular schwannoma: A systematic review. Otolaryngol Neck Surg. 2022;167(2):209–214. - PubMed
    1. Plotkin SR, Merker VL, Halpin C, et al. Bevacizumab for progressive vestibular schwannoma in neurofibromatosis type 2: A retrospective review of 31 patients. Otol Neurotol. 2012;33(6): 1046–1052. - PubMed

LinkOut - more resources