. 2025 Feb;31(2):41.
doi: 10.3892/mmr.2024.13406. Epub 2024 Nov 29.

Role of CALCR expression in liver cancer: Implications for the immunotherapy response

Affiliations

Role of CALCR expression in liver cancer: Implications for the immunotherapy response

Sijia Wang et al. Mol Med Rep. 2025 Feb.

Abstract

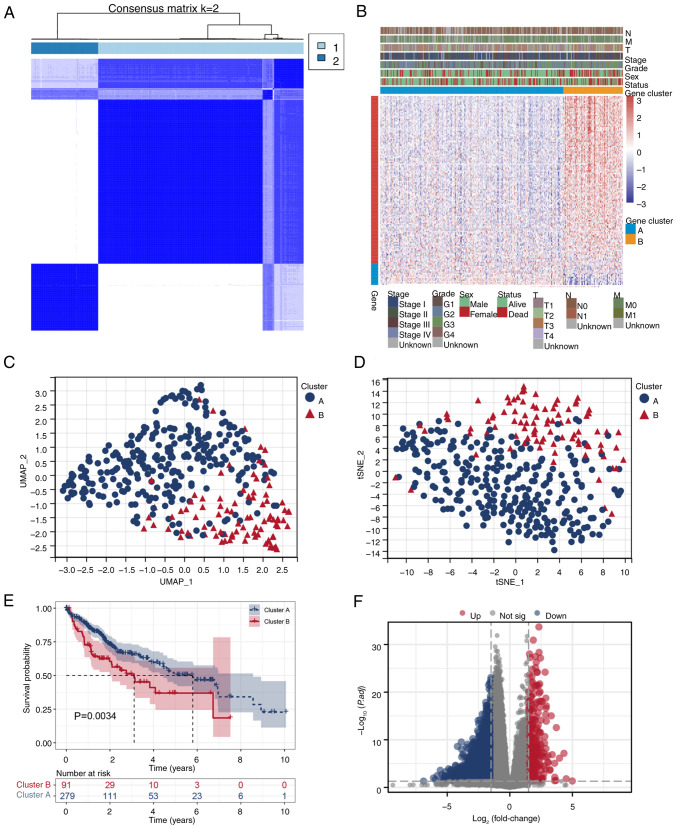
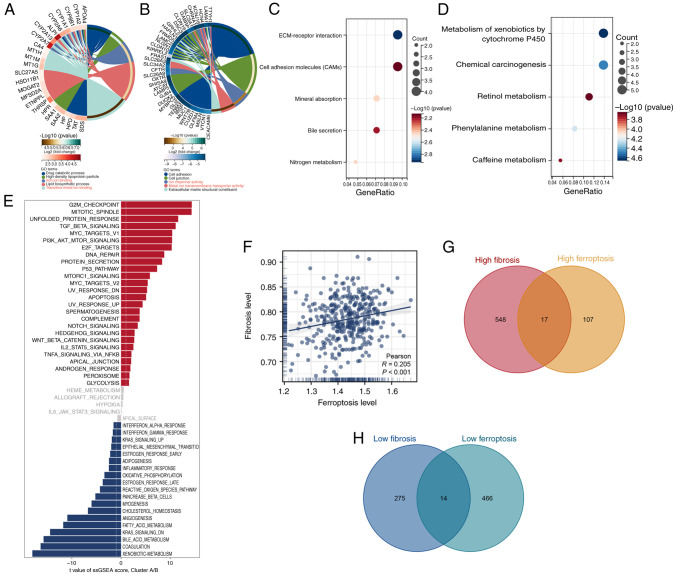
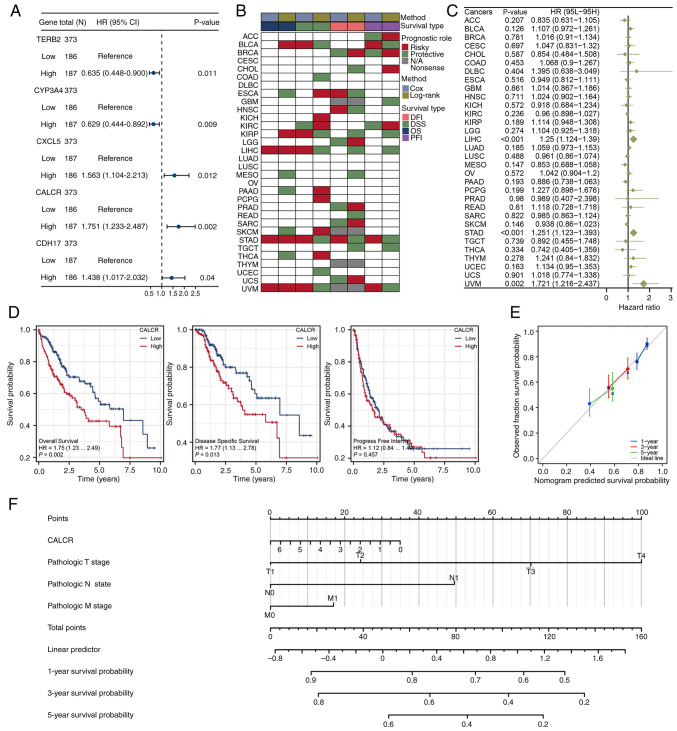
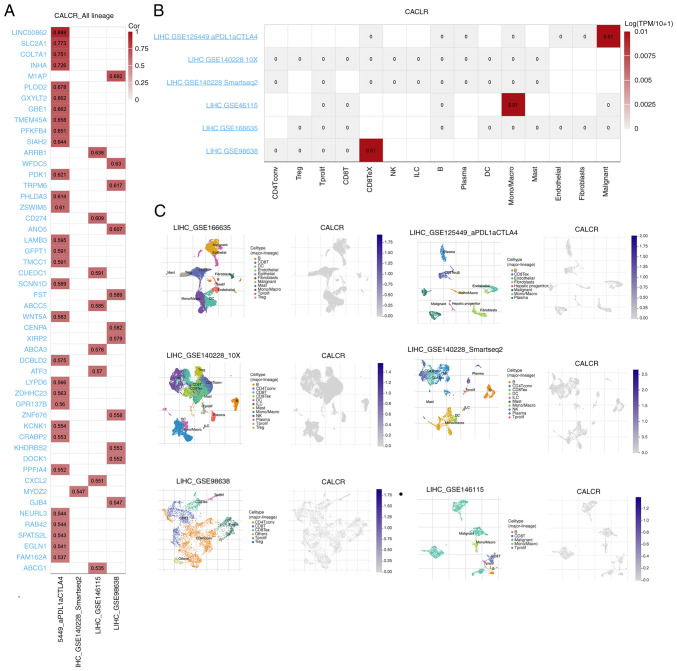
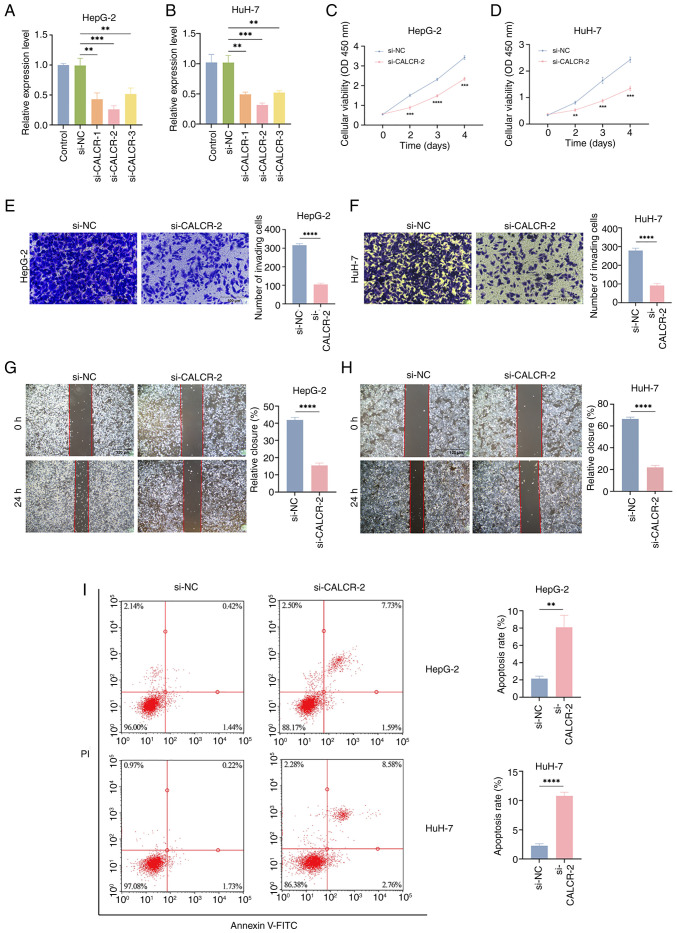
Liver hepatocellular carcinoma (LIHC) is a prevalent and lethal malignancy with a complex molecular landscape. Fibrosis and ferroptosis are implicated in LIHC progression, yet their roles remain to be elucidated. The present study investigated the expression and prognostic significance of calcitonin receptor (CALCR), a gene that intersects the pathways of fibrosis and ferroptosis, across LIHC and other types of cancer. Data were obtained from The Cancer Genome Atlas and the Molecular Signatures Database. LIHC patients were classified into two clusters based on fibrosis‑related gene expression using ConsensusClusterPlus. Single‑sample gene set enrichment analysis was employed to quantify fibrosis and ferroptosis levels. Correlation, survival and nomogram analyses were performed to assess the prognostic value of CALCR. Additionally, single‑cell RNA sequencing data from the Tumor Immune Single Cell Hub 2 (TISCH2) and pan‑cancer analyses of genomic heterogeneity features were incorporated. The present study also identified a putative regulatory role for CALCR in LIHC cell migration, proliferation and apoptosis. CALCR was identified as a significant prognostic marker for LIHC. Patients with high CALCR expression exhibited shortened overall survival (OS) and disease‑specific survival (DSS). Specifically, the hazard ratios (HRs) for OS and DSS were 1.76 [95% confidence interval (CI): 1.23=2.49) and 1.77 (95% CI: 1.13=2.78], respectively, with corresponding P‑values of 0.002 for OS and 0.013 for DSS. Analyses of immune cell infiltration revealed a more complex immune environment in patients with low CALCR expression, suggesting differential responses to immunotherapy. Furthermore, in HepG‑2 and HuH‑7 cells, small interfering (si)‑CALCR increased apoptosis while reducing proliferation and migration compared with si‑negative control. CALCR serves as a significant prognostic biomarker for LIHC, influencing both molecular pathways and the immune landscape. Its expression is associated with improved survival outcomes and distinct genomic features, positioning it as a potential therapeutic target and predictor of immunotherapy efficacy.

Keywords: calcitonin receptor; ferroptosis; fibrosis; genomic heterogeneity; liver hepatocellular carcinoma.


Conflict of interest statement

The authors declare that they have no competing interests.

Figures

Figure 1.
Figure 1.
Identification and characterization of fibrosis-related clusters in LIHC. (A) Consensus clustering of LIHC patients using the hepatic fibrosis gene set identified two distinct clusters. (B) Heatmap showing the unsupervised hierarchical clustering of genes positively and negatively associated with the two clusters. (C) UMAP and (D) tSNE plots displaying the distribution of gene expression profiles between Cluster A and Cluster B. (E) Kaplan-Meier survival analysis comparing the overall survival of patients in Cluster A and Cluster B, showing that Cluster A patients have an improved prognosis. (F) Volcano plot illustrating the differentially expressed genes between Cluster A and Cluster B, highlighting significant genes with an adjusted P-value <0.05 and absolute log2 fold change >1. Data for the LIHC samples were obtained from The Cancer Genome Atlas (https://www.cancer.gov/) and Genotype-Tissue Expression (https://www.gtexportal.org/) projects and the fibrosis gene set was obtained from Molecular Signatures Database (https://www.gsea-msigdb.org/). LIHC, liver hepatocellular carcinoma; UMAP, uniform manifold approximation and projection; tSNE, t-distributed stochastic neighbor embedding.
Figure 2.
Figure 2.
Functional enrichment and correlation analyses in fibrosis-related clusters. (A) GO enrichment analysis of Cluster A, showing significant enrichment in pathways related to iron ion binding and transition metal ion binding. (B) GO enrichment analysis of Cluster B, indicating significant enrichment in pathways associated with ion channel activity and metal ion transmembrane transporter activity. Kyoto Encyclopedia of Genes and Genomes pathway analysis of (C) Cluster A and (D) Cluster B, highlighting the significantly enriched pathways. (E) Differential analysis of hallmark pathways quantified using the ssGSEA algorithm, comparing Cluster A and Cluster B. (F) Correlation analysis between fibrosis levels and ferroptosis levels in patients, showing a positive correlation. Venn diagram of differentially expressed genes in (G) high/low ferroptosis and (H) high/low fibrosis clusters, illustrating the intersecting genes. Data for the LIHC samples were obtained from The Cancer Genome Atlas (https://www.cancer.gov/) and Genotype-Tissue Expression (https://www.gtexportal.org/) projects and the fibrosis gene set was obtained from Molecular Signatures Database (https://www.gsea-msigdb.org/). GO, Gene Ontology; ssGSEA, single-sample Gene Set Enrichment Analysis; LIHC, liver hepatocellular carcinoma.
Figure 3.
Figure 3.
Prognostic evaluation of CALCR in pan-cancer and LIHC. (A) Forest plot from univariate Cox regression analysis showing five significant genes, with CALCR having the smallest P-value. (B) Prognostic eddect of CALCR in the TCGA pan-cancer dataset, including OS, DFI, DSS and PFI. (C) Forest plot illustrating the prognostic significance of CALCR based on OS across different types of cancer. (D) Kaplan-Meier survival analysis of CALCR in LIHC for OS, DSS and PFI, showing significant associations with OS and DSS. (E) Prognostic calibration curve for CALCR, indicating good consistency with the ideal curve. (F) Nomogram constructed using CALCR expression and clinical features (T, N, M stages) to predict patient outcomes. Data for the LIHC samples were obtained from The Cancer Genome Atlas (https://www.cancer.gov/) and Genotype-Tissue Expression (https://www.gtexportal.org/) projects and the fibrosis gene set was obtained from Molecular Signatures Database (https://www.gsea-msigdb.org/). CALCR, calcitonin receptor; LIHC, liver hepatocellular carcinoma; TCGA, The Cancer Genome Atlas; OS, overall survival; DFI, disease-free interval; DSS, disease-specific survival; PFI, progression-free interval; HR, hazard ratio.
Figure 4.
Figure 4.
Single-cell analysis of CALCR in LIHC using TISCH2 database. (A) Correlation analysis showing genes highly associated with CALCR across different LIHC datasets. (B) Analysis of CALCR expression correlation with various cell lines in different LIHC datasets, showing no significant associations. (C) Distribution of cell types in LIHC datasets and the expression pattern of CALCR across these cell types. Data for the LIHC samples were obtained from The Cancer Genome Atlas (https://www.cancer.gov/) and Genotype-Tissue Expression (https://www.gtexportal.org/) projects and the fibrosis gene set was obtained from Molecular Signatures Database (https://www.gsea-msigdb.org/). CALCR, calcitonin receptor; LIHC, liver hepatocellular carcinoma; TISCH2, Tumor Immune Single Cell Hub 2.
Figure 5.
Figure 5.
Differential expression and pathway correlation analysis of CALCR in pan-cancer and LIHC. (A) Pan-cancer differential expression analysis of CALCR, showing significant differences in expression across various cancer types, including LIHC. (B) Correlation analysis of CALCR expression with hallmark pathways in LIHC. (C and D) Gene Ontology and Kyoto Encyclopedia of Genes and Genomes pathway analysis in LIHC patients, comparing high and low CALCR expression clusters, revealing significant pathway and biological process differences. Data for the LIHC samples were obtained from The Cancer Genome Atlas (https://www.cancer.gov/) and Genotype-Tissue Expression (https://www.gtexportal.org/) projects and the fibrosis gene set was obtained from Molecular Signatures Database (https://www.gsea-msigdb.org/). *P<0.05, ***P<0.001, ****P<0.0001. CALCR, calcitonin receptor; LIHC, liver hepatocellular carcinoma.
Figure 6.
Figure 6.
Correlation and genomic heterogeneity analyses of CALCR. (A) Correlation analysis between CALCR expression and 44 RNA modification marker genes (m1A, m5C, m6A) in LIHC. (B) Analysis of the correlation between CALCR expression and genomic heterogeneity features (TMB, MSI, NEO, HRD) across various types of cancer, with positive correlations observed in LIHC. (C) Differential expression analysis of CALCR in CNV loss and CNV gain clusters across various types of cancer, showing no significant difference in LIHC. (D) Mutation landscape of CALCR in a pan-cancer context. (E) Waterfall plot of differentially mutated genes between high and low CALCR expression clusters in LIHC. Data for the LIHC samples were obtained from The Cancer Genome Atlas (https://www.cancer.gov/) and Genotype-Tissue Expression (https://www.gtexportal.org/) projects and the fibrosis gene set was obtained from Molecular Signatures Database (https://www.gsea-msigdb.org/). *P<0.05, **P<0.01, ****P<0.0001. CALCR, calcitonin receptor; LIHC, liver hepatocellular carcinoma; TMB, tumor mutational burden; MSI, microsatellite instability; NEO, neoantigen load; HRD, homologous recombination deficiency; CNV, copy number variation.
Figure 7.
Figure 7.
Immune infiltration and immunotherapy response linked to CALCR. Correlation analysis of (A) stromal, (B) immune and (C) ESTIMATE scores with CALCR expression in LIHC using the ESTIMATE algorithm, indicating a negative correlation between ESTIMATE scores and CALCR expression. (D and E) Differential expression analysis of inhibitory immune checkpoint genes and stimulatory immune checkpoint genes between high and low CALCR expression clusters in LIHC. (F) Tumor immune dysfunction and exclusion; analysis comparing high and low CALCR expression clusters, showing significant differences in exclusion levels. (G) Submap analysis suggested that patients with low CALCR expression may respond improved to immunotherapy. The Cancer Genome Atlas (https://www.cancer.gov/) and Genotype-Tissue Expression (https://www.gtexportal.org/) projects and the fibrosis gene set was obtained from Molecular Signatures Database (https://www.gsea-msigdb.org/). ***P<0.001. CALCR, calcitonin receptor; LIHC, liver hepatocellular carcinoma.
Figure 8.
Figure 8.
The role of CALCR in LIHC cell proliferation, migration and apoptosis. According to reverse transcription-quantitative PCR, si-CALCR-2 effectively reduced CALCR expression in HepG-2 (A) and HuH-7 (B) cells. In comparison to the si-NC cluster, the knockdown of CALCR decreased the capacity of both (C) HepG-2 and (D) HuH-7 cells to proliferate. (E and G) HepG-2 and (F and H) HuH-7 cell migration was markedly inhibited by CALCR elimination (E and F magnification, ×200; scale bar, 100 µm; G and H magnification, ×100; scale bar, 120 µm). (I) CALCR knockdown was shown to be able to accelerate apoptosis in HepG-2 and HuH-7 cells using flow cytometry. **P<0.01, ***P<0.001, ****P<0.0001, t-test based P-value. Each experiment was carried out in duplicate and independently. CALCR, calcitonin receptor; LIHC, liver hepatocellular carcinoma; si, small interfering; NC, negative control.

Similar articles

Cited by

References

    1. Siegel RL, Giaquinto AN, Jemal A. Cancer statistics, 2024. CA Cancer J Clin. 2024;74:12–49. doi: 10.3322/caac.21820. - DOI - PubMed
    1. Dopazo C, Søreide K, Rangelova E, Mieog S, Carrion-Alvarez L, Diaz-Nieto R, Primavesi F, Stättner S. Hepatocellular carcinoma. Eur J Surg Oncol. 2024;50:107313. doi: 10.1016/j.ejso.2023.107313. - DOI - PubMed
    1. O'Rourke JM, Sagar VM, Shah T, Shetty S. Carcinogenesis on the background of liver fibrosis: Implications for the management of hepatocellular cancer. World J Gastroenterol. 2018;24:4436–4447. doi: 10.3748/wjg.v24.i39.4436. - DOI - PMC - PubMed
    1. Barry AE, Baldeosingh R, Lamm R, Patel K, Zhang K, Dominguez DA, Kirton KJ, Shah AP, Dang H. Hepatic stellate cells and hepatocarcinogenesis. Front Cell Dev Biol. 2020;8:709. doi: 10.3389/fcell.2020.00709. - DOI - PMC - PubMed
    1. Bataller R, Brenner DA. Liver fibrosis. J Clin Invest. 2005;115:209–218. doi: 10.1172/JCI200524282C1. - DOI - PMC - PubMed

MeSH terms

Substances