

A novel synthetic synovial fluid model for investigating biofilm formation and antibiotic susceptibility in prosthetic joint infections
- PMID: 39612218
- PMCID: PMC11705890
- DOI: 10.1128/spectrum.01980-24
A novel synthetic synovial fluid model for investigating biofilm formation and antibiotic susceptibility in prosthetic joint infections
Abstract
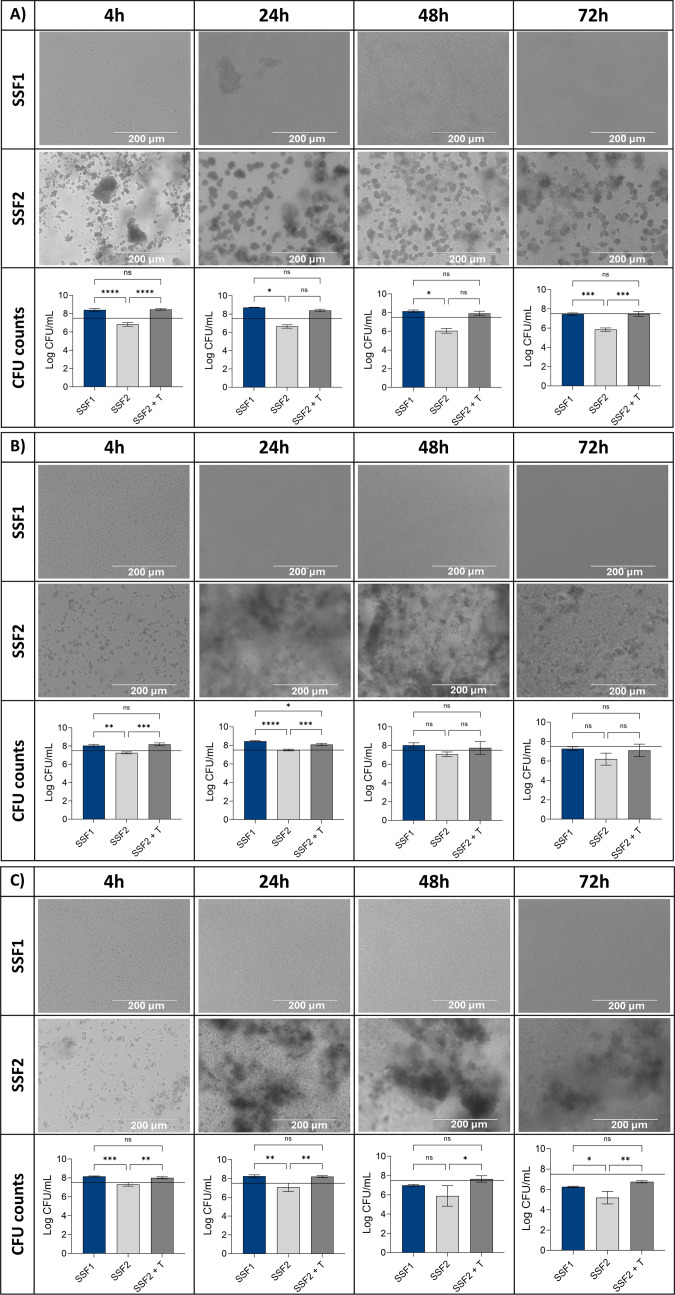
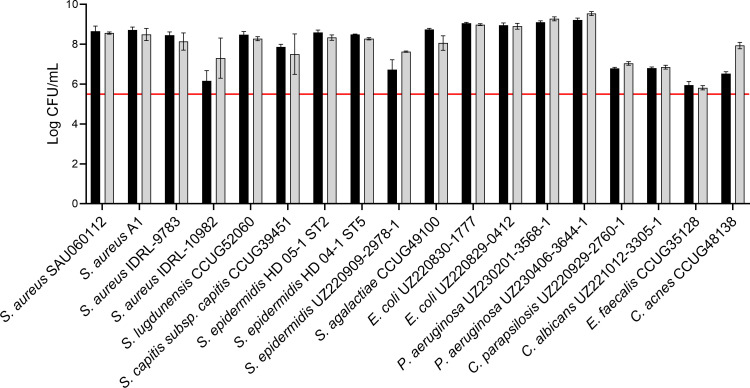
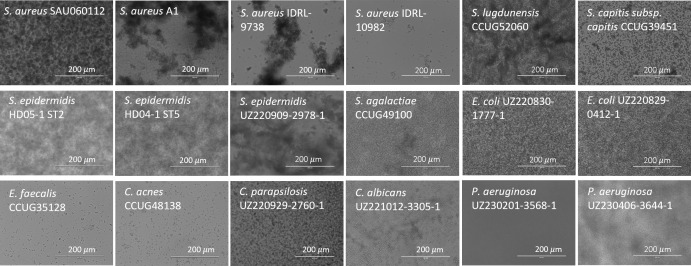
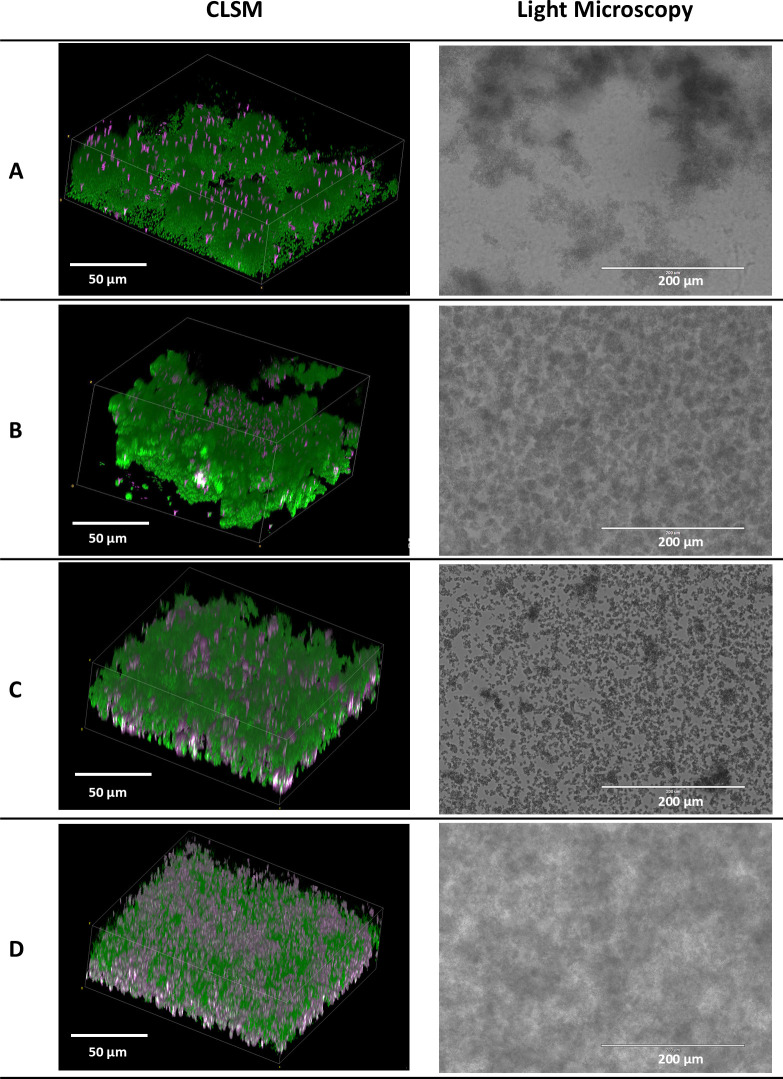
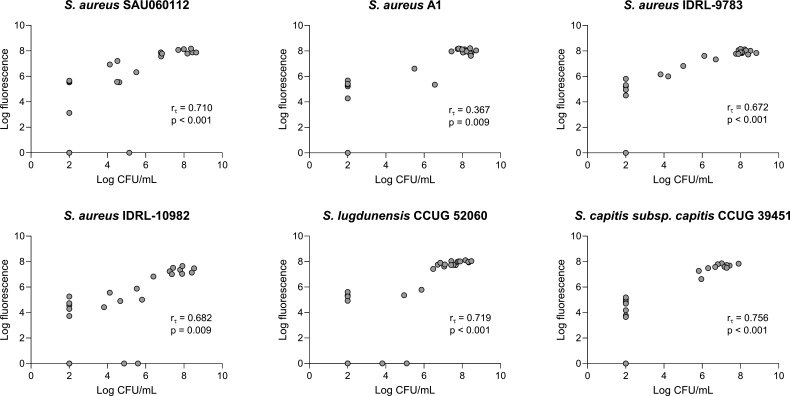
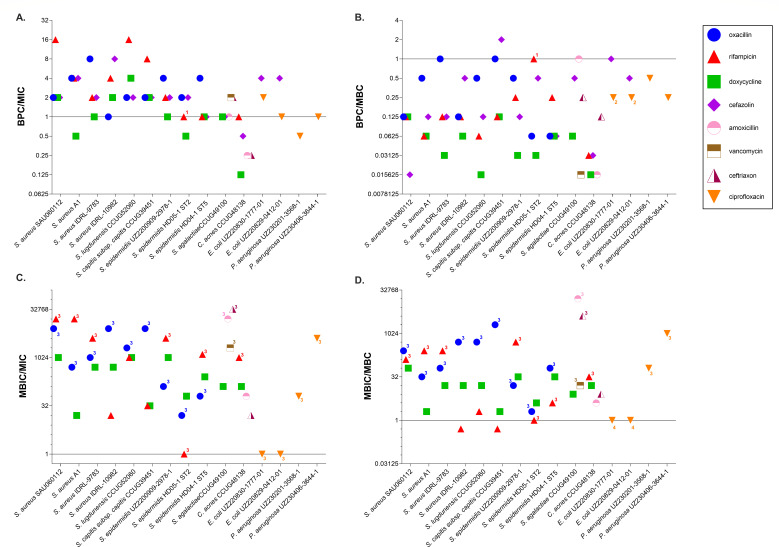
There is growing evidence that bacteria encountered in prosthetic joint infections (PJIs) form surface-attached biofilms on prostheses, as well as biofilm aggregates embedded in synovial fluid and tissues. However, in vitro models allowing the investigation of these biofilms and the assessment of their antimicrobial susceptibility in physiologically relevant conditions are currently lacking. To address this, we developed a synthetic synovial fluid (SSF2) model and validated this model by investigating growth, aggregate formation, and antimicrobial susceptibility using multiple PJI isolates belonging to various microorganisms. In this study, 18 PJI isolates were included belonging to Staphylococcus aureus, coagulase-negative staphylococci, Cutibacterium acnes, Streptococcus spp., Enterococcus spp., Pseudomonas aeruginosa, Escherichia coli, and Candida spp. Growth and aggregate formation in SSF2 were evaluated using light microscopy and confocal laser scanning microscopy. The biofilm preventing concentration (BPC) and minimal biofilm inhibitory concentration (MBIC) of relevant antibiotics were determined using a resazurin-based viability staining. BPC and MBIC values were compared to conventional susceptibility parameters (minimal inhibitory concentration and minimal bactericidal concentration) determined with conventional approaches. The SSF2 medium allowed isolates to grow and form biofilm-like aggregates varying in size and shape between different species. For most isolates cultured in SSF2, a reduced susceptibility to the tested antibiotics was observed when compared to susceptibility data obtained in general media. These data indicate that the in vitro SSF2 model could be a valuable addition to evaluate the antimicrobial susceptibility of biofilm-like aggregates in the context of PJI.
Importance: Infections after joint replacement are rare but can lead to severe complications as they are difficult to treat due to the ability of pathogens to form surface-attached biofilms on the prosthesis as well as biofilm aggregates in the tissue and synovial fluid. This biofilm phenotype, combined with the microenvironment at the infection site, substantially increases antimicrobial tolerance. Conventional in vitro models typically use standard growth media, which do not consider the microenvironment at the site of infection. By replacing these standard growth media with an in vivo-like medium, such as the synthetic synovial fluid medium, we hope to expand our knowledge on the aggregation of pathogens in the context of PJI. In addition, we believe that inclusion of in vivo-like media in antimicrobial susceptibility testing might be able to more accurately predict the in vivo susceptibility, which could ultimately result in a better clinical outcome after antimicrobial treatment.
Keywords: biofilms; prosthetic joint infection; synovial fluid.
Conflict of interest statement
The authors declare no conflict of interest.
Figures
References
MeSH terms
Substances
Grants and funding
LinkOut - more resources
Full Text Sources
Medical
Molecular Biology Databases
Miscellaneous
