. 2024 Nov 29;10(48):eadp5227.
doi: 10.1126/sciadv.adp5227. Epub 2024 Nov 29.

Impact of air pollution exposure on cytokines and histone modification profiles at single-cell levels during pregnancy

Affiliations

Impact of air pollution exposure on cytokines and histone modification profiles at single-cell levels during pregnancy

Youn Soo Jung et al. Sci Adv. .

Abstract

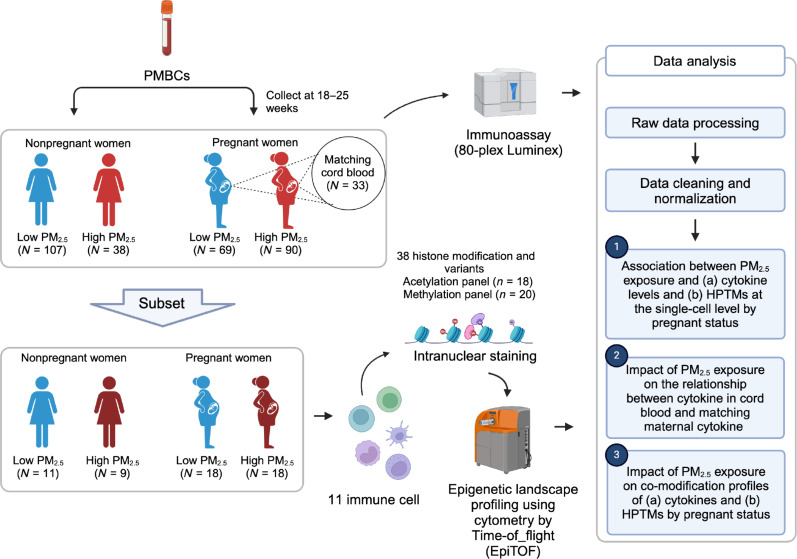
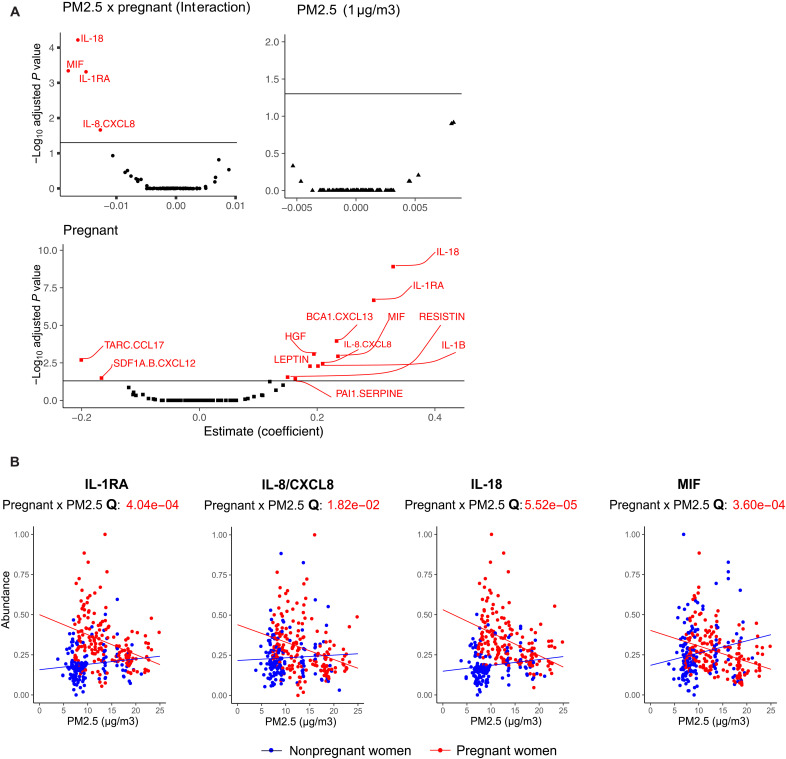
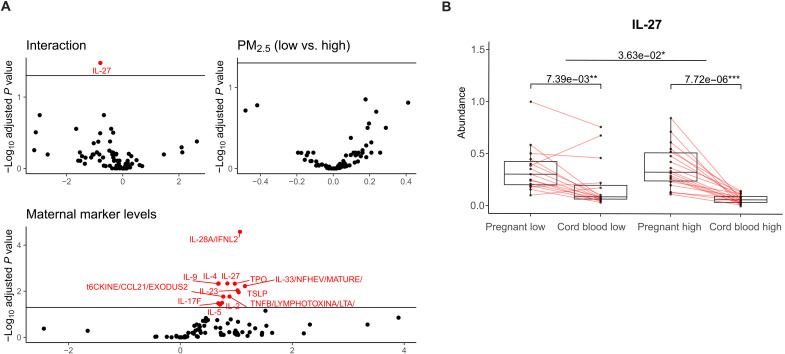
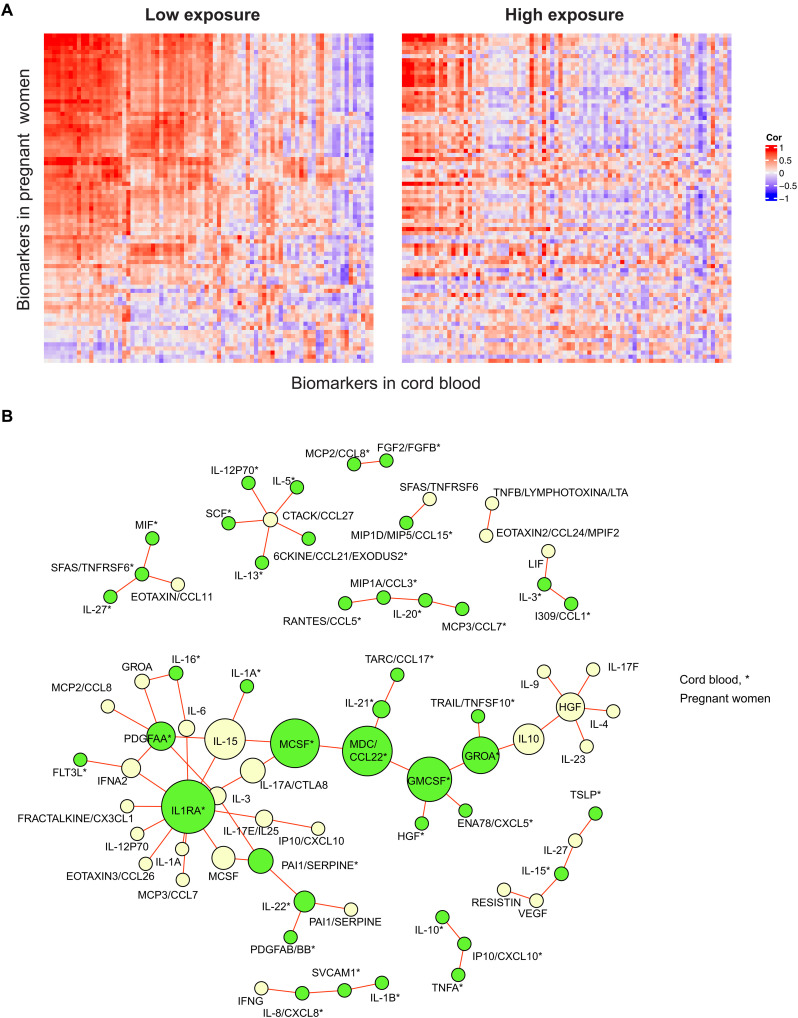
Fine particulate matter (PM2.5) exposure can induce immune system pathology via epigenetic modification, affecting pregnancy outcomes. Our study investigated the association between PM2.5 exposure and immune response, as well as epigenetic changes using high-dimensional epigenetic landscape profiling using cytometry by time-of-flight (EpiTOF) at the single cell. We found statistically significant associations between PM2.5 exposure and levels of certain cytokines [interleukin-1RA (IL-1RA), IL-8/CXCL8, IL-18, and IL-27)] and histone posttranslational modifications (HPTMs) in immune cells (HPTMs: H3K9ac, H3K23ac, H3K27ac, H2BK120ub, H4K20me1/3, and H3K9me1/2) among pregnant and nonpregnant women. The cord blood of neonates with high maternal PM2.5 exposure showed lower IL-27 than those with low exposure. Furthermore, PM2.5 exposure affects the co-modification profiles of cytokines between pregnant women and their neonates, along with HPTMs in each immune cell type between pregnant and nonpregnant women. These modifications in specific histones and cytokines could indicate the toxicological mechanism of PM2.5 exposure in inflammation, inflammasome pathway, and pregnancy complications.


Figures

Fig. 1.
Fig. 1.. Schematic overview of the workflow.
Fig. 2.
Fig. 2.. Pregnancy modifies the association between PM2.5 and four cytokines (IL-1RA, IL-8, IL-18, and MIF) and significantly affects 12 of 80 cytokines.
(A) Volcano plots summarize the beta (β) coefficients and −log transformed adjusted P values from multivariable linear regression adjusted for potential confounding such as age, ethnicity, asthma status, zip code–level SDI, and batch effect (see Materials and Methods for details). Multiple testing corrections were performed by using FDR ≥ 0.05. Significant cytokines were labeled red. A negative β coefficient of interaction between pregnant and PM2.5 status can be interpreted as the relationship between PM2,5 and cytokines getting weaker in pregnant women compared to nonpregnant women. β greater than 0 indicates a positive association. For PM2.5, it means that for every 1-unit (μg/m3) increase in PM2.5, the expression of markers will increase by the β coefficient value. For pregnant status, the expression of markers will increase by the beta coefficient value among pregnant women compared to nonpregnant women. (B) Scatter plots of PM2.5 concentration versus the levels for IL-1RA, IL-8/CXCL8, IL-18, and MIF, which had a significant interaction effect. Points and lines on the scatter plot are colored by pregnant status (pregnant women in red and nonpregnant women in blue). Lines shown are fitted within the pregnant status. FDR-adjusted P values (Q value) of the statistical interaction term between pregnant status and PM2.5 levels are noted below the cytokine name.
Fig. 3.
Fig. 3.. Impact of prenatal PM2.5 exposure during third trimester on neonatal-maternal cytokine association, especially IL-27.
(A) Volcano plots summarize the β coefficients and statistical significance for the association between maternal marker levels and CB markers (see Materials and Methods). Multiple testing corrections were performed by using FDR at 0.05. A positive β coefficient can be interpreted that 1-U increase in maternal cytokine will increase the cytokines level in CB by β estimates. A β coefficient of PM2.5 (binary indicator; low versus high) can be interpreted that cytokine levels in CB will change by β among high maternal PM2.5 exposure compared to the low exposure group. A β coefficient of interaction between maternal cytokine levels and PM2.5 status can be interpreted as the relation between maternal cytokine and corresponding cytokine in CB getting weaker in CB from high maternal PM2.5 exposure compared to those with low maternal PM2.5 exposure. (B) Box plots for levels of IL-27 in pregnant women and CB. The exposure group is defined on the basis of the mother’s exposure status during the 3 months before the blood collection, categorized as low or high. Points are samples in each group and matched pregnant women and CB are connected by a line. Q values of the differences within exposure status and between pregnant and nonpregnant women are noted with significant levels. Q values below 0.05 get one star (*); below 0.01, two stars (**); and below 0.001, three stars (***).
Fig. 4.
Fig. 4.. Different coexpression patterns in maternal-neonatal pairs between low versus high exposure.
(A) The Pearson correlation matrixes for PM2.5 exposure level (low versus high during the third trimester) show correlations between maternal and neonatal cytokines. Red and blue indicate direct and reverse correlations, respectively. (B) A coexpression differential network was created to compare cytokines that have different coexpression patterns by PM2.5 exposure levels (low versus high) during the third trimester. The edges in the network indicate that the markers are strongly coexpressed, but the direction of coexpression is opposite in low and high exposure. An asterisk (*) next to the marker name indicates that the marker is from CB. The nodes, which represent the cytokines, were colored according to sample type, with pregnant women in beige and CB in green. The size of the nodes is based on the BC, which measures the centrality based on shortest paths.
Fig. 5.
Fig. 5.. Impact of PM2.5 on immune cell type proportion depending on pregnancy status.
(A) Single-cell UMAP visualizations of histone acetylation and methylation, colored by cell type identity. (B) Frequency of immune cell subtypes in low and high PM2.5 exposure groups of pregnant and nonpregnant women. The y axis represents the frequency of cells as a percentage of a total number of 11 immune cells population, and the x axis shows the groups categorized by pregnant and PM2.5 exposure states: NPL (nonpregnant low), NPH (nonpregnant high), PL (pregnant low), and PH (pregnant high). The box plot is colored by pregnant status (red, pregnant; blue, nonpregnant). Lines present the changes in cell proportions between low and high exposures within each pregnant status. P values (P) of the interaction term between pregnant status and PM2.5 exposure are noted above graph.
Fig. 6.
Fig. 6.. An association between PM2.5 exposure and H2AK119Ub, H3K9ac, H3K23ac, H3K27ac, H4K5ac, H3K9me1/2 and H4k20me1/3 in pregnant women versus nonpregnant women across different exposure windows and cell types.
Scatter plots of (A) 3-month window PM2.5 concentration versus the levels for H2BK120ub, H3K23ac, H3K9ac, and H3K27ac in cMOs; (B) 3-month window PM2.5 concentration versus the levels for H4K20me1, H4K20me3, H3K9me1 and H3K9me2 in cMOs; and (C) 1-week window PM2.5 concentration versus the levels for H3K23ac, H3K9ac, H4K5ac, and H3K27ac in mDCs, which had a significant interaction effect. Points and lines on the scatter plot are colored by pregnant status (pregnant women in red and nonpregnant women in blue). Lines shown are fitted within the pregnant status. FDR-adjusted P values (Q value) of the statistical interaction term between pregnant status and PM2.5 levels are noted below the cytokine name. Descriptions for the abbreviations of histone modifications can be found in table S1.
Fig. 7.
Fig. 7.. PM2.5 exposure affects the similarity of immune cell type–specific HPTM interactions.
Module similarity is based on the proportion of HPTM interactions found in the row immune cells with strong evidence of preservation in the column immune cells. Heatmap (A) represents the acetylation HPTMs and (B) shows the methylation HPTMs. Note that the preservation scores should be read horizontally. Figure 7 summarizes the proportion of significant and strong (rho > 0.5) comethylation and coacetylation profiles predicted in each cell type (row) that are preserved in the other cell types (column). Preservation scores are expressed as % preserved co-modifications and are color-coded from yellow (low) to blue (high).

References

    1. Glencross D. A., Ho T.-R., Camiña N., Hawrylowicz C. M., Pfeffer P. E., Air pollution and its effects on the immune system. Free Radic. Biol. Med. 151, 56–68 (2020). - PubMed
    1. Prunicki M., Cauwenberghs N., Lee J., Zhou X., Movassagh H., Noth E., Lurmann F., Hammond S. K., Balmes J. R., Desai M., Wu J. C., Nadeau K. C., Air pollution exposure is linked with methylation of immunoregulatory genes, altered immune cell profiles, and increased blood pressure in children. Sci. Rep. 11, 4067 (2021). - PMC - PubMed
    1. Li H., Ryu M. H., Orach J., Yuen A., Lau K. S. K., Yeung C., Wen W., Carlsten C., Acute air pollution exposure increases TET enzymes in human PBMCs. J. Allergy Clin. Immunol. 150, 477–488.e9 (2022). - PubMed
    1. Thangavel P., Park D., Lee Y.-C., Recent insights into particulate matter (PM2.5)-mediated toxicity in humans: An overview. Int. J. Environ. Res. Public Health 19, 7511 (2022). - PMC - PubMed
    1. Kannan S., Misra D. P., Dvonch J. T., Krishnakumar A., Exposures to airborne particulate matter and adverse perinatal outcomes: A biologically plausible mechanistic framework for exploring potential effect modification by nutrition. Environ. Health Perspect. 114, 1636–1642 (2006). - PMC - PubMed