. 2024 Nov 29;10(48):eadr3196.
doi: 10.1126/sciadv.adr3196. Epub 2024 Nov 29.

T cell receptor-centric perspective to multimodal single-cell data analysis

Affiliations

T cell receptor-centric perspective to multimodal single-cell data analysis

Kerry A Mullan et al. Sci Adv. .

Abstract

The T cell receptor (TCR), despite its importance, is underutilized in single-cell analysis, with gene expression features solely driving current strategies. Here, we argue for a TCR-first approach, more suited toward T cell repertoires. To this end, we curated a large T cell atlas from 12 prominent human studies, containing in total 500,000 T cells spanning multiple diseases, including melanoma, head and neck cancer, blood cancer, and lung transplantation. Here, we identified severe limitations in cell-type annotation using unsupervised approaches and propose a more robust standard using a semi-supervised method or the TCR arrangement. We showcase the utility of a TCR-first approach through application of the STEGO.R tool for the identification of treatment-related dynamics and previously unknown public T cell clusters with potential antigen-specific properties. Thus, the paradigm shift to a TCR-first can highlight overlooked key T cell features that have the potential for improvements in immunotherapy and diagnostics.


Figures

Fig. 1.
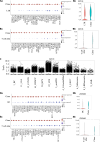
Fig. 1.. Flow chart representing the quality control process in STEGO.R.
The process proceeds from left to right, starting with (1) reading and converting the GEx and TCR-seq input files, followed by (2) additional TCR processing to add epitope annotation and clustering. The data then undergo (3) strict filtering by removing low-quality cells, integrating the data sources, and adding cellular annotation. Last, the data are ready to be analyzed in detail starting from a given TCR clonotype or annotated phenotype (4).
Fig. 2.
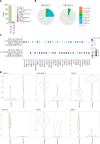
Fig. 2.. Genes enriched in the lung transplantation recipient (LTR) dataset.
(A and B) Dot plot representing the normalized average expression and the approximant number of cells being expressed comparing the clone of interest TRAV8-3.TRAJ17 CAVGASKAAGNKLTF and TRBV6-5.TRBJ1-5 CASRRTGRNQPQHF to (A) the remaining LTR data and the (B) remaining T cell atlas. (a) Dot plots of the significantly enriched genes that showcase the percentage expressed and the relative expression. (b) Violin plot of the [(A) and (B)] MT1E or [(D) and (E)] ZNF683 transcript. (C) Expression of MT1E across the 12 studies that showcase the range of expression. BC, breast cancer.
Fig. 3.
Fig. 3.. Changes in transcriptional expression during ACR and post-glucocorticoid treatment.
(A) Total clones for each of the one ACR specific clone (TRAV8-3) and after glucocorticoid treatment (TRAV8-4). (B) Expression of two or more immune checkpoints TIGIT, PD1, HAVCR2, and TIM3. (C) Differential expression plot comparing the transcriptional signature of ACR to treated. (D) Extracted the scaled expression of the transcripts EEF1G, MTRNR2L12, CR1P1, TRGV10, CD8A, and BIRC3. The two clones were from P8.
Fig. 4.
Fig. 4.. Epitope prediction of the T cell atlas using IMW DETECT.
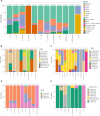
(A) Bar graph representing the ~10,000 cells colored by the different infectious species. (B to E) Individual epitopes for (B) CMV, (C) EBV, (D) FluA, and (E) SAR-CoV2. The numbers about each bar represent the total number of sequences. Flu, influenza; SARS-CoV-2, severe acute respiratory syndrome coronavirus 2; HCV, hepatitis C virus; IMW, ImmuneWatch; YFV, Yellow fever virus.
Fig. 5.
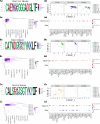
Fig. 5.. Clustering analysis of the colitis dataset highlighting disease specific clusters.
(a) Motif of the cluster, (b) cluster on the UMAP plot colored by individual and split by condition (normal controls, colitis, and no colitis), (c) heatmap of the T cell phenotype versus the individual samples, and (d) the top 30 transcripts enriched on this cluster compared to the remaining atlas (C: colitis; NC: noncolitis; CT: normal controls. (A) Cluster 6 (TRAV13-2 TRAJ45) more common in NC and TC. (B) Cluster 8 (TRGV4 TRGJ2) more common in melanoma cases. (C) Cluster 9 (TRAV29/DV5 TRAJ40) more common in colitis cases.
Fig. 6.
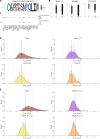
Fig. 6.. Global clustering analysis TRAV and TRBV clusters present in all 12 samples that had high generation probabilities.
The top associated α cluster had the (A to C) TRAV1-2 TRAJ33 arrangement. This cluster was present as (A) a 12-nucleotide oligomer and (B) corresponding dot plot of the average relative expression that included the expected MAIT-associated genes (C) TRAV1-2, KLRB1, and SLC4A10. In addition, we calculated the probability of generation with OLGA for (D) all TRAV probability of generation curve of the all sequences TRAV1-2 TRAJ33, TRAV8-3, and TRAV27 and for (E) TRBV probability of generation curve of all sequences and the three TRBV20-1 clusters. (D and E) Middle dashed black line represents the geometric mean of the unique sequences, and the two dotted line represents one SD from the geometric mean. n.s., nonsignificant.

References

    1. Valkiers S., de Vrij N., Gielis S., Verbandt S., Ogunjimi B., Laukens K., Meysman P., Recent advances in T-cell receptor repertoire analysis: Bridging the gap with multimodal single-cell RNA sequencing. ImmunoInformatics 5, 100009 (2022).
    1. Valkiers S., Van Houcke M., Laukens K., Meysman P., ClusTCR: A python interface for rapid clustering of large sets of CDR3 sequences with unknown antigen specificity. Bioinformatics 37, 4865–4867 (2021). - PubMed
    1. Mayer-Blackwell K., Schattgen S., Cohen-Lavi L., Crawford J. C., Souquette A., Gaevert J. A., Hertz T., Thomas P. G., Bradley P., Fiore-Gartland A., TCR meta-clonotypes for biomarker discovery with tcrdist3 enabled identification of public, HLA-restricted clusters of SARS-CoV-2 TCRs. eLife 10, e68605 (2021). - PMC - PubMed
    1. Hudson D., Lubbock A., Basham M., Koohy H., A comparison of clustering models for inference of T cell receptor antigen specificity. ImmunoInformatics 13, 100033 (2024). - PMC - PubMed
    1. Glanville J., Huang H., Nau A., Hatton O., Wagar L. E., Rubelt F., Ji X., Han A., Krams S. M., Pettus C., Haas N., Arlehamn C. S. L., Sette A., Boyd S. D., Scriba T. J., Martinez O. M., Davis M. M., Identifying specificity groups in the T cell receptor repertoire. Nature 547, 94–98 (2017). - PMC - PubMed

MeSH terms

Substances

LinkOut - more resources