. 2024 Dec:110:105461.
doi: 10.1016/j.ebiom.2024.105461. Epub 2024 Nov 28.

Bivalent Omicron BA.1 vaccine booster increases memory B cell breadth and neutralising antibodies against emerging SARS-CoV-2 variants

Collaborators, Affiliations

Bivalent Omicron BA.1 vaccine booster increases memory B cell breadth and neutralising antibodies against emerging SARS-CoV-2 variants

Lok Bahadur Shrestha et al. EBioMedicine. 2024 Dec.

Abstract

Background: Current literature informs us that bivalent vaccines will generate a broader serum neutralizing antibody response to multiple SARS-CoV-2 variants, but studies on how this breadth relates to the memory B cell (MBC) and T cell responses are sparse. This study compared breadth of neutralising antibody, and memory B and T cell responses to monovalent or a bivalent ancestral/Omicron BA.1 COVID-19 booster vaccine.

Methods: At baseline and 1-month post-booster, neutralisation activity and frequencies of receptor binding domain (RBD)-specific MBCs and Spike-specific memory T cells were measured against a panel of variants.

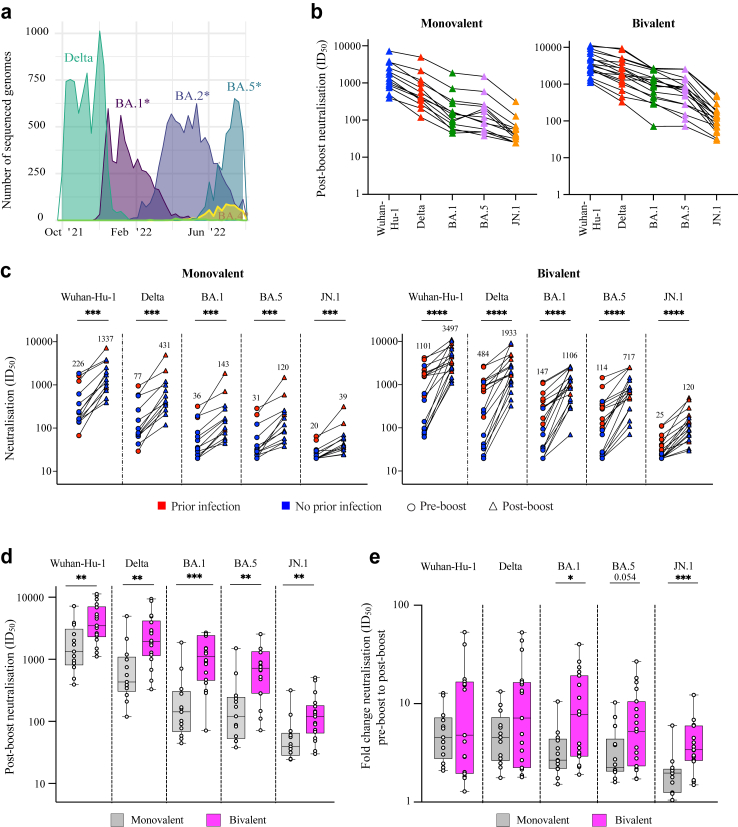
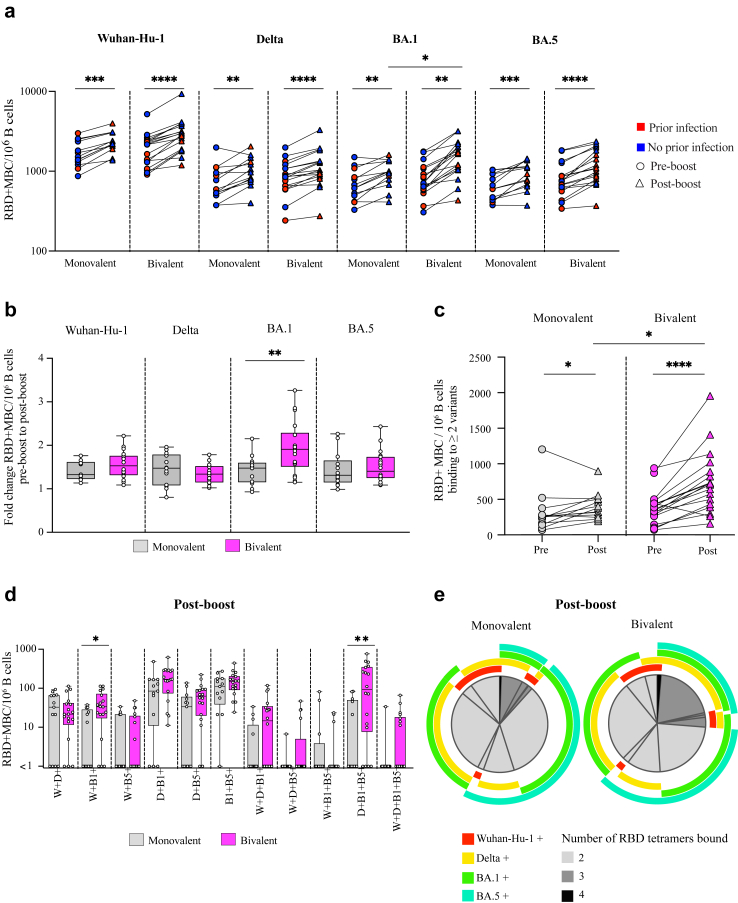
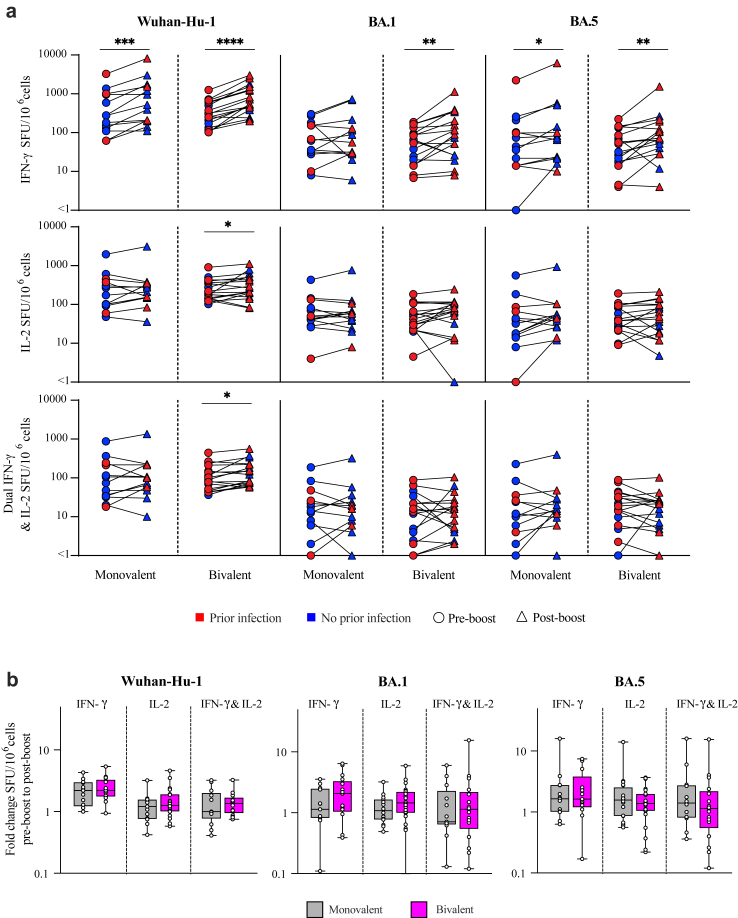
Findings: Both vaccines boosted neutralising antibodies to 5 variants - Wuhan-Hu-1, Delta, BA.1, BA.5 and JN.1, the latter of which had not yet emerged at the time of sample collection. The bivalent vaccine induced a significantly larger increase in nAb against BA.1 and JN.1. Both vaccines boosted RBD-specific MBC responses to Wuhan-Hu-1, Delta, BA.1 and BA.5 variants with a significantly greater increase for BA.1 in the bivalent group. The breadth of MBCs was significantly higher in those who received the bivalent boost and correlated with nAb breadth. Both vaccines significantly boosted Spike-specific T cell responses to the Wuhan-Hu-1 and BA.5 variants, but only the bivalent vaccine boosted BA.1 responses.

Interpretation: These results suggest that the bivalent vaccine confers an advantage against future novel variants due to increased frequency of broadly reactive RBD-specific B cells.

Funding: Work supported by NSW Health for the NSW Vaccine, Infection and Immunology Collaborative (VIIM).

Keywords: Bivalent vaccine; JN.1; Memory B cells; Omicron BA.1; Receptor binding domain.


Conflict of interest statement

Declaration of interests The VIIM Collaborative Group of NSW was funded by NSW Health. A.L.C has received NSW Health grant and performed consultancies for Moderna with honoraria directed to his institution. K.J.S. has received honoraria for talks from Moderna. A.K. has grants from NSW Health, NHMRC, MRFF, NIH, Viiv, Unitaid, DFAT, received consulting fee from Merck and Viiv, travel support from HIN STRIVE investigators meeting, performed leadership and advisory role in Board member Scientia Clinical Research Phase 1 Unit, HIV-NAT Advisory Board ASCOT Trial, Chair of DSMB Aegros Advisory Board and pending patent for siRNA for COVID-19. F.B. has received support from NHMRC, Novartis and MRFF. W.J.B. has received support from NSW Vaccine Accelerator, NHMRC, MRFF and NSW Dust Diseases board. I.D.C. has clinical trials support from Eli Lilly and Boehringer. M.W.D has grants from NHMRC and Gilead Australia, payment from Roche Diagnostics for webinar, GSK travel grant and participated as advisor in Gilead and GSK. R.A.B. and R.R. have NHMRC Investigator grants. S.G.Ta has grants from NHMRC, Job Research Foundation and Allegry and Immunology Foundation of Australasia. S.G.Tu has received grants from MRFF, and New South Wales Health COVID-19 Research Grants Round 2.

Figures

Fig. 1
Fig. 1
(A) The waves of SARS-CoV-2 variants in Australia as numbers of sequenced genomes deposited on GSAID database (https://gisaid.org/). (B) Trend in neutralisation antibody titres across different variants of SARS-CoV-2 post-boost in the monovalent and bivalent vaccine group. Lines connect data points that belong to the same individual. The limit of detection in the neutralisation assays is ID50 = 20. (C) Neutralisation antibody titres across different variants of SARS-CoV-2 in the monovalent and bivalent vaccine groups. Blue and red points represent the participants that have no or prior SARS-CoV-2 infection, respectively. The median titres are labelled. Lines connect data points that belong to the same individual. Pre- and post-boost timepoints were compared by paired Wilcoxon sign ranked test. (D) Comparison of neutralising antibody titre between monovalent and bivalent vaccine post-boost. Grey colour represents the monovalent vaccine group while magenta represents bivalent. Significance was measured using Mann–Whitney tests. (E) Fold change in neutralisation antibody titres between pre- and post-boost, across different variants of SARS-CoV-2 in the monovalent and bivalent vaccine groups. Significance was measured using Mann–Whitney tests. All box plots display the median and interquartile range, and whiskers display min to max. ∗p < 0.05, ∗∗p < 0.01, ∗∗∗p < 0.001 and ∗∗∗∗p < 0.0001.
Fig. 2
Fig. 2
(A) Comparison of RBD-specific memory B cells (MBCs; CD27+IgG+) per million B cell frequency pre- and post-boost as measured by RBD tetramer binding in flow cytometry. Blue and red points represent the participants that have no or prior SARS-CoV-2 infection while circles and triangles represent pre- and post-boost timepoints, respectively. (B) Fold change in RBD-specific MBC frequency between the pre- and post-boost for each vaccine group’s response to each variant. Grey boxes represent monovalent vaccine while magenta represent bivalent vaccine. (C) MBC binding to multiple RBDs (≥2 RBD tetramers) were compared pre- and post-boost for each vaccine group. (D) Tetramer binding combinations of cross-reactive MBCs post-boost. W; Wuhan-Hu-1. D; Delta. B1; BA.1. B5; BA.5. Grey boxes represent monovalent vaccine while magenta represent bivalent vaccine. (E) Boolean analysis of cross-binding MBC populations in monovalent and bivalent vaccine post-boost. Pie charts indicate the fraction of MBCs that bind to two, three, or four variant RBDs. Each coloured arc indicates a specific RBD variant. All box plots display the median and interquartile range, and whiskers display min to max. Statistical comparison between pre- and post-boost was done using paired Wilcoxon signed ranked test while Mann–Whitney test was employed to compare the monovalent vs bivalent vaccine. ∗p < 0.05, ∗∗p < 0.01, ∗∗∗p < 0.001 and ∗∗∗∗p < 0.0001. MBC, CD19+CD20+CD10-CD27+.
Fig. 3
Fig. 3
(A) Spike-specific T cell responses were measured by IFN-y and IL-2 FluoroSpot following stimulation with Wuhan-Hu-1, BA.1 and BA.5 variant peptide pools. Circles and triangles represent pre- and post-boost timepoints, respectively. Blue and red points represent the participants that have no or prior SARS-CoV-2 infection, respectively. Pre- and post-boost timepoints were compared by paired Wilcoxon sign ranked test. (B) Fold change in FluoroSpot cytokines between pre- and post-booster, across Wuhan-Hu-1, BA.1 and BA.5 peptide stimulation. Grey colour represents the monovalent vaccine group while magenta represents bivalent. Box plots display the median and interquartile range, and whiskers display min to max. Significance was measured using Mann–Whitney tests. ∗p < 0.05, ∗∗p < 0.01, ∗∗∗p < 0.001 and ∗∗∗∗p < 0.0001.
Fig. 4
Fig. 4
Correlation heatmap of neutralisation antibodies, RBD-specific memory-B cells, Spike-specific T cells and age for the study cohort. The colour scale represents the strength of the correlation coefficients, with blue indicating negative correlations and red indicating positive correlations. The size of the dot corresponds to the r-value; larger dots represent strong correlations while smaller dots represent weaker correlations. Only significant (p < 0.05) correlations are displayed. The black box highlights the correlation between cross-reactive MBCs and neutralising antibody titres. W; Wuhan-Hu-1. D; Delta. B1; BA.1. B5; BA.5. Dual; IFN-y/IL-2 double positive.

References

    1. Shrestha L.B., Foster C., Rawlinson W., Tedla N., Bull R.A. Evolution of the SARS-CoV-2 omicron variants BA.1 to BA.5: implications for immune escape and transmission. Rev Med Virol. 2022;32 - PMC - PubMed
    1. Yang S., Yu Y., Xu Y., et al. Fast evolution of SARS-CoV-2 BA.2·86 to JN.1 under heavy immune pressure. Lancet Infect Dis. 2023;24(2):e70–e72. - PubMed
    1. Kaku Y., Okumura K., Padilla-Blanco M., et al. Virological characteristics of the SARS-CoV-2 JN.1 variant. Lancet Infect Dis. 2024;24(2):e82. - PubMed
    1. Mak W.A., Visser W., van der Vliet M., Markus H.Y., Koeleman J.G.M., Ong D.S.Y. Ancestral SARS-CoV-2 and Omicron BA.5-specific neutralizing antibody and T-cell responses after Omicron bivalent booster vaccination in previously infected and infection-naive individuals. J Med Virol. 2023;95(8) - PubMed
    1. Lin D.-Y., Gu Y., Xu Y., et al. Association of primary and booster vaccination and prior infection with SARS-CoV-2 infection and severe COVID-19 outcomes. JAMA. 2022;328(14):1415–1426. - PMC - PubMed

Supplementary concepts