. 2024 Nov 29;15(1):10402.
doi: 10.1038/s41467-024-54621-3.

Identification of HER2-positive breast cancer molecular subtypes with potential clinical implications in the ALTTO clinical trial

Affiliations

Identification of HER2-positive breast cancer molecular subtypes with potential clinical implications in the ALTTO clinical trial

Mattia Rediti et al. Nat Commun. .

Abstract

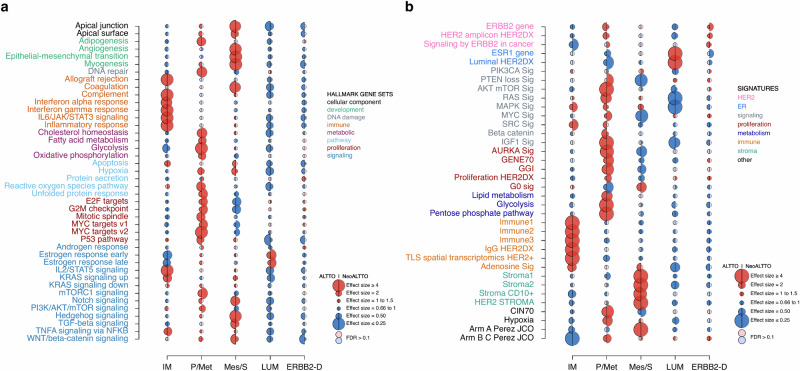
In HER2-positive breast cancer, clinical outcome and sensitivity to HER2-targeted therapies are influenced by both tumor and microenvironment features. However, we are currently unable to depict the molecular heterogeneity of this disease with sufficient granularity. Here, by performing gene expression profiling in HER2-positive breast cancers from patients receiving adjuvant trastuzumab in the ALTTO clinical trial (NCT00490139), we identify and characterize five molecular subtypes associated with the risk of distant recurrence: immune-enriched, proliferative/metabolic-enriched, mesenchymal/stroma-enriched, luminal, and ERBB2-dependent. Additionally, we validate the biological profiles of the subtypes and explore their prognostic/predictive value in external cohorts, namely the NeoALTTO trial (NCT00553358), SCAN-B (NCT02306096), I-SPY2 (NCT01042379), METABRIC and TCGA. Immune-enriched tumors present better survival outcomes, in contrast to mesenchymal/stroma-enriched and proliferative/metabolic-enriched tumors, while luminal and ERBB2-dependent tumors are characterized by low and high rates of pathological complete response, respectively. Of note, these molecular subtypes provide the rationale for treatment approaches leveraging the heterogeneous biology of HER2-positive breast cancer.


Conflict of interest statement

Competing interests: The authors declare the following competing interests. S.EA.: grants via the affiliation from Novartis for the submitted work and from Roche/Genentech, Astra Zeneca, Pfizer, and BCRF outside the submitted work. S.DC.: consultation fees from Pierre-Fabre, IQVIA, and Medica Scientia Innovation Research (MEDSIR); institutional grant from Fondazione Associazione Italiana Ricerca contro il Cancro (AIRC); and Cancer Can.Heal European EU4 Health Programme 101080009-European Commission. T.U.: honoraria from Astra Zeneca, Novartis Pharma K.K., Eisai Co., Ltd., Chugai Pharmaceutical Co. Ltd; research grant from Eli Lilly Japan K.K. M.I.: employee of Novartis, owner of Novartis shares. M.P.: invited speaker for AstraZeneca, Lilly, MSD, Novartis, Pfizer, Roche-Genentech; consultant for Roche-Genentech; advisory board for Frame Therapeutics, Gilead, Menarini, NBE Therapeutics, Odonate, Roche-Genentech, SeaGen, Seattle Genetics; member of boards of directors, scientific board for Oncolytics; research grants to her Institution from AstraZeneca, Lilly, Gilead; funding to her Institution from Menarini, MSD, Novartis, Pfizer, Radius, Roche-Genentech, Servier, Synthon. L.P.: consulting fees and honoraria for advisory board participation from Pfizer, Astra Zeneca, Merck, Novartis, Bristol-Myers Squibb, Stemline-Menarini, GlaxoSmithKline, Genentech/Roche, Personalis, Daiichi, Natera, Exact Sciences and institutional research funding from Seagen, GlaxoSmithKline, AstraZeneca, Merck, Pfizer and Bristol Myers Squibb. S.L.: research funding to institution from Novartis, Bristol Myers Squibb, MSD, Puma Biotechnology, Eli Lilly, Nektar Therapeutics, Astra Zeneca/Daiichi Sankyo and Seattle Genetics; consultant (not compensated) to Seattle Genetics, Novartis, Bristol Myers Squibb, MSD, AstraZeneca/Daiichi Sankyo, Eli Lilly, Pfizer, Gilead Therapeutics, Nektar Therapeutics, PUMA Biotechnologies, and Roche-Genentech; consultant (paid to institution) to Novartis, GlaxoSmithKline, Roche-Genentech, Astra Zeneca/Daiichi Sankyo, Pfizer, Gilead Therapeutics, Seattle Genetics, MSD, Tallac Therapeutics, Eli Lilly and Bristol Myers Squibb. R.S.: non-financial support from Merck, Case 45, and Bristol Myers Squibb (BMS); research support from Merck, Puma Biotechnology, and Roche; personal fees from Roche, BMS, Astra Zeneca, Daiichi Sankyo and Exact Sciences for advisory boards. G.V.: grants/research supports from Roche/Genentech, Ventana Medical Systems, Dako/Agilent Technologies; honoraria or consultation fees from Ventana, Dako/Agilent, Roche, MSD Oncology, AstraZeneca, Daiichi Sankyo, Pfizer, Gilead. C.S.: advisory board (receipt of honoraria or consultations fees) for Astellas, Cepheid, Vertex, Seattle genetics, Puma, Amgen, Exact Sciences, INC, Merck & Co; invited speaker for Eisai, Prime Oncology, Teva, Foundation Medicine, Exact Sciences; advisory equity from Signatur Biosciences; other support (travel, accommodation expenses) from Roche, Genentech, Pfizer. The remaining authors declare no non-financial or financial competing interests.

Figures

Fig. 1
Fig. 1. Characteristics of the HER2-positive breast cancer subtypes identified in ALTTO.
a Characterization of the 5 HER2-positive breast cancer subtypes using hallmark gene sets computed performing gene set variation analysis. b Comparisons across HER2-positive breast cancer subtypes using single genes (ERBB2, ESR1) and gene expression signatures. For (a) and (b), Wilcoxon rank sum test was used to compare each subtype against the others (i.e., one vs. rest). The effect size represents the direction of the association (red, positive if >1, blue, negative if <1), and was calculated by applying a linear regression model. FDRs were obtained by adjusting P values with Benjamini & Hochberg method. The dimension of the circle varies proportionally to the effect size (see figure legend). For visualization, effect sizes ≤0.25, ≥0.66 and ≤1, >1 and ≤1.5, and ≥4 have fixed size; FDRs >0.1 are shown with lighter colors. c Radar plots showing the main features of the subtypes, using a selected set of signatures and single genes (ERBB2, ESR1). Median levels of the signature/gene levels for each subtype were min/max rescaled between 0 and 1 for visualization purposes. The score for H. angiogenesis was derived from GSVA, while the other signatures were computed as weighted mean as described in the methods. d Alluvial plot showing the distribution of AIMS intrinsic subtypes across HER2-positive breast cancer subtypes, and vice versa. The proportions of hormone receptor-positive and negative tumors in each HER2-positive breast cancer subtype are also shown. The LUM and ERBB2-D subtypes were derived from NMF and k-means-based clustering (cluster 4) after evaluating differences in survival according to AIMS subtypes (HER2-enriched vs. rest). All P values are two-sided. All analyses are on N = 386 ALTTO samples (IM, N = 69; P/Met, N = 87; Mes/S, N = 76; LUM, N = 63; ERBB2-D, N = 91). Source data are provided as a Source Data file. BC breast cancer, ER estrogen receptor, ERBB2-D ERBB2-dependent, FDR false discovery rate, H. Hallmark, HR hormone receptor, IM immune-enriched, LUM luminal, Mes/S mesenchymal/stroma-enriched, NMF non-negative matrix factorization, P/Met proliferative/metabolic-enriched, R. Reactome.
Fig. 2
Fig. 2. Survival analysis according to HER2-positive breast cancer subtypes identified in ALTTO.
a Kaplan–Meier plot showing DRFI in ALTTO according to the 5 HER2-positive subtypes identified from the integration of NMF, k-means clustering and AIMS intrinsic subtypes. b Kaplan–Meier plot showing OS according to the 5 HER2-positive subtypes. P values (two-sided) are from log-rank test. All analyses are on N = 386 ALTTO samples (IM, N = 69; P/Met, N = 87; Mes/S, N = 76; LUM, N = 63; ERBB2-D, N = 91). CI confidence interval, DRFI distant relapse-free interval, ERBB2-D ERBB2-dependent, IM immune-enriched, LUM luminal, Mes/S mesenchymal/stroma-enriched, NMF non-negative matrix factorization, OS overall survival, P/Met proliferative/metabolic-enriched.
Fig. 3
Fig. 3. Validation of the biological characteristics of the 5 HER2-positive breast cancer subtypes using hallmark gene sets and single genes/gene signatures in NeoALTTO, and comparison with ALTTO original subtypes.
a Comparisons across HER2-positive breast cancer subtypes using hallmark gene sets computed performing gene set variation analysis in ALTTO (left half of the circles) and NeoALTTO (right half of the circles). b Comparisons across HER2-positive breast cancer subtypes using single genes (ERBB2, ESR1) and gene expression signatures in ALTTO (left half of the circles) and NeoALTTO (right half of the circles). Wilcoxon rank-sum test was used to compare each subtype against the others (i.e., one vs. rest). The effect size represents the direction of the association (red, positive if >1, blue, negative if <1), and was calculated by applying a linear regression model. FDRs were obtained by adjusting P values with Benjamini & Hochberg method. The dimension of the circle varies proportionally to the effect size (see figure legend). For visualization, effect sizes ≤0.25, ≥0.66 and ≤1, >1 and ≤1.5, and ≥4 have fixed size; FDRs >0.1 are shown with lighter colors. The left halves of the circle represent the effect size for the original subtypes derived from the integration of NMF, k-means clustering and AIMS intrinsic subtypes in ALTTO, while the right halves represent results for NeoALTTO. All P values are two-sided. All analyses are on N = 386 ALTTO samples and N = 254 NeoALTTO samples (IM, N = 42; P/Met, N = 41; Mes/S, N = 59; LUM, N = 52; ERBB2-D, N = 60). Source data are provided as a Source Data file. ER estrogen receptor, ERBB2-D ERBB2-dependent, FDR false discovery rate, IM immune-enriched, LUM luminal, Mes/S mesenchymal/stroma-enriched, NMF non-negative matrix factorization, P/Met proliferative/metabolic-enriched.
Fig. 4
Fig. 4. Event-free survival, pathological complete response rates, and TIL levels according to HER2-positive breast cancer subtypes in NeoALTTO.
a Kaplan–Meier plot showing EFS in NeoALTTO according to the 5 HER2-positive subtypes identified with the gene expression-based classifier. b Kaplan–Meier plot showing EFS according to the 5 HER2-positive subtypes in the subset with no pCR (ypT0/is) at surgery. c Rates (%) of pCR (ypT0/is) according to the 5 HER2-positive subtypes in the NeoALTTO trial. d TIL levels according to the 5 HER2-positive subtypes in the NeoALTTO trial. For EFS, P values are from log-rank test. For the comparisons of TIL levels across the subtypes (i.e., one vs. the rest), P values are derived from Wilcoxon rank sum tests. All P values are two-sided. In the bar plots, the whiskers indicate the 95% confidence interval. In box plots, the boxes are defined by the upper and lower quartile; the median is shown as a bold-colored horizontal line; whiskers extend to the most extreme data point which is no more than 1.5 times the interquartile range from the box. Analyses in (a) and (c) are on N = 254 NeoALTTO samples (IM, N = 42; P/Met, N = 41; Mes/S, N = 59; LUM, N = 52; ERBB2-D, N = 60); analyses in (b) are on N = 166/254 NeoALTTO samples with no pCR (IM, N = 24; P/Met, N = 28; Mes/S, N = 38; LUM, N = 47; ERBB2-D, N = 29); analyses in (d) are on N = 233/254 NeoALTTO samples with TILs available (IM, N = 40; P/Met, N = 36; Mes/S, N = 53; LUM, N = 50; ERBB2-D, N = 54). BC breast cancer, EFS event-free survival, ERBB2-D ERBB2-dependent, IM immune-enriched, LUM luminal, Mes/S mesenchymal/stroma-enriched, pCR pathological complete response, P/Met proliferative/metabolic-enriched, RNAseq RNA sequencing, TIL tumor-infiltrating lymphocyte.
Fig. 5
Fig. 5. Main characteristics of the 5 HER2-positive breast cancer subtypes.
Circular bar plot showing the main gene expression-related features of the HER2-positive subtypes. Scores for gene signatures, expression levels of single genes (ERBB2 and ESR1), and gene set variation (angiogenesis) scores (total of 13 scores) were min/max rescaled in each dataset (ALTTO N = 386, NeoALTTO N = 254, I-SPY2 N = 245, TCGA N = 131, METABRIC N = 236, SCAN-B N = 819), and median levels computed for each subtype in a merged dataset (N = 2071). For visualization purposes, values were again min/max rescaled between 0 and 1, and top 5 scores in each subtype are shown. Colored panels for each subtype summarize the main clinical characteristics in terms of prognosis and response to neoadjuvant therapy. Source data are provided as a Source Data file. ERBB2-D ERBB2-dependent, IM immune-enriched, LUM luminal, Mes/S mesenchymal/stroma-enriched, P/Met proliferative/metabolic-enriched.

References

    1. Slamon, D. J. et al. Human breast cancer: correlation of relapse and survival with amplification of the HER-2/neu oncogene. Science235, 177–182 (1987). - PubMed
    1. Cossetti, R. J. D., Tyldesley, S. K., Speers, C. H., Zheng, Y. & Gelmon, K. A. Comparison of breast cancer recurrence and outcome patterns between patients treated from 1986 to 1992 and from 2004 to 2008. J. Clin. Oncol.33, 65–73 (2015). - PubMed
    1. Martin, M. et al. Neratinib after trastuzumab-based adjuvant therapy in HER2-positive breast cancer (ExteNET): 5-year analysis of a randomised, double-blind, placebo-controlled, phase 3 trial. Lancet Oncol.18, 1688–1700 (2017). - PubMed
    1. von Minckwitz, G. et al. Adjuvant pertuzumab and trastuzumab in early HER2-positive breast cancer. N. Engl. J. Med.377, 122–131 (2017). - PMC - PubMed
    1. Tolaney, S. M. et al. Seven-year follow-up analysis of adjuvant paclitaxel and trastuzumab trial for node-negative, human epidermal growth factor receptor 2-positive breast cancer. J. Clin. Oncol.37, 1868–1875 (2019). - PMC - PubMed

Publication types

MeSH terms

Associated data