. 2024 Nov 29;15(1):10396.
doi: 10.1038/s41467-024-54543-0.

Multiple myeloma long-term survivors exhibit sustained immune alterations decades after first-line therapy

Affiliations

Multiple myeloma long-term survivors exhibit sustained immune alterations decades after first-line therapy

Raphael Lutz et al. Nat Commun. .

Abstract

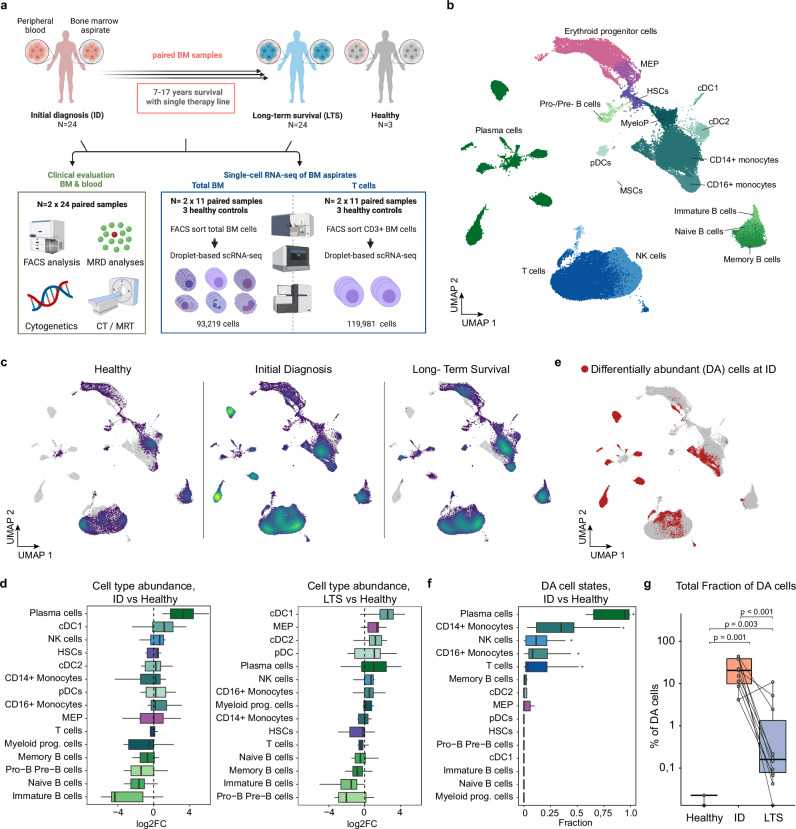
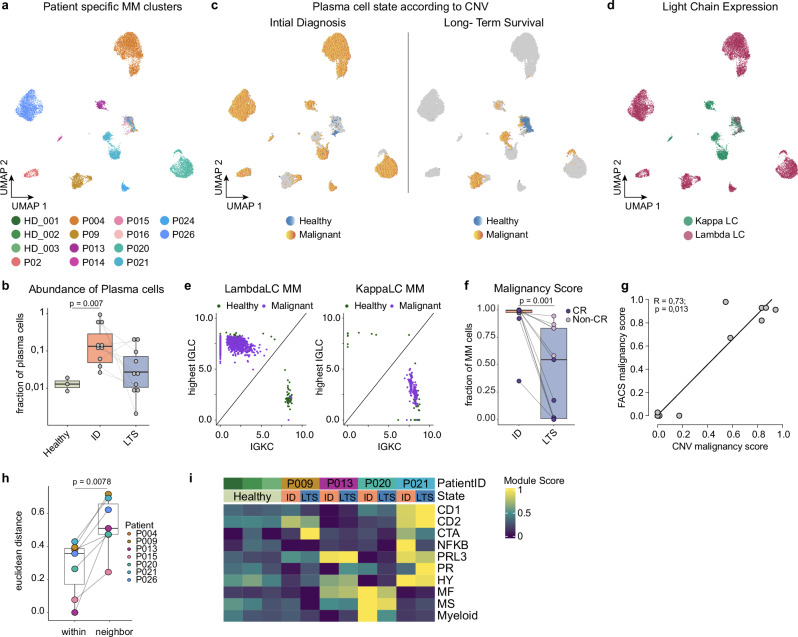
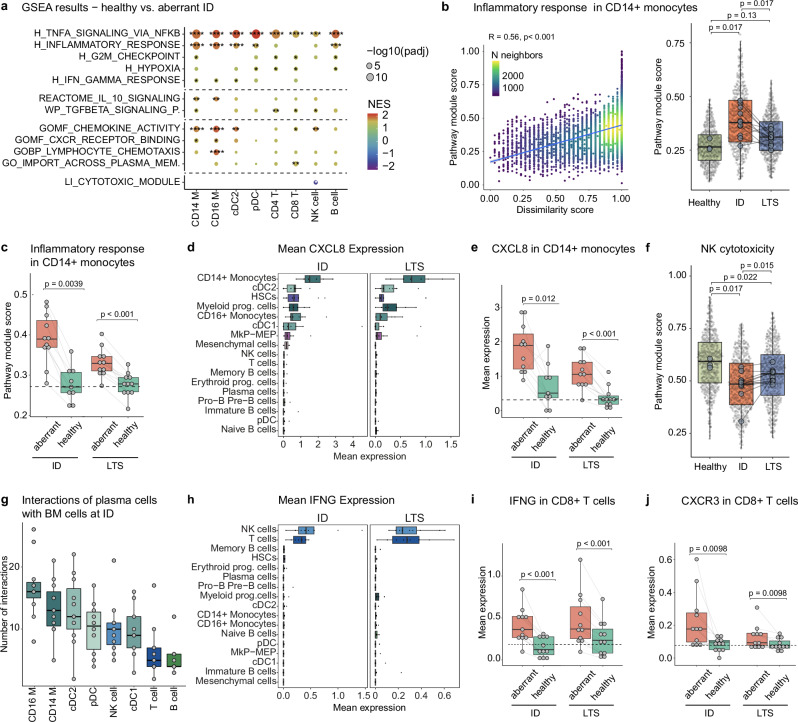
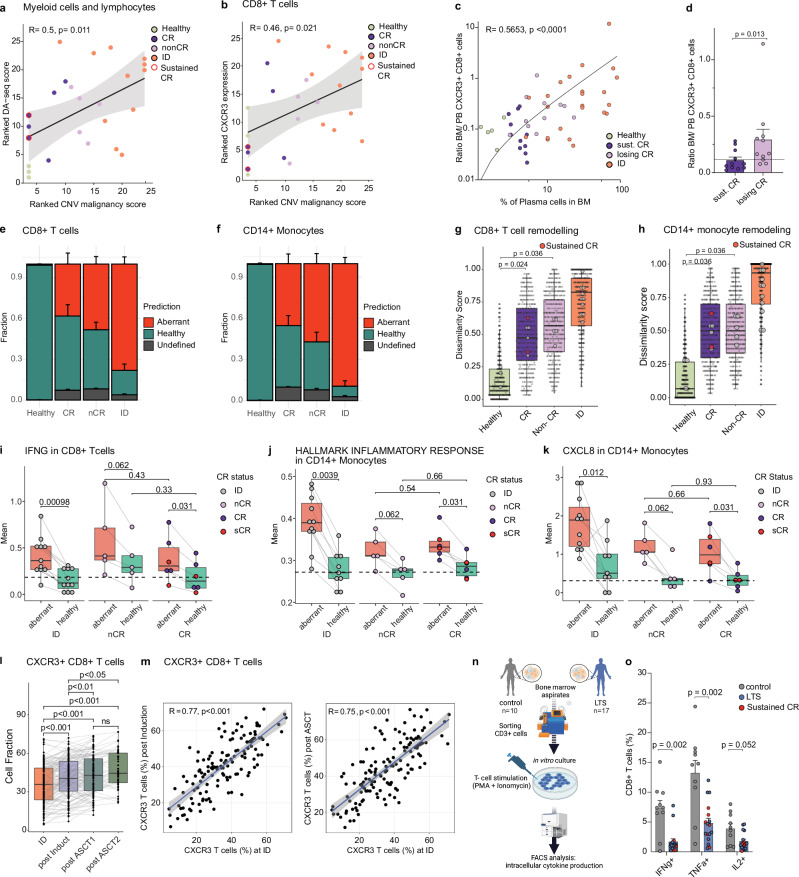
The long-term consequences of cancer and its therapy on the patients' immune system years after cancer-free survival remain poorly understood. Here, we present an in-depth characterization of the bone marrow immune ecosystem of multiple myeloma long-term survivors, from initial diagnosis up to 17 years following a single therapy line and cancer-free survival. Using comparative single-cell analyses combined with molecular, genomic, and functional approaches, we demonstrate that multiple myeloma long-term survivors exhibit pronounced alterations in their bone marrow microenvironment associated with impaired immunity. These immunological alterations were frequently linked to an inflammatory immune circuit fueled by the long-term persistence or resurgence of residual myeloma cells. Notably, even in the complete absence of any detectable residual disease for decades, sustained changes in the immune system were observed, suggesting an irreversible 'immunological scarring' caused by the initial exposure to the cancer and therapy. Collectively, our study provides key insights into the molecular and cellular bone marrow ecosystem of long-term survivors of multiple myeloma, revealing both reversible and irreversible alterations in the immune compartment.


Conflict of interest statement

Competing interests: C.M.-T. received research funding from Bioline RX and Pfizer. M.B. has served as a consultant for Takeda and Novartis; received research funding from Novartis and travel support from Celgene, Amgen, and Janssen. H.G. received funding from the International Myeloma Foundation – Black Swan and the Dietmar-Hopp-Foundation. The other authors declare no competing interests related to this study.

Figures

Fig. 1
Fig. 1. The bone marrow immune ecosystem of multiple myeloma long-term survivor patients.
a Overview of the study design and experimental layout; created with BioRender.com. b Global UMAP representation of scRNAseq data of paired human BM samples from 11 MM long-term survivor patients at initial diagnosis (ID) and long-term survival (LTS), as well as 3 healthy, age-matched controls. c Global UMAP split by clinical groups. The density and distribution of cells are color-coded. Gray represents all remaining cells. d Changes in cell type abundancies between ID (n = 11) or LTS (n = 11) in comparison to healthy donors (n = 3). e Global UMAP highlighting differentially abundant cells (red) determined by DA-Seq at initial diagnosis as compared to cells from healthy controls. f Fractions of differentially abundant (DA) cells compared to all cells per cell type and patient at initial diagnosis (n = 11). Benjamini-Hochberg (BH) adjusted significant differences (p < 0.05) evaluated by unpaired two-sided Wilcoxon rank sum test are highlighted. g Fractions of DA cells compared to all cells per patient within ID, LTS or healthy controls (Healthy). Dots represent sample means. BH corrected p-values from unpaired (Healthy/ID, Healthy/LTS) and paired (ID/LTS) two-sided Wilcoxon rank-sum tests are shown. If not stated otherwise, paired human BM samples from 11 MM patients at ID and LTS, as well as 3 healthy, age-matched controls, were used for comparison. Abbreviations: HSCs: hematopoietic stem cells, MEP: megakaryocyte-erythrocyte progenitors, MyeloP: myeloid progenitors, cDC1/2: conventional dendritic cells 1/2, pDCs: plasmacytoid dendritic cells, NK: natural killer cells, MSCs: mesenchymal stromal cells; ID: initial diagnosis, LTS: long-term survival. Box plots: center line, median; box limits, first and third quartile; whiskers, smallest/largest value no further than 1.5*IQR from the corresponding hinge.
Fig. 2
Fig. 2. Malignant plasma cells frequently persist during long-term survival and display a stable transcriptional phenotype.
a UMAP embedding of the BM plasma cell (PC) compartment colored by the patient. b PC fraction of total BM cells summarized by the patient and compared between clinical groups (Healthy (n = 3), ID (n = 10), LTS (n = 10)). Dots indicate the PC fraction of total BM cells for each sample. Significance was tested by a two-sided unpaired Wilcoxon rank sum test. c Split UMAP of PCs by clinical groups (ID, LTS) highlighting their malignancy annotation (healthy, malignant) derived from inferCNV. The remaining cells are grayed out. d PC UMAP highlighting the dominant immunoglobulin light chain expression. e Representative scatter plots of immunoglobulin expression (highest lambda chain (IGLC) and kappa chain (IGKC)) of healthy (green) and malignant (violet) PCs. f Malignancy score (malignant PC fraction of total PCs) per patient at ID and LTS (n = 9). Large dots indicate the malignant PC fraction of total BM cells for each sample. Significance was tested by a two-sided paired Wilcoxon signed rank test. g Correlation of malignancy score from flow cytometry MRD (number of Light Chain restricted plasma cells/all plasma cells) with malignancy score from inferCNV analysis (number of malignant cells/all plasma cells). Spearman’s Rho and the significance level of correlation are indicated using a two-sided test based on the t distribution. h Euclidean distance of malignant plasma cells between ID and LTS within patients (n = 7) compared to the Euclidean distance of malignant plasma cells at ID and respective nearest neighbor. Patients with less than 2 cells per clinical state were excluded. Significance was tested by a one-sided paired Wilcoxon signed rank test. i Heatmap showing average expression patterns (module scores; scaled by row) of known bulk RNA signatures (Broyl et al. 2010) per patient and clinical state. If not stated otherwise, paired human BM samples from 11 MM patients at ID and LTS, as well as 3 healthy, age-matched controls, were used for comparison. Abbreviations: PC: plasma cells; ID: initial diagnosis; LTS: long-term survival; IGLC: immunoglobulin light chain; LC: lambda chain; KC: kappa chain. Box plots: center line, median; box limits, first and third quartile; whiskers, smallest/largest value no further than 1.5*IQR from the corresponding hinge.
Fig. 3
Fig. 3. Multiple myeloma long-term survivor patients display sustained signs of immune remodeling decades after a single therapy line.
a UMAP of CD14 + monocytes from the BM dataset split by clinical groups. Cells are colored by the density (top row), dissimilarity score (middle row), and dissimilarity-based classification into aberrant-like, healthy-like, and undefined cell states (bottom row). Cells from the respective other clinical states are depicted in gray. b Distribution of the dissimilarity score by clinical group summarizing the remodeling of CD14 + monocytes. Large dots indicate sample means. Benjamini-Hochberg adjusted p-values from unpaired (Healthy(n = 3)/ID(n = 11), Healthy (n = 3)/LTS(n = 11)) and paired (ID(n = 11)/LTS(n = 11)) two-sided Wilcoxon rank-sum tests are shown. c Bar plot summarizing fractions of predicted cell states by the clinical group from (a). d UMAP of CD8 + T cells split by clinical groups. Cells are colored by the density (top row), dissimilarity score (middle row), and dissimilarity-based classification into aberrant-like, healthy-like, and undefined cell states (bottom row). Cells from the corresponding other clinical states are shown in a grayscale. e Distribution of the dissimilarity score by clinical group summarizing the remodeling of CD8 + T cells. Large dots indicate sample means. Benjamini-Hochberg adjusted p-values from unpaired (Healthy(n = 3)/ID(n = 11), Healthy(n = 3)/LTS(n = 11)) and paired (ID(n = 11)/LTS(n = 11)) two-sided Wilcoxon rank-sum tests are shown. f Bar plot summarizing fractions of predicted cell states by the clinical group from (d). g UMAP of CD8 + T cells, classified into naïve, memory, cytotoxic, and KLRB1 + subsets. h Bar plot summarizing fractions of cell subsets by the clinical group from (g). If not stated otherwise, paired human BM samples from 11 MM patients at ID and LTS, as well as 3 healthy, age-matched controls, were used for comparison. Abbreviations: BM: bone marrow; ID: initial diagnosis; LTS: long-term survival. Bar plots: Error bars indicate the standard error of the mean (SEM); Box plots: center line, median; box limits, first and third quartile; whiskers, smallest/largest value no further than 1.5*IQR from the corresponding hinge.
Fig. 4
Fig. 4. An inflammatory circuit underlies immune remodeling during active disease and long-term survival.
a Significantly enriched gene sets in aberrant cell types at ID versus healthy controls. Selected gene sets are shown. Benjamini-Hochberg adjusted p-values are encoded by dot size, colors represent normalized enrichment scores (NES). Stars mark significant enrichment of the selected gene sets. b Left, correlation between indicated module score and dissimilarity score in CD14 + monocytes. Cell density is color-coded. Spearman’s Rho and the significance level of correlation are indicated. Right, distribution of indicated module score by clinical group. Benjamini-Hochberg adjusted p-values from unpaired (Healthy/ID, Healthy/LTS) and paired (ID/LTS) two-sided Wilcoxon rank-sum tests are shown. c Boxplots of indicated module score (see b) in CD14 + monocytes split by clinical group and cell state prediction (n(ID/healthy) = 9, all other n = 11). The dashed line represents the mean expression of healthy controls. Significance was tested by paired two-sided Wilcoxon rank-sum tests. d Mean CXCL8 expression at ID and LTS per patient. e Boxplots of mean CXCL8 expression in CD14 + monocytes split by clinical group and cell state prediction. The dashed line represents the mean expression of healthy controls. Significance was tested by paired two-sided Wilcoxon rank-sum tests. f NK cytotoxicity module score in NK cell subsets. Benjamini-Hochberg adjusted p-values from unpaired (Healthy/ID, Healthy/LTS) and paired (ID/LTS) two-sided Wilcoxon rank-sum tests are shown. g Predicted the number of interactions between plasma cells and immune cells at ID using CellPhoneDB. h Mean interferon-gamma (IFNG) expression at ID and LTS per patient. i, j Boxplots of IFNG (i) and CXCR3 (j) expression in CD8 + T cells split by clinical group and cell state prediction (n per group/condition = 11). The dashed line represents the mean expression of healthy controls. Significance was tested by paired two-sided Wilcoxon rank-sum tests. If not stated otherwise, paired human BM samples from 11 MM patients at ID, LTS, and 3 healthy controls were used for comparison. Abbreviations: CD14/CD16_M: CD14 + /CD16 + monocytes; cDC: conventional dendritic cells; pDC: plasmacytoid dendritic cells; CD4/CD8_T: CD4 + /CD8 + T cells; NK: natural killer cells. Box plots: center line, median; box limits, first and third quartile; whiskers, smallest/largest value no further than 1.5*IQR from the corresponding hinge.
Fig. 5
Fig. 5. Bone marrow infiltration of inflammatory T cells is associated with myeloma burden and serves as an accessible biomarker for disease activity.
ad UMAP of CD8 + T cells with CXCR3 (a) and LAT1 (b) expression highlighted, split between healthy donors and ID patients; and highlighted ‘scRNA Remodeling Score’ (derived from scRNAseq data: healthy versus aberrant CD8 + T cells) (c) and ‘bulkRNA Remodeling Score’ (derived from RNAseq analysis of CXCR3 + versus CXCR3- CD8 + T cells) (d). e Multiplex immunofluorescence of MUM1 (plasma cells), CXCR3, and LAT1 in representative BM area of an MM patient (arrows indicated examples of LAT1 and CXCR3 co-expression on T cells). f Left, CXCR3 mean expression intensity (MEI) on BM CD8 T cells of 33 MM, 12 B Non-Hodgkin lymphoma, and 11 MDS patients. Benjamini-Hochberg adjusted p-values from unpaired two-sided Wilcoxon rank-sum tests are shown; Right, Spearman correlation of fraction of CXCR3 + T cells (threshold: > 10 T cells) with tumor burden (MUM1 + plasma cells in the BM) (n = 40). g UMAP of CD8 + T cells with highlighted velocities (arrows), dissimilarity score (yellow), and imputed CXCR3 and LAT1 expression. h Fraction of CXCR3 + CD8 + T cells in PB (n = 50) and BM (n = 50) in patients with low/intermediate (< 50% plasma cells, blue) or high tumor burden (> 50% plasma cells, green). Significance was tested by a two-sided unpaired Wilcoxon rank sum test. i Hierarchical clustering CD8 + T cells (+/− CXCR3) from BM and PB (n = 3) by clonotypes of T cell receptor (TCR) repertoire using the Jaccard index of repertoire similarity. j Clonotype tracking by representative CDR3 amino acid sequence of shared clonotypes between the top 10 most abundant TCR clonotypes from CXCR3 + (top row) and CXCR3- (bottom row) PB CD8 + T cells across T cell subsets in PB and BM. Two representative patients are shown (see also Supplementary Fig. 6). Amino acid clonotype sequences are indicated. Bar plots: Error bars indicate the standard error of the mean (SEM). Abbreviations: FACS: fluorescence-activated cell sorting; BM: bone marrow; PB: peripheral blood; IF: immunofluorescence; MEI: mean expression intensity; MDS: myelodysplastic syndrome; ASCT: autologous stem cell transplantation; MFI: mean fluorescence intensity; TCR: T cell receptor.
Fig. 6
Fig. 6. Immune remodeling in LTS patients is associated with future disease resurgence and defective immune function even in the absence of measurable disease.
a Correlation of malignant plasma cell fraction (CNV-based malignancy score) and degree of remodeling (mean DA-seq score). Spearman’s Rho is indicated. b Correlation between mean CXCR3 expression in CD8 + T cells and CNV-based malignancy score; Spearman’s Rho is indicated. c Correlation between the ratio of BM to PB CXCR3 + CD8 + T cells and BM cytological PC count. n(healthy) = 5, n(sust.CR) = 11, n(losingCR) = 11, n(ID) = 23. Spearman’s Rho is indicated. d Comparison of BM to PB ratio of CXCR3 + CD8 + T cells between sust.CR patients (n = 11) and patients losing CR (n = 11). The dashed line indicates the mean ratio of healthy controls. Significance was tested by unpaired Wilcoxon rank sum test. e Bar plot summarizing fractions of dissimilarity-based classification by the clinical group for CD8 + T cells (healthy n = 3; complete remission (CR) n = 6; non-CR n = 5). f Similar to (e) but for classical monocytes. g Distribution of the dissimilarity score by clinical group within CD8 + T compartment. Large dots indicate sample means. h Similar to (g) but for classical monocytes. (ik) Boxplots of indicated gene/genesets. The dashed line indicates the mean module score of healthy control. Significance was tested by paired Wilcoxon rank-sum tests. l Fraction of CXCR3 + CD8 + T cells at ID, after induction, and high-dose melphalan and autologous stem cell transplantation (ASCT), n = 136 patients, significance determined by Wilcoxon signed-rank tests. Benjamini-Hochberg adjusted p-values are shown. m Correlation of CXCR3-positive T cells among paired samples from distinct therapy phases. Spearman’s Rho is indicated. n Study design scheme; created with BioRender.com. o Intracellular cytokines in T cells of LTS patients (n = 17) and controls (n = 10). Significance was tested by unpaired Wilcoxon rank sum test. If not stated otherwise, paired BM samples from 11 MM patients at ID and LTS, and 3 healthy controls were used. Box plots: center line, median; box limits, first and third quartile; whiskers, smallest/largest value no further than 1.5*IQR from the corresponding hinge. Bar plots: Error bars indicate the standard error of the mean (SEM). Error bands in correlation graphs indicate a 95% confidence interval of best linear fit. All statistical tests were performed using a two-sided approach. Abbreviations: ID: initial diagnosis; LTS: long-term survival; CR: complete remission; BM: bone marrow; PB: peripheral blood.

References

    1. Noy, R. & Pollard, J. W. Tumor-associated macrophages: from mechanisms to therapy. Immunity41, 49–61 (2014). - PMC - PubMed
    1. Thommen, D. S. & Schumacher, T. N. T Cell Dysfunction in Cancer. Cancer Cell33, 547–562 (2018). - PMC - PubMed
    1. van der Leun, A. M., Thommen, D. S. & Schumacher, T. N. CD8(+) T cell states in human cancer: insights from single-cell analysis. Nat. Rev. Cancer20, 218–232 (2020). - PMC - PubMed
    1. Veglia, F., Perego, M. & Gabrilovich, D. Myeloid-derived suppressor cells coming of age. Nat. Immunol.19, 108–119 (2018). - PMC - PubMed
    1. Veglia, F., Sanseviero, E. & Gabrilovich, D. I. Myeloid-derived suppressor cells in the era of increasing myeloid cell diversity. Nat. Rev. Immunol.21, 485–498 (2021). - PMC - PubMed

Publication types

LinkOut - more resources