. 2024 Nov 29;15(1):10393.
doi: 10.1038/s41467-024-54741-w.

Paired analysis of host and pathogen genomes identifies determinants of human tuberculosis

Affiliations

Paired analysis of host and pathogen genomes identifies determinants of human tuberculosis

Yang Luo et al. Nat Commun. .

Abstract

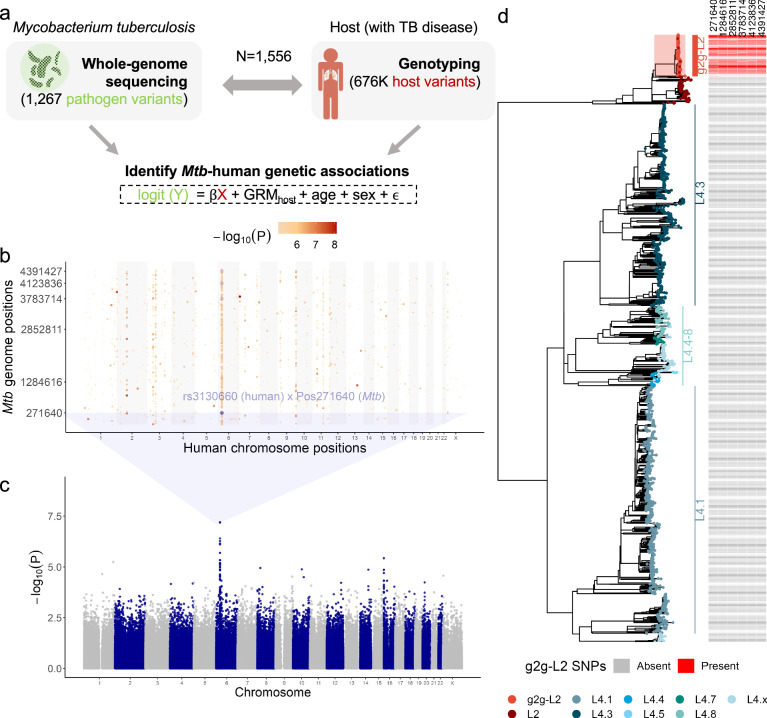
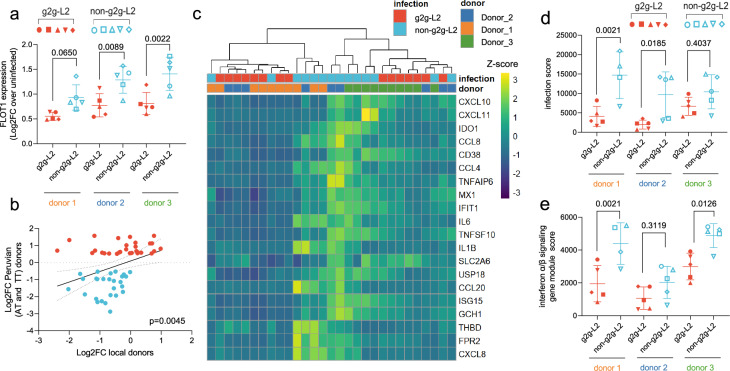
Infectious disease is the result of interactions between host and pathogen and can depend on genetic variations in both. We conduct a genome-to-genome study of paired human and Mycobacterium tuberculosis genomes from a cohort of 1556 tuberculosis patients in Lima, Peru. We identify an association between a human intronic variant (rs3130660, OR = 10.06, 95%CI: 4.87 - 20.77, P = 7.92 × 10⁻⁸) in the FLOT1 gene and a subclavaluee of Mtb Lineage 2. In a human macrophage infection model, we observe hosts with the rs3130660-A allele exhibited stronger interferon gene signatures. The interacting strains have altered redox states due to a thioredoxin reductase mutation. We investigate this association in a 2020 cohort of 699 patients recruited during the COVID-19 pandemic. While the prevalence of the interacting strain almost doubled between 2010 and 2020, its infection is not associated with rs3130660 in this recent cohort. These findings suggest a complex interplay among host, pathogen, and environmental factors in tuberculosis dynamics.


Conflict of interest statement

Competing interests: The authors declare no competing interests.

Figures

Fig. 1
Fig. 1. Human-to-Mtb genome-wide association study in 1556 tuberculosis patients.
a Study design schematic. We obtained DNA from 1556 Peruvian individuals with TB disease and cultured pathogens to perform host genotyping and Mtb WGS. The genotype of each common Mtb variant was considered as the response variable (Y: 0 or 1), and the genotype of each host variant was the independent variable (X: 0, 1 or 2), resulting in one test per host SNP-Mtb SNP pair. b Grid plot summarizing the genome-to-genome analysis. The x-axis denotes position within the human genome with alternating colors (white and light gray) for each chromosome. The y-axis denotes position within the Mtb genome. Point colors represent the association p-value (-log10(P)) from the mixed effect logistic regression. The most significant host-Mtb pair association is indicated. Six randomly chosen Mtb variants in tight linkage (Pearson r2 > 0.8) with position 271640 are shown in light blue, indicating that the same human variant rs3130660 is significantly associated with multiple Mtb positions. c Manhattan plot of the GWAS analysis when treating genotypes of Mtb position 271640 as the outcome. The x-axis indicates genomic location, where as the y-axis shows the (-log10(P)) from mixed effect logistic regression model (d) A maximum likelihood phylogenetic tree inferred from 13,981 variants of 1,555 Peruvian Mtb isolates (excluding one Lineage 1 sample for visualization purposes). Branch colors represent the inferred lineages. Filled squares on the right indicate the presence (red) or absence (gray) of the six Mtb variants identified in the g2g analysis and highlighted in (b) Source data for (a).-c are provided in the Source Data 1 file. Source data for (d) are provided in Source Data 2 file.
Fig. 2
Fig. 2. Human monocyte-derived macrophage (hMDM) transcriptional response to g2g-L2 and non-g2g-L2 infection.
a From n = 12 samples, the infection score is calculated based on gene expression levels of the top 20 infection-induced genes from an independent study. P-values are calculated by two-tailed pairwise student’s t-test. b, c show volcano plots of differentially expressed (DE) genes specific to bacterial strain or donor rs3130660 genotype, respectively. Significance was called by FDR-adjusted P-value < 0.01 and log2(fold-change) >0.7. d Hierarchical clustering of gene expression based on the union DE gene sets from (be) Pathway analysis of genes in each cluster from (e). f, k the expression of genes at the cis-region of rs3130660, specifically IER3 (f), VARS2 (g), ZNRD1 (h), FLOT1 (i), HLA-E (j) and PPP1R18 (k). Each dot represents the average gene log2(TPM + 1) of g2g-L2 (red) or non-g2g-L2 (blue) infection within individual AT or TT donors from n = 12 samples. The P-values are calculated by two-tailed pairwise Student’s t-test either between AT and TT donors or between g2g-L2 and non-g2g-L2 within donors with the same genotype. Source data are provided in the Source Data 1 file.
Fig. 3
Fig. 3. Boston donor human monocyte-derived macrophage (MDM) transcriptional response to g2g-L2 and non-g2g-L2 infection.
a FLOT1 expression of MDM from three local anonymous donors after g2g-L2 or non-g2g-L2 infection (5 representative strains, n = 5 per donor). Data is presented as mean +/- SD. A two-way ANOVA (two-sided, Sidak’s multiple comparison test) was performed to determine statistical significance for each donor. b Pearson correlation (two-sided) between bacterial-specific DEGs (Fig. 2b) of the Peruvian donor MDMs (n = 12 samples) and their expression in healthy donor MDMs (n = 3 samples). Genes are colored according to their upregulation in the g2g-L2 (red) or non-g2g-L2 (blue) infected Peruvian MDMs. c Heatmap of the top 20 infection-induced genes in g2g-L2 and non-g2g-L2 infected Boston donor MDMs (n = 3). d Canonical Mtb infection gene module score and (e). interferon α/β signaling gene module score after infection with representative g2g-L2 or non-g2g-L2 strains in the local donor MDMs (5 representative strains, n = 5 per donor except donor 1 non-g2g-L2 n = 4). Data are presented as mean +/- SD. A two-way ANOVA (two-sided, Sidak’s multiple comparison test) was performed to determine statistical significance for each donor. Source data are provided in the Source Data 1 file.
Fig. 4
Fig. 4. Functional characterization of g2g-L2 Mtb strains.
a Violin plots for each phenotype measured by high-throughput microscopy, showing the distribution of each feature between the g2g-L2 and non-g2g-L2 strains. Samples were assayed at minimum in duplicate. The line inside each plot indicate indicates the median. P-values obtained by a Wilcoxon test. The red dotted line indicates the Bonferroni corrected significance threshold after multiple testing (-log10(0.05/7)). b Representative images of autofluorescence signals in two representative g2g-L2 strains and two non-g2g-L2 strains. Scale bar: 5 µm. Images are representative of two independent experiments and the remainder of the g2g-L2 and non-g2g-L2 strains. c Total NAD was extracted from five g2g-L2 and five non-g2g-L2 Mtb strains and the NAD + /NADH ratio was determined. Each point represents the average of two independent replicates per strain (n = 5). Data are presented as mean +/- SD. A two-tailed unpaired t-test was used to determine statistical significance between the groups. Mtb mid-log phase cultures were treated with (d) 50 uM menadione for 24 h or (e) 25 mM H2O2 for 4 h, and surviving CFUs were determined by plating. A total of 10 Mtb strains were used (five g2g-L2 and five non-g2g-L2), with two independent replicates per strain. Data are presented as mean +/- SD. A two-way ANOVA (two-sided, Sidak’s multiple comparison test) was used to determine statistical significance between the groups. TRFS-green was incubated with (f) four g2g-L2 and four non-g2g-L2 Mtb strains (n = 5 per strain) or with (g) M.smegmatis strains constitutively expressing either the g2g or non-g2g-L2 variant Rv3913-3914 operon (n = 5 per strain). Fluorescence intensity was measured over time, the mean AUC for each strain was quantified and a two-tailed unpaired t-test was used to determine statistical significance. Data are presented as mean +/- SD. h Total NAD was extracted from a wildtype M.smegmatis strain, or M.smegmatis constructs constitutively expressing either the g2g or non-g2g-L2 variant Rv3913-3914 operon, and the NAD + /NADH ratio was determined (n = 3). Data are presented as mean +/- SD. A one-way ANOVA (two-sided, Tukey’s multiple comparison test) was used to determine statistical significance between groups. Source data are provided in the Source Data 1 file.
Fig. 5
Fig. 5. Phylogenetic structure of the g2g-L2 clade associated with the human alleles.
a A phylogenetic tree of L2 constructed with 255 L2 Peruvian isolates. The g2g-L2 clade identified via the g2g analysis is highlighted in red (Clade-A), two other Peruvian subclades of L2 are highlighted in blue (Clade-B) and green (Clade-C) respectively. *ybp years before present. Estimated emerging time (median value, with 95% highest posterior distribution in bracket) for the ancestor strains and cluster rate when using 6-SNP distance of each marked L2 clade (Clade-A, B and C) are listed. b Histogram of pairwise minimum SNP distance to the closest neighbors within the marked clades. c Comparison of transmission cluster rate between the three marked clades when using 6-SNP and 12-SNP distance as the threshold. d The percentage of g2g-L2 strains among all co-circulating strains from the 2010 cohort and the 2020 cohort. e The percentage of g2g-L2 strains among L2 strains from the 2010 cohort and the 2020 cohort. P-values shown in (c) and (d) were obtained by two-sided Fisher’s exact test. Source data for (a). are provided in the Source Data 3 file. Source data for (b). -d are provided in the Source Data 1 file.

References

    1. Tian, C. et al. Genome-wide association and HLA region fine-mapping studies identify susceptibility loci for multiple common infections. Nat. Commun.8, 599 (2017). - PMC - PubMed
    1. Sakaue, S. et al. A cross-population atlas of genetic associations for 220 human phenotypes. Nat. Genet.53, 1415–1424 (2021). - PubMed
    1. Houben, R. M. G. J. & Dodd, P. J. The global burden of latent tuberculosis infection: a re-estimation using mathematical modelling. PLoS Med.13, e1002152 (2016). - PMC - PubMed
    1. Organization, W. H. & Others. Global Tuberculosis Report 2018. 2018. Geneva: World Health Organizationhttps://iris.who.int/handle/10665/274453 (2019).
    1. Thye, T. et al. Genome-wide association analyses identifies a susceptibility locus for tuberculosis on chromosome 18q11.2. Nat. Genet.42, 739–741 (2010). - PMC - PubMed

Publication types

MeSH terms

Substances