. 2024 Nov 29;15(1):10400.
doi: 10.1038/s41467-024-54810-0.

Specific surface-modified iron oxide nanoparticles trigger complement-dependent innate and adaptive antileukaemia immunity

Affiliations

Specific surface-modified iron oxide nanoparticles trigger complement-dependent innate and adaptive antileukaemia immunity

Yuanyuan Li et al. Nat Commun. .

Abstract

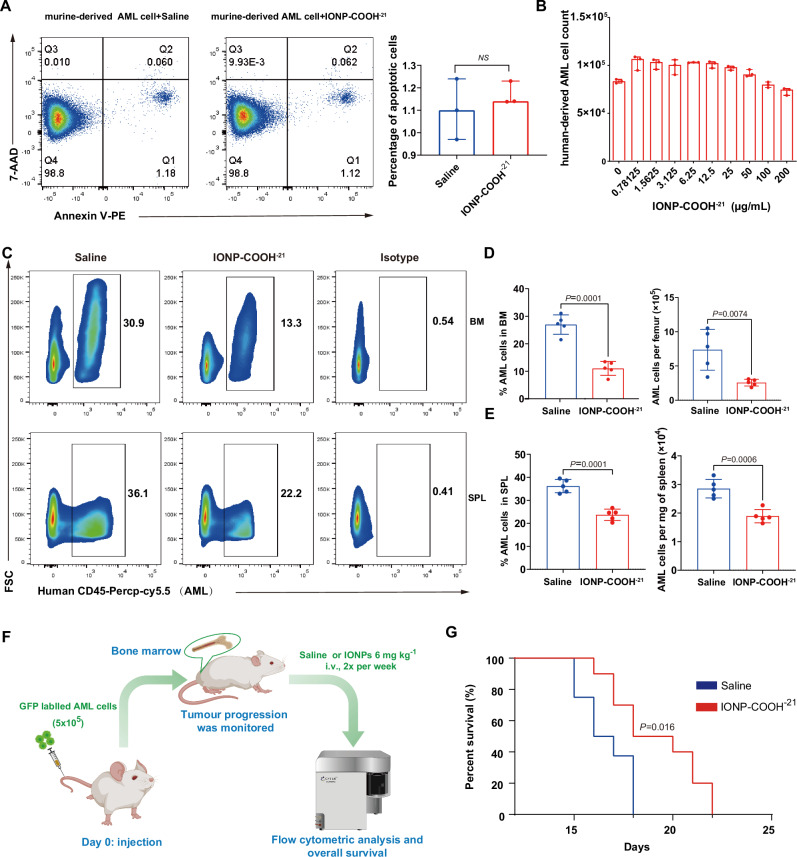
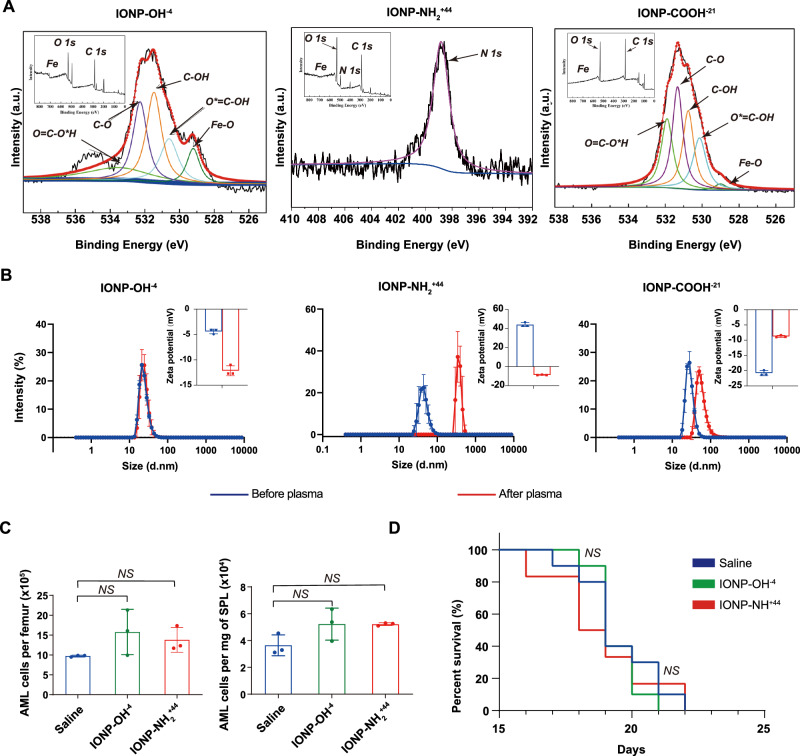
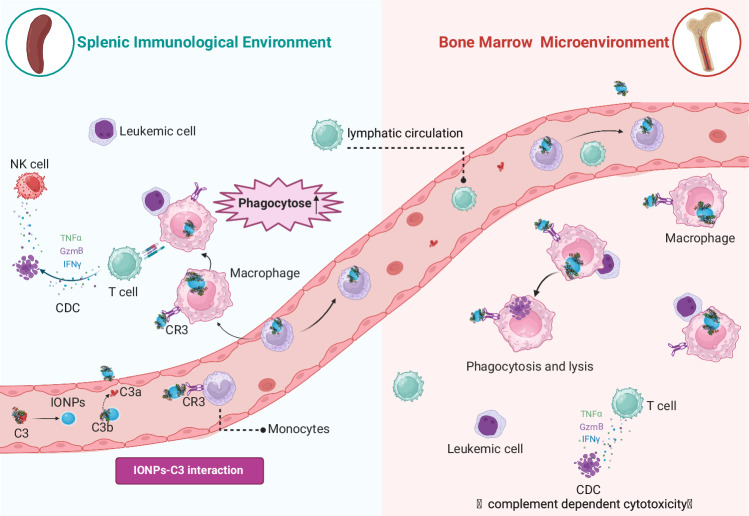
Considerable advances have been achieved in the application of nanomaterials for immunotherapies, yet the precise immune effects induced by protein corona remain elusive. Here, we explore the formation mechanism and immune regulation process of protein corona in acute myeloid leukaemia (AML) mouse models using commercialized iron oxide nanoparticles (IONPs), with different surface modifications, including an FDA-approved variant. Using macrophages depleted or Complement Component 3 (C3) knockout mice, we demonstrate that carboxymethyl dextran-coated IONP (IONP-COOH) reduces leukaemia burden. Mechanistically, IONP-COOH indirectly binds to C3b after activating the complement alternative pathway, subsequently enhancing phagocytosis of macrophages and activating adaptive immunity mediated by complement corona. While aminated dextran-coated IONPs directly absorb C3b and activate the lectin pathway, leading to immune cell exhaustion. Our findings suggest that IONP-COOH may serve as an immune activator for AML treatment, offering a promising approach to developing therapeutic nanomaterials by leveraging surface chemistry to enhance immunotherapy.


Conflict of interest statement

Competing interests: The authors declare no competing interests.

Figures

Fig. 1
Fig. 1. IONP-COOH−21 inhibited leukaemia progression by indirectly killing.
A The apoptosis analysis of BCR-nup cells incubated with IONP-COOH−21 at 200 μg mL−1 for 24 h (n = 3 technical replicates; the experiment was independently repeated on three different days), apoptosis ratio (%) = Q1 + Q2. B Number of MOLM-13 cells after co-incubation with IONP-COOH−21 for 24 h at different iron concentrations (n = 3 technical replicates; the experiment was independently repeated on three different days), data of (A, B) are represented as mean ± SD. CE, AML mice were injected (IV) with saline or IONP-COOH−21 6 mg kg−1 on day 11, and tumour burden was analyzed on day 12 (n  =  5 mice). The leukaemic cells were identified by human CD45+ expression. Experimental scheme (F) and Kaplan-Meier survival curves (G) for the effect of IONP-COOH−21 on overall survival (n = 10 mice/group), created in BioRender. https://BioRender.com/o33l748. Unpaired two-tailed t-tests were used in (AE). Survival curves were compared using a log-rank Mantel-Cox test. Source data are provided as a Source Data file.
Fig. 2
Fig. 2. IONP-COOH−21 suppressed myeloid leukaemia progression in a complement-dependent manner.
C57BL/6N AML mice were treated with saline (n = 5 mice) or IONP-COOH−21 at 6 mg kg−1 (n = 7 mice) on days 3 and 8. The percentage (A) and absolute cell counts (B) of leukaemia cells were analyzed on day 10. C Number of tumour cells after depleted macrophages. n = 4 mice, liposome control; n = 8 mice, clodronate group and IONP-COOH−21-treated group. D Red, macrophages, F4/80-PE; Green, leukaemia cells, CFSE; White, macrophages engulfed leukaemia cells. Scale bar, 50 µm. n = 9 technical replicates, saline and IONP-COOH−21-treated WT groups; n = 12 technical replicates, C3KO group. Primary cells were isolated from five mice, and the experiment was independently repeated on three different days. E Counts of leukaemic cell. Percentage of Granzyme B and IFN-γ in CD8+, CD4+ T (F, G) and NK cells (H). EH. n = 10 mice, saline- WT; n = 11 mice, IONP-COOH−21- WT; n = 5 mice, C3 knockout. All data are presented as mean ± SD. A two-tailed t-test was used in (B). One-way ANOVA with multiple comparison adjustments was applied in others. Source data are provided as a Source Data file.
Fig. 3
Fig. 3. Physicochemical characterisation and antileukaemia effects of IONPs.
A XPS analysis of high-resolution O1s spectrum of IONP-OH and IONP-COOH and high-resolution N1s spectrum of IONP-NH2. The XPS survey spectra of the corresponding nanomaterials were presented in the inset. B The hydrodynamic size and zeta potential of IONPs were assessed both before (blue) and after (red) incubation with human plasma. The IONPs were incubated with human plasma and washed three times. Each experiment was repeated twice using samples obtained from three different donors, with three technical replicates performed for each measurement. C NSG mice were inoculated intravenously (IV) with 5 ×105 MOLM-13 cells to establish an AML mouse model. The mice were injected (IV) with saline or IONPs 6 mg kg−1 on day 11 and the tumour burden was analyzed by flow cytometry on day 12 (n = 3 mice/group). The absolute numbers of AML cells were calculated by multiplying the frequency of human CD45+ cells by the total concentration of splenic cells or bone marrow cells from the femur. Bars represent the mean, and error bars represent SD. One-way ANOVA with multiple comparison adjustments was applied in (C). D NSG mice treated with saline or 6 mg kg−1 of IONPs by (n = 10 mice/group), survival curves were analyzed using the Kaplan-Meier method. Source data are provided as a Source Data file.
Fig. 4
Fig. 4. IONPs with different functional groups activated the complement system through distinct complement pathways.
A 3D PCA for protein. BC Protein corona was identified by LC-MS. D Scheme of complement pathways (Created in BioRender. https://BioRender.com/b64n273). E, Bioinformatic pathway analysis for top 20 proteins based on KEGG pathway database. F Quantitative assay of C3b and properdin number per IONP. The dots represent individual data points corresponding to plasma samples collected from three different individuals (n = 3 healthy donor samples, biological replicates). The experiment was independently repeated three times. Data were evaluated by two-way ANOVA with multiple comparison adjustments. G Western blot of Bb/C3b after incubation with AML plasma. Samples were derived from the same experiment batch but different gels for Bb, and another for C3b were processed in parallel. The experiment was repeated three times independently with similar results. H ELISA detection of C1s/C1-INH and MASP/C1-INH complexes. The dots represent individual data points corresponding to plasma samples collected from different individuals (n = 6 healthy donor samples for C1s/C1-INH, n = 3 healthy donor samples for MASP/C1-INH, all representing biological replicates). The experiment was independently repeated twice. Data were evaluated by one-way ANOVA with multiple comparison adjustments. I Curves of the C3b/IgG and IONPs by biolayer interferometry. Source data are provided as a Source Data file.
Fig. 5
Fig. 5. Surface residues influenced IONPs’ biodistribution, cellular internalisation and the biodistribution of immune cells.
A Schematic illustration of experimental workflow (Created in BioRender. Chen, F. (2022) https://BioRender.com/b86y336). B The half-lives of IONPs. The sample was collected at different points, and IONPs were determined by iron assay (n = 6 mice/group). The t1/2 was calculated by nonlinear regression curve fitting. C The iron was quantified by inductively coupled plasma mass spectrometry (ICP-MS) (n = 3 mice). D Schematic illustration for the tracking CFSE labelled peripheral blood immune cells upon IONPs treatment. Created in BioRender. https://BioRender.com/a59b438. E Organ relative distribution of CFSE+ peripheral cells (n = 3 mice), the experiment was independently repeated twice. F Schematic illustration of the experimental setups. G The absolute count of immune cells in mouse whole blood (n = 3 mice) that phagocytosed plasma-preincubated IONPs. Data are presented as mean ± SD. The experiment was independently repeated twice. A two-tailed t-test was used in (G). Source data are provided as a Source Data file.
Fig. 6
Fig. 6. Surface residues influenced IONPs’ homoeostasis in vivo.
A Schematic illustration for in vivo immune system study on C57BL/6N mice given a single dose of 10 mg Fe kg−1 IONPs injection (Created in BioRender. https://BioRender.com/h38h965). B Visualisation of the major splenocytes using tSNE plots after different IONPs treatments. C The number of peripheral WBCs changes following IONP administration, data are presented as mean ± SD, with n = 3 mice, experiment was repeated twice independently with similar results. Data were evaluated by two-way ANOVA with multiple comparison adjustments. The flow cytometry gate strategy is shown in Supplementary Fig.12. D Representative histological images for tissue sections with hematoxylin and eosin staining (H&E) to evaluate biosafety in vivo. The organs were stained with H&E 24 h after saline or IONP injection. H&E staining showed structural derangement in the spleen (black arrows). Scale bar, 100 µm.
Scheme 1
Scheme 1
Nanoparticles dynamically interact with immune cells via complement corona to exert antileukaemia efficacy. The interactions that occur at the IONPs-complement interface play a vital role in determining the immunological effects. IONP could adopt complement C3b, thereby bind to the C3 receptor (CR3) of the circulating monocytes. The activated circulating monocytes migrated to immune organs and differentiatied into resident macrophages, at the same time, IONPs-C3b complex potentiated the phagocytosis of leukaemia cells by resident macrophages. Furthermore, macrophages can present tumour antigens to T cells, subsequently activated adaptive antileukaemia immunity (Created in BioRender. Chen, F. (2023) https://BioRender.com/z95h917).

References

    1. Romero, A. et al. Clinical Characteristics of Chilean Adult Patients with Acute Myeloid Leukemia (AML): Analysis within the Framework of the Epidemiological Registry of AML of the Pethema Group. Blood140, 8963–8965 (2022).
    1. Newell, L. F. & Cook, R. J. Advances in acute myeloid leukemia. BMJ375, n2026 (2021). - PubMed
    1. Surapally, S., Tenen, D. G. & Pulikkan, J. A. Emerging therapies for inv (16) AML. Blood137, 2579–2584 (2021). - PMC - PubMed
    1. Yi, M. et al. The global burden and attributable risk factor analysis of acute myeloid leukemia in 195 countries and territories from 1990 to 2017: estimates based on the global burden of disease study 2017. J. Hematol. Oncol.13, 72 (2020). - PMC - PubMed
    1. Ci, T. et al. Delivery strategies in treatments of leukemia. Chem. Soc. Rev.51, 2121–2144 (2022). - PubMed

Publication types

MeSH terms