. 2024 Nov 29;10(1):227.
doi: 10.1038/s41531-024-00841-9.

MJF-14 proximity ligation assay detects early non-inclusion alpha-synuclein pathology with enhanced specificity and sensitivity

Affiliations

MJF-14 proximity ligation assay detects early non-inclusion alpha-synuclein pathology with enhanced specificity and sensitivity

Nanna Møller Jensen et al. NPJ Parkinsons Dis. .

Abstract

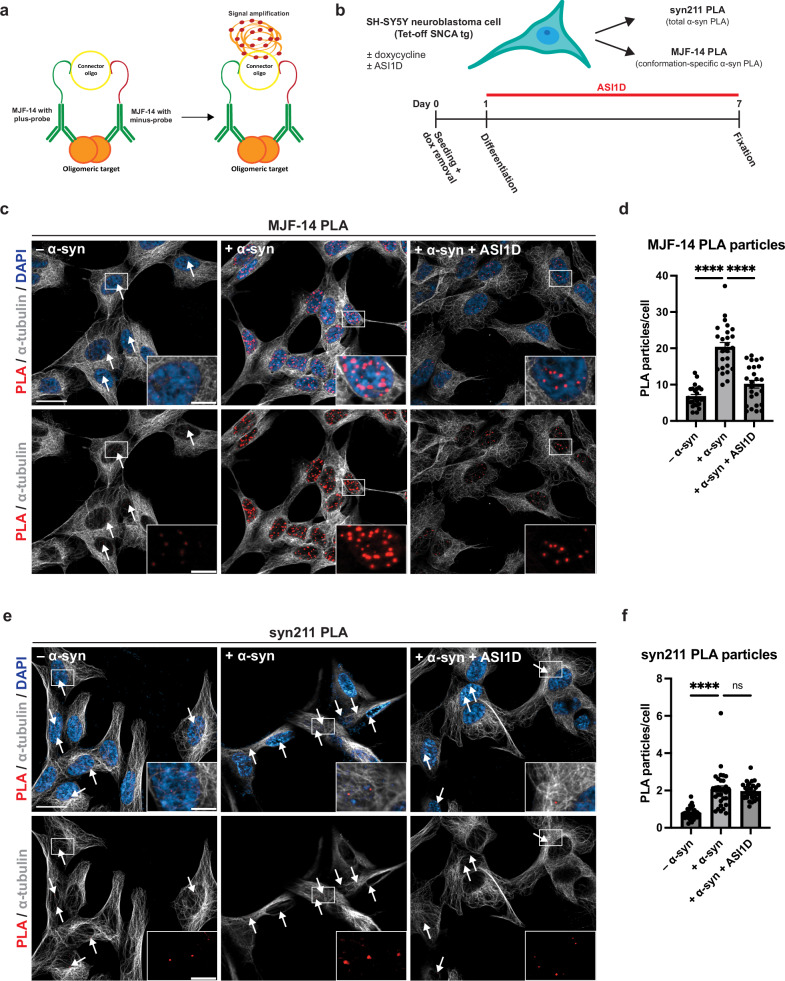
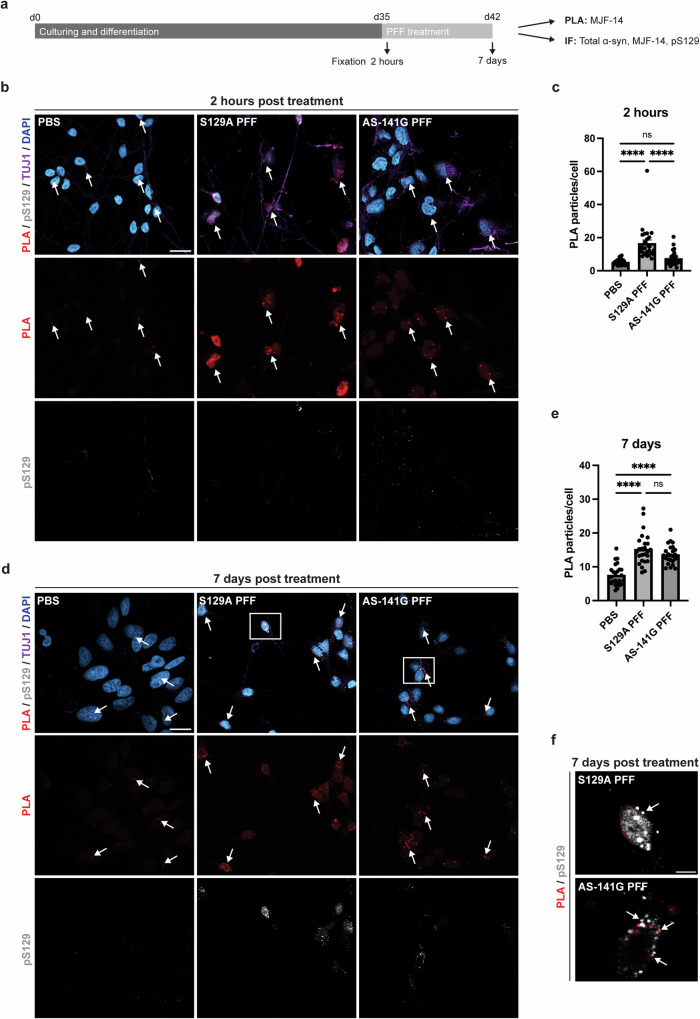
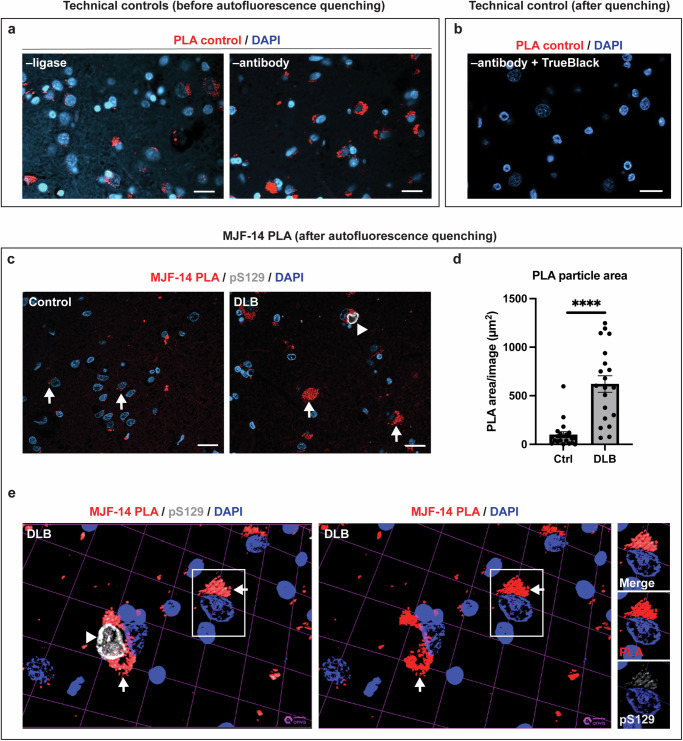
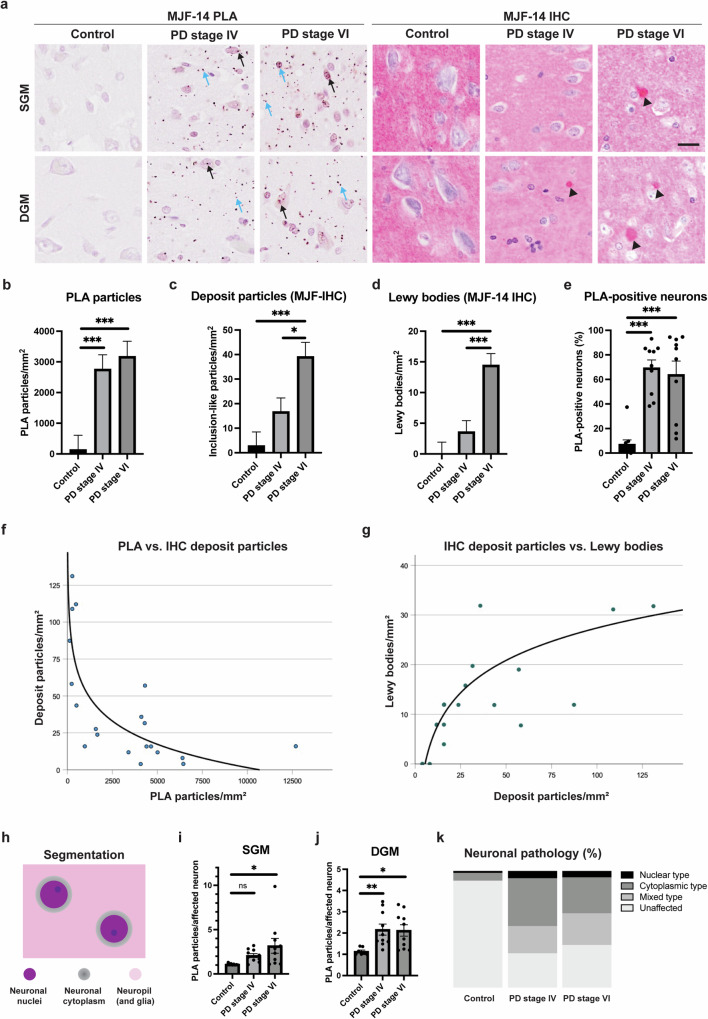
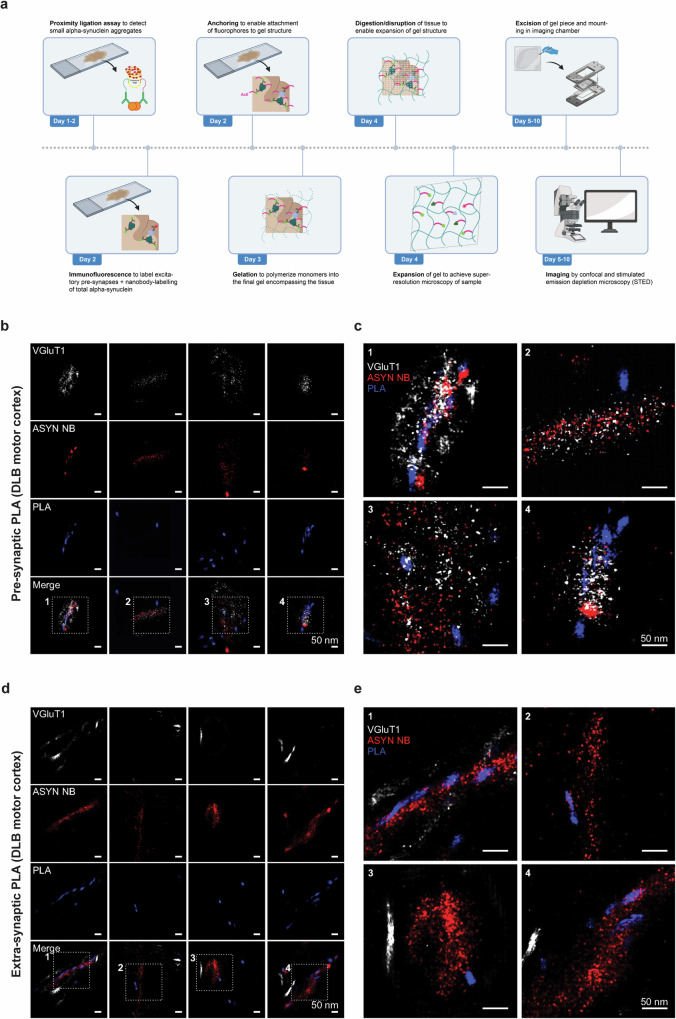
α-Synuclein proximity ligation assay (PLA) has proved a sensitive technique for detection of non-Lewy body α-synuclein aggregate pathology. Here, we describe the MJF-14 PLA, a new PLA towards aggregated α-synuclein with unprecedented specificity, using the aggregate-selective α-synuclein antibody MJFR-14-6-4-2 (hereafter MJF-14). Signal in the assay correlates with α-synuclein aggregation in cell culture and human neurons, induced by α-synuclein overexpression or pre-formed fibrils. Co-labelling of MJF-14 PLA and pS129-α-synuclein immunofluorescence in post-mortem cases of dementia with Lewy bodies shows that while the MJF-14 PLA reveals extensive non-inclusion pathology, it is not sensitive towards pS129-α-synuclein-positive Lewy bodies. In Parkinson's disease brain, direct comparison of PLA and immunohistochemistry with the MJF-14 antibody shows widespread α-synuclein pathology preceding the formation of conventional Lewy pathology. In conclusion, we introduce an improved α-synuclein aggregate PLA to uncover abundant non-inclusion pathology, which deserves future validation with brain bank resources and in different synucleinopathies.


Conflict of interest statement

Competing interests: The authors declare no competing interests.

Figures

Fig. 1
Fig. 1. MJF-14 PLA signal is directly dependent upon aggregate formation in α-synuclein transgenic neuroblastoma cells.
a Principle of the proximity ligation assay for detection of α-synuclein aggregates. b Experimental setup: α-synuclein transgenic SH-SY5Y cells are differentiated into non-mitotic neuronal-like cells using retinoic acid, treated ± doxycycline to mediate α-synuclein overexpression and ± ASI1D to modulate α-synuclein aggregation. Then, cells are fixed and subjected to PLA using the α-synuclein conformation-specific MJFR-14-6-4-2 antibody or the total α-synuclein syn211 antibody. c Representative images of MJF-14 PLA in conditions without α-synuclein expression, with α-synuclein expression, and with α-synuclein expression + ASI1D-treatment. PLA signal is displayed in red (small dots), α-tubulin in grey and DAPI in blue. Arrows indicate examples of PLA particles in low abundance conditions. Scale bar = 20 µm. d Quantification of the number of PLA particles per cell, as determined by the MJF-14 PLA. The +α-syn condition is significantly different from both -α-syn and +α-syn + ASI1D (p < 0.0001). e Representative images of syn211 PLA in conditions without α-synuclein expression, with α-synuclein expression, and with α-synuclein expression + ASI1D-treatment. PLA signal is displayed in red (small dots), α-tubulin in grey and DAPI in blue. Arrows indicate examples of PLA particles in low abundance conditions. Scale bar = 20 µm. f Quantification of the number of PLA particles per cell, as determined by the syn211 PLA. The +α-syn condition is significantly different from -α-syn (p < 0.0001) but not +α-syn + ASI1D (p > 0.9999). Graphs display mean ± SEM from one replicate and each dot signifies one image. Experiments were performed minimum three times independently, and groups were compared using a Kruskal-Wallis one-way ANOVA followed by the Dunn post hoc test. ****p < 0.0001.
Fig. 2
Fig. 2. AS-141G PFFs induce formation of PLA signal in human neurons but added PFFs themselves are undetected.
a Human cortical neurons were cultured for 35 days before treatment with either S129A PFFs, AS-141G PFFs (S129A-α-synuclein-141G), or PBS, and fixed after 2 h or 7 days. b Representative images from 2 h post treatment cultures immunostained with MJF-14 PLA (red), pS129-α-synuclein (grey), βIII-tubulin/TUJ1 (purple), and DAPI nuclear stain (blue). Arrows indicate examples of PLA signals. Scale bar = 20 µm. c Quantification of the number of PLA particles per cell after 2 h, as determined by the MJF-14 PLA. Treatment significantly affects PLA signal density (F(2,269) = [47.79], p < 0.0001), with the S129A PFF group differing from both PBS and AS-141G PFF groups (p < 0.0001) while PBS and AS-141G PFF groups do no differ significantly (p = 0.2318). d Representative images from 7 days post treatment cultures immunostained with MJF-14 PLA (red), pS129-α-synuclein (grey), βIII-tubulin (purple), and DAPI nuclear stain (blue). Arrows indicate examples of PLA signals. Scale bar = 20 µm. e Quantification of the number of PLA particles per cell after 7 days, as determined by the MJF-14 PLA. Treatment significantly affects PLA signal density (F(2,296) = [35.26], p < 0.0001), with the PBS group differing from both S129A and AS-141G PFF groups (p < 0.0001) while S129A and AS-141G PFF groups do no differ significantly (p = 0.5009). f Magnified panels from (d) with arrows indicating the co-detection of particles with both MJF-14 PLA (red) and pS129-α-synuclein (grey). Scale bar = 5 µm. Graphs display mean ± SEM from two independent replicates and each dot signifies one image. Experiments were performed two times independently with two technical replicates each time, and groups were compared using a two-way ANOVA followed by Tukey’s multiple comparison test. ****p < 0.0001.
Fig. 3
Fig. 3. MJF-14 PLA stains considerable pathology in DLB brains but is not sensitive to Lewy bodies.
a Technical negative controls: PLA –ligase in the reaction (left) and PLA –antibody (right) display significant amounts of red channel signal when autofluorescence is not quenched. Scale bars = 20 µm. b TrueBlack-quenching of autofluorescence effectively removes background signal in technical negative controls (here, PLA –antibody). Scale bar = 20 µm. c Representative images of sections immunostained with MJF-14 PLA (red), pS129-α-synuclein (pS129, grey), and DAPI nuclear stain (blue) in control (left) and DLB (right). Examples of PLA-positive neurons are indicated with arrows, while a LB-positive neuron is indicated by an arrowhead. Scale bars = 20 µm. d Quantification of PLA particle area in control and DLB, compared by a non-parametric Mann–Whitney U-test. Graph displays mean ± SEM of the total PLA area in µm2/image, with each dot representing one image. ****p < 0.0001. e Close-up z-stack rendering of a LB-containing neuron, with (left) and without (right) pS129, displaying the lack of PLA-staining of the LB. PLA-signal (red, arrows) and LB (grey, arrowhead) is highlighted. Smaller panels on the right show weak pS129 IF-labelling of PLA particles.
Fig. 4
Fig. 4. MJF-14 PLA efficiently distinguishes PD patients from controls but does not discriminate between stage IV and stage VI PD in the anterior cingulate cortex.
a Representative images comparing MJF-14 PLA and MJF-14 IHC in the superficial (SGM) and deep (DGM) layers of the ACC from control, Braak stage IV, and Braak stage VI PD. Black arrows indicate neuronal PLA, blue arrows indicate glial and neuropil PLA signals, and arrowheads highlight deposit particles/LBs. Scale bar = 20 µm. b Quantification of the total PLA particle count per mm2. The control group is significantly different from the two PD groups (p < 0.001). c Quantification of the total deposit particle count per mm2 (detected by IHC). PD stage VI is significantly different from both controls (p < 0.001) and PD stage IV (p = 0.011). d Quantification of LB count per mm2. PD stage VI is significantly different from both controls and PD stage IV (p < 0.001). Values plotted in (bd) can be found in Suppl. Table 4. e Percentage of neurons containing PLA particles (averaged for SGM and DGM). Each subject is indicated as a dot. Both PD groups are significantly different from controls (p < 0.001), but not from each other (p = 0.409). For more information, see Suppl. Table 5. f Correlation between PLA particles and deposit particles (IHC) in PD stage VI. The density of PLA particles is inversely logarithmically correlated with the density of deposit particles (rs [20] = −0.732, p < 0.001). g Correlation between deposit particles and LBs in PD stage VI. The density of LBs is positively correlated with the density of deposit particles (rs [20] = 0.675, p = 0.001). h Schematic representation of image segmentation for analysis: PLA pathology is analysed inside neuronal cell bodies (in nuclei (purple) and/or assumed cytoplasm (grey)) as well as away from neuronal cell bodies (denoted neuropil, but also containing glia (pink)). i Quantification of the average PLA particle count per affected neuron in SGM, with each subject indicated as one dot. There are significantly more PLA particles in affected neurons of PD stage VI than controls (p = 0.011) and a similar non-significant tendency for PD stage IV (p = 0.218). j Quantification of the average PLA particle count per affected neuron in DGM, with each subject indicated as one dot. The control group is significantly different from both PD stage IV (p = 0.007) and stage VI (p = 0.011). Values plotted in (i, j) can be found in Supplementary Table 6. k Proportion of different types of neuronal pathology, gradient grey coded for unaffected, solely nuclear, solely cytoplasmic, or mixed nuclear and cytoplasmic types. Values used for generating the graphic can be found in Supplementary Table 7. Data are displayed as mean ± SEM, averaged for SGM and DGM unless otherwise indicated, and comparisons are made using univariate analyses covarying with age, sex and post-mortem delay. *p < 0.05, **p < 0.01, ***p < 0.001.
Fig. 5
Fig. 5. Applying ONE microscopy to PLA imaging decisively identifies α-synuclein aggregates at the presynaptic terminal in DLB motor cortex.
a Experimental setup of ONE microscopy combined with MJF-14 PLA. Samples were stained for MJF-14 PLA, then VGLUT1 and total α-synuclein, before tissue expansion and ONE imaging of gels. be Individual channel + merged images from DLB motor cortex. VGLUT1 (white) labels excitatory presynapses, MJF-14 PLA (blue) labels small α-synuclein aggregates, and Asyn-Nb (red) labels total α-synuclein. b, c Examples of presynaptic PLA shown by co-localisation of PLA signal with both total α-synuclein and VGLUT1. d, e Examples of extra-synaptic PLA, identified by co-localisation of PLA signal with total α-synuclein but not with VGLUT1. All scale bars = 50 nm. Panel (a) is created with BioRender.com.
Fig. 6
Fig. 6. MJF-14 PLA signal is not specific for α-synuclein in mouse models.
a Comparison of MJF-14 PLA signal in α-synuclein transgenic (ASO) and α-synuclein knockout (ASKO strain #1) mice, using PLA probes and detection kits from Duolink (Sigma). b Similar comparison of MJF-14 PLA signal as in (a) but using PLA probes and detection kits from Navinci. c MJF-14 PLA signal in a different α-synuclein knockout strain (ASKO strain #2), compared with WT, and triple α-/β-/γ-synuclein knockout mice (TKO). d MJF-14 PLA signal in α-/β-synuclein double knockout mice (A/B-KO). All scale bars = 20 µm.

References

    1. Spillantini, M. G. & Goedert, M. The α-synucleinopathies: Parkinson’s disease, dementia with Lewy bodies, and multiple system atrophy. Ann. N. Y. Acad. Sci.920, 16–27 (2000). - PubMed
    1. de Lau, L. M. L. et al. Epidemiology of Parkinson’s disease. Lancet Neurol.5, 525–535 (2006). - PubMed
    1. Ascherio, A. & Schwarzschild, M. A. The epidemiology of Parkinson's disease: risk factors and prevention. Lancet Neurol.15, 1257–1272 (2016). - PubMed
    1. Polymeropoulos, M. H. Mutation in the α-Synuclein gene identified in families with Parkinson’s disease. Science276, 2045–2047 (1997). - PubMed
    1. Krüger, R. et al. Ala30Pro mutation in the gene encoding α-synuclein in Parkinson’s disease. Nat. Genet.18, 106–108 (1998). - PubMed

LinkOut - more resources