. 2024 Nov 29;14(1):29667.
doi: 10.1038/s41598-024-81042-5.

StressFit: a hybrid wearable physicochemical sensor suite for simultaneously measuring electromyogram and sweat cortisol

Affiliations

StressFit: a hybrid wearable physicochemical sensor suite for simultaneously measuring electromyogram and sweat cortisol

Nafize Ishtiaque Hossain et al. Sci Rep. .

Abstract

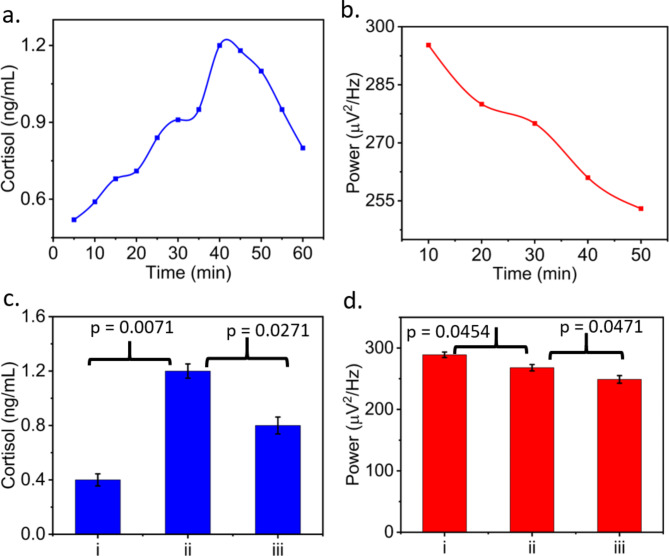
This study introduces StressFit, a novel hybrid wearable sensor system designed to simultaneously monitor electromyogram (EMG) signals and sweat cortisol levels. Our approach involves the development of a noninvasive skin patch capable of monitoring skin temperature, sweat pH, cortisol levels, and corresponding EMG signals using a combination of physical and electrochemical sensors integrated with EMG electrodes. StressFit was optimized by enhancing sensor output and mechanical resilience for practical application on curved body surfaces, ensuring accurate acquisition of cortisol, pH, body temperature, and EMG data without sensor interference. In addition, we integrated an onboard data processing unit with Internet of Things (IoT) capabilities for real-time acquisition, processing, and wireless transmission of sensor measurements. Sweat cortisol and EMG signals were measured during cycling exercises to evaluate the sensor suite's performance. Our results demonstrate an increase in sweat cortisol levels and decrease in the EMG signal's power spectral density following exercise. These findings suggest that combining sweat cortisol levels with EMG signals in real-time could serve as valuable indicators for stress assessment and early detection of abnormal physiological changes.


Conflict of interest statement

Declarations. Competing interests: The authors declare no competing interests.

Figures

Fig. 1
Fig. 1
Overview of StressFIT: (a) Depiction of how cortisol enters the circulatory system and gets detected by StressFIT. (b) Diagram outlining the flexible StressFIT sensor patch and its primary functionalities: EMG monitoring, sweat cortisol analysis, pH, and temperature detection. (c) Summary of the electrochemical surface functionalization process: LIG was first treated with gold (Au)-doped multiwalled carbon nanotubes (MWCNT), followed by the application of anti-cortisol for the purpose of cortisol detection. (d) Electronics level block diagram illustrating signal transduction, processing, and wireless transmission of data from the sensors to the user interface. (e) Real-time implementation of the StressFIT system. (f) The Blynk mobile application displaying real-time data for sweat cortisol, temperature, pH, and EMG signals through IoT connectivity.
Fig. 2
Fig. 2
(a) Plot of electrical resistance of the LIG electrode as a function of the speed of the laser beam. (b) Electrical resistance of the LIG electrode as a function of the laser power. (c) Electrical resistance of LIG as a function of applied current. (d) SEM Image of the bare LIG electrode. (e) SEM image of the PANI-AuNP-MWCNT functionalized working electrode, WEc. (f) Cyclic Voltammetry (CV) plots for layer-by-layer immobilization of the cortisol working electrode, WEc. (g) FTIR response of the AuNP doped MWCNT. (h) Impedance vs. frequency characterization of the EMG electrodes. The error bars represent three repeated measurements.
Fig. 3
Fig. 3
(a) pH sensor response when exposed to various pH levels. (b) Calibration curve of pH sensor. (c) Temperature sensor response to alternating temperatures. (d) Calibration curve of the temperature sensor. (e) Cyclic voltammetry responses of the cortisol sensor at different concentrations of cortisol. (f) Calibration curve for the cortisol sensor. (g) Selectivity test for the cortisol sensor. (h) Raw EMG signal collected from the sensor patch. (i) pH sensor response at different temperatures. (j) Temperature sensor response at different humidity conditions. (k) Cortisol sensor response at different pH levels. (l) Cortisol sensor response at different temperatures. The error bars represent the standard error for three repeated measurements.
Fig. 4
Fig. 4
(a) The skin patch prototype undergoing bending in two directions. Vertical bending test conducted for the (b) cortisol, (c) pH, and (d) temperature sensors. Horizontal bending test performed for the (e) cortisol, (f) pH, and (g) temperature sensors. (h) A conceptual depiction of the cortisol circadian rhythm regulated by the light-dark cycle. (i) The circadian rhythm of sweat cortisol was examined over a 4-day period in a healthy individual. (j) Visual representation of monitoring stress response by tracking an individual’s cortisol levels, with biking as the stressor. (k) Monitoring cortisol levels of a physically active subject over four days during a cycling session with consistent workload.
Fig. 5
Fig. 5
(a) The spacing between the cortisol and EMG sensor is 3 mm, resulting in alterations in cyclic voltammetry current (b), with a zoomed in view shown in (c). (d) The spacing between the cortisol and EMG sensor is increased to 5 mm, resulting in a clean CV signal (e), with a closer view provided in (f).
Fig. 6
Fig. 6
(a) Raw EMG signal recorded during weightlifting. (b) The absolute value of rectified EMG signal. (c) Moving average of the rectified EMG signal with a 30% overlap. The time-domain EMG signals recorded at the (d) beginning and (e) end of the cycling exercise. The frequency-domain EMG signals recorded at the (f) beginning and (g) end of the cycling exercise.
Fig. 7
Fig. 7
Dynamic changes in the (a) cortisol level and (b) power spectral density of the EMG signal monitored over 55 min during a cycling exercise session with consistent workload. (c) Cortisol levels measured during cycling exercise. Here, i, ii, and iii represent time instants of 5 min, 40 min, and 60 min, respectively. (d) Power spectral density of the EMG signal measured during cycling exercise. Here, i, ii, and iii represent time instants of 10 min, 30 min, and 50 min, respectively.

References

    1. Sharma, A., Badea, M., Tiwari, S. & Marty, J. L. Wearable biosensors: An alternative and practical approach in healthcare and disease monitoring. Molecules26, 748 (2021). - PMC - PubMed
    1. Evenson, K. R., Goto, M. M. & Furberg, R. D. Systematic review of the validity and reliability of consumer-wearable activity trackers. Int. J. Behav. Nutr. Phys. Act.12, 159 (2015). - PMC - PubMed
    1. Jeong, J. et al. Materials and optimized designs for human-machine interfaces Via epidermal electronics. Adv. Mater.25, 6839–6846 (2013). - PubMed
    1. Searle, A. & Kirkup, L. A direct comparison of wet, dry and insulating bioelectric recording electrodes. Physiol. Meas.21, 271–283 (2000). - PubMed
    1. Steinhubl, S. R., Muse, E. D. & Topol, E. J. The emerging field of mobile health. Sci Transl Med7 (2015). - PMC - PubMed

Grants and funding

LinkOut - more resources