. 2024 Nov 29;15(1):10413.
doi: 10.1038/s41467-024-54685-1.

Granzyme K+CD8+ T cells interact with fibroblasts to promote neutrophilic inflammation in nasal polyps

Affiliations

Granzyme K+CD8+ T cells interact with fibroblasts to promote neutrophilic inflammation in nasal polyps

Cui-Lian Guo et al. Nat Commun. .

Abstract

Sophisticated interactions between stromal and immune cells play crucial roles in various biological and pathological processes. In chronic rhinosinusitis with nasal polyps (CRSwNP), the upper airway inflammation in many patients is driven by TH2, ILC2, and eosinophils, thus being treated with glucocorticoids and anti-type 2 inflammation biologics. The resistance to these therapies is often associated with neutrophilic inflammation, which has also been widely identified in CRSwNP, but the underlying mechanisms remain unclear. Using single-cell analysis, spatial transcriptomics, and T-cell receptor sequencing, we identify an increased presence of granzyme K+(GZMK+) CD8+ T cells in NPs, which possess a phenotype distinct from the cytotoxic GZMB+ effector CD8+ T subset. GZMK+CD8+ T cells are found to express CXCR4 and interact with CXCL12-secreting fibroblasts, inducing the latter to produce neutrophil chemoattractants in a manner uniquely mediated by GZMK but not other granzymes. This GZMK+CD8+ T cell-fibroblast crosstalk is also observed in other inflammatory diseases. Furthermore, GZMK+CD8+ T cells exhibit a selective expansion of clones that recognize Epstein-Barr virus. Here, we show that GZMK marks a phenotypically distinct subset of effector CD8+ T cells that promote neutrophilic inflammation.


Conflict of interest statement

Competing interests: The authors declare no competing interests.

Figures

Fig. 1
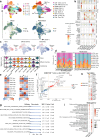
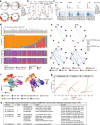
Fig. 1. Distinct immune cell compositions between control participants and CRSwNP patients.
a Schematic diagram of the study design for ScRNA-seq and spatial transcriptomics. Part of this figure was created by figdraw.com. b Uniform manifold approximation and projection (UMAP) plots showing that 208,757 cells recovered from 25 samples (5 control blood samples, 4 control inferior turbinate samples, 8 blood samples from patients with CRSwNP, and 8 nasal polyp samples) are separated into 25 cell clusters (upper left). Clusters are annotated into eight major immune cell types by canonical markers (upper right) and colored by different sampling locations (lower left and right). c Dot plots showing the scaled expression of selected canonical marker genes in indicated cell types. The dot size represents percentage of cells expressing the genes in each cell type. The color represents the scaled gene expression level. d Pie charts displaying the cellular frequencies of the eight major cell types in blood (n = 13 samples) (left) and nasal tissue (n = 12 samples) (right). e, Bar plots showing the compositions of major immune cell types in each sample across different sampling locations in control participants and patients with CRSwNP. f Tissue prevalence of major cell types in the indicated group (13 blood samples (including 5 CBL and 8 NP-BL samples) and 12 nasal tissue samples (including 4 CIT and 8 NP samples)) is estimated by Ro/e score = (observed cell numbers/expected cell numbers). C control, CBL control blood sample, CIT control inferior turbinate sample, FACS fluorescence-activated cell sorting, ILC2 group 2 innate lymphoid cell, NK natural killer cell, NP nasal polyp, NP-BL blood sample from CRSwNP patient, P patient. Source data are provided as a Source Data file.
Fig. 2
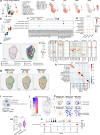
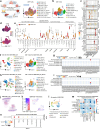
Fig. 2. GZMK+CD8+ T cells are preferentially increased in NPs with a distinct transcriptional program.
a UMAP plots showing that 81,202 CD8+ T cells from 25 samples (5 CBL, 8 NP-BL, 4 CIT, and 8 NP samples) are separated into 16 clusters (upper left). Clusters are annotated into nine major cell types by canonical markers (upper right) and colored by different sampling locations (lower left and right). b Dot plots showing the scaled expression of selected canonical marker genes in the indicated cell types. c Feature plots and violin plots illustrating expression of naive, effector memory and cytotoxicity curated gene signatures across CD8+ T cell clusters. d Bar plots showing the compositions of major cell types in each sample across different sampling locations in control participants and patients with CRSwNP. e Tissue prevalence of major cell types in the indicated group (13 blood samples (including 5 CBL and 8 NP-BL samples) and 12 nasal tissue samples (including 4 CIT and 8 NP samples)) is estimated by Ro/e score. f Scatter-plot shows differentially expressed genes (DEGs) between GZMK+CD8+ T cells and other CD8+ T cells. Two-sided Wilcoxon rank-sum tests with Bonferroni correction. Genes with |log2(fold change) | > 0.5 and adjusted P < 0.05 were considered significant. NS, no significant difference; P adj, adjusted P value; Δ percent of cells, the difference in the percentage of cells expressing the gene comparing GZMK+CD8+ T versus all other CD8+ T cells. g Gene set enrichment analysis (GSEA) showing significantly differentially upregulated pathways in GZMK+CD8+ T cells compared to other CD8+ T cells. Two-sided permutation test with Benjamini-Hochberg adjustments was used for GSEA analysis. Normalized enrichment score (NES) > 1 and adjusted P < 0.05 was considered significant. h Violin plots displaying top10 differentially expressed genes (DEGs) among GZMK+CD8+ T and GZMB+CD8+ T cells in NPs. Two-sided Wilcoxon rank-sum tests with Bonferroni correction. Genes with |log2(fold change) | > 0.5 and adjusted P < 0.05 were considered significant. i, Kyoto Encyclopedia of Genes and Genomes (KEGG) pathway analysis of DEGs that enriched in indicated CD8+ T clusters. Two-sided Fisher’s Exact test with Benjamini-Hochberg adjustments was used for KEGG analysis. Adjusted P < 0.05 was considered significant. CBL control blood sample, CD8+ Tpex, CD8+ progenitor exhausted cells, CIT control inferior turbinate sample, MAIT mucosal associated invariant T cell, NP nasal polyp, NP-BL blood sample from CRSwNP patient, TRM tissue-resident memory T cell. Source data are provided as a Source Data file.
Fig. 3
Fig. 3. GZMK+CD8+ T cells are the primary cellular source of GZMK in nasal polyps.
a The UMAP depicting the expression pattern of GZMK in CD45+ lymphocytes in 25 samples (5 CBL, 8 NP-BL, 4 CIT, and 8 NP samples) of our dataset. b The doughnut chart showing the composition of GZMK expressing cells in our dataset. c The UMAP depicting the expression pattern of GZMK in all CD8+ T cells from our dataset. d Violin plot showing the expression levels of GZMK in the indicated cell types. e The doughnut chart showing the composition of GZMK expressing CD8+ T cells in different sample groups in our dataset. Representative flow cytometry plots (f) and cumulative data (g) showing GZMK and GZMB expression among CD8+ T cells from indicated groups (22 CBL, 27 NP-BL, 14 CIT, and 30 NP samples). Data are presented as median with interquartile ranges; Two-sided Kruskal-Wallis with Dunn’s multiple comparisons test. h Dot plot displaying the expression of selected cell surface markers and transcription factors in GZMK+CD8+ T and GZMB+CD8+ T cells from NPs. i, j Flow cytometry showing mean fluorescence intensity (MFI) of CXCR4, PD-1, EOMES, and T-bet protein levels in GZMK+CD8+ T and GZMB+CD8+ T cells from NPs (n = 17 samples). Two-sided paired t test. k, l Representative immunofluorescence staining of GZMK (green) and CD8 (red) colocalization in control inferior turbinate tissues (CIT, left) and NP samples (NP, right) (k). Quantified results of GZMK and CD8 double-positive cells in the indicated group (17 CIT and 57 NP samples) (l). Scale bar: 40 μm. HPF high power field. Data are presented as median with interquartile ranges; Two-sided unpaired Wilcoxon test. m, n Representative immunofluorescence staining of GZMB (green) and CD8 (red) colocalization in CIT (left) and NP samples (right) (m). Quantified results of GZMB and CD8 double-positive cells in the indicated group (10 CIT and 10 NP samples) (n). Scale bar: 40 μm. HPF high power field. Data are presented as median with interquartile ranges; Two-sided unpaired Wilcoxon test. CBL control blood sample, CD8+ Tpex, CD8+ progenitor exhausted cells, CIT control inferior turbinate sample, MAIT mucosal associated invariant T cell, NP nasal polyp, NP-BL blood sample from CRSwNP patient, Source data are provided as a Source Data file.
Fig. 4
Fig. 4. Interaction and co-localization of GZMK+CD8+ T cells and fibroblasts in NPs revealed by ligand-receptor analysis and spatial transcriptomics (Visium).
a–d Re-analyzing T and NK cells in a public scRNA-seq dataset (HRA000772) (n = 21) (a). Proportions of CD8T_GZMK in CD8+ T cells in the indicated group (5 controls, 5 CRSsNP, 5 NE-NP, and 6 E-NP samples). Box plots show median, quantiles, minimum and maximum. Two-sided Kruskal-Wallis with Dunn’s multiple comparisons test (b). Dot plots showing interactions between chemokine ligands (in structural cells) and receptors (in CD8T_GZMK). P values are computed from one-sided permutation test (default for CellChat r-package). Dot size represents P value. The color represents communication possibility (c). CXCL12 expression in the indicated cell types in four groups (d). e Hematoxylin and eosin (HE) staining of the tissue section from the representative CRSwNP patient #9 (NP9) (left). Unbiased clustering of spatial transcriptomics (ST) spots and annotated cell types of each cluster (right). f Dot plots showing scaled expression of typical markers in indicated cell clusters. g Spatial feature plots of signature scores of GZMK+CD8+ T cells, fibroblasts, and epithelial cells in NP9. h Neighborhood enrichment analysis between cell clusters in NP9. The “GZMK+CD8+ T cells” and “fibroblasts” show a positive enrichment score. i Schematic diagram displaying the Intra-spots (GZMK+CD8+ T cell/fibroblast-colocalized spots), Inter-spots (GZMK+CD8+ T cell/fibroblast-surrounded spots) and others (distant spots). j Co-expression pattern of GZMK+CD8+ T cells and fibroblasts in NP9 section. k, l Spatial feature plots showing GZMK+CD8+ T cells/fibroblasts-colocalized or surrounded spots in NP9 section. m GZMK+CD8+ T signature scores in fibroblasts that in close contact or distant from GZMK+CD8+ T cells (NP9 section: 57 fibroblasts-distant spots and 144 fibroblasts-close spots). Box plots show median, quantiles, minimum and maximum. Two-sided unpaired Wilcoxon test. n Ligand-receptor interactions of CXCL12-CXCR4 from the structural cells to GZMK+CD8+ T cells. Means, the means of the average expression level of both interacting ligands (in other cell types) and corresponding receptors (in GZMK+CD8+ T). P values result from a one-sided permutation-based test with 1000 permutations and were adjusted with the Benjamini-Hochberg method. CRSsNP chronic rhinosinusitis without nasal polyps, ECs endothelial cells, E-NP eosinophilic nasal polyp, EPs epithelial cells, ILC innate lymphoid cell, NE-NP non-eosinophilic nasal polyp, NK natural killer cell, pDCs plasmacytoid dendritic cells, SMCs smooth muscle cells. Source data are provided as a Source Data file.
Fig. 5
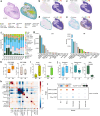
Fig. 5. Spatial proximity between GZMK+CD8+ T cells and fibroblasts revealed by Visium HD.
a HE staining of the nasal polyp specimen from a representative CRSwNP patient (HD_NP4) in Visium HD (left). Cellular annotation of each 16 × 16 µm bin in the tissue specimen by deconvolution using the public ScRNA-seq dataset (right). b Spatial distribution of CD8T_GZMK (left) and GZMK expression (right) in the HD_NP4 sample. c Spatial distribution of CD8T_GZMB (left) and GZMB expression (right) in the HD_NP4 sample. d Spatial distribution of epithelial cells (left) and KRT19 expression (right) in the HD_NP4 sample. e Spatial distribution of fibroblasts (left) and FBLN1 expression (right) in the HD_NP4 sample. f Bar plots showing the cell type composition in each sample from control participants and patients with CRSwNP. g Bar plots showing the total counts of each cell type in CIT (left, n = 4 samples) and NP (right, n = 6 samples) groups. h, i, j Proportions of CD8T_GZMK and CD8T_GZMB in CD8+ T cells in nasal tissue samples in the indicated group (4 CIT and 6 NP samples) (h). Proportions of the major immune cells (B cells and CD4T cells) detected in the indicated group (4 CIT and 6 NP samples) (i). Proportions of the major structural cells (fibroblasts, epithelial cells, and SMCs) detected in the indicated group (4 CIT and 6 NP samples) (j). In (hj), Box plots show median, quantiles, minimum and maximum. Two-sided unpaired Wilcoxon test. k Neighborhood enrichment analysis between cell types in spatial coordinates. The “CD8T_GZMK” and “fibroblasts” show a positive enrichment score. l Dot plots showing interactions between chemokine ligands (in structural cells) and receptors (in CD8+ T subsets). P values are computed from one-sided permutation test (default for CellChat r-package). Dot size represents P value. The color represents the communication possibility between CD8+ T subsets and structural cells. CIT control inferior turbinate sample, ECs endothelial cells, ILC innate lymphoid cell, NK natural killer cell, NP nasal polyp, pDCs plasmacytoid dendritic cells, SMCs smooth muscle cells. Source data are provided as a Source Data file.
Fig. 6
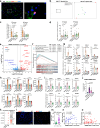
Fig. 6. Interaction between GZMK+CD8+ T cells and fibroblasts contributes to neutrophilic inflammation in nasal polyps.
a Representative immunofluorescence staining of collagen I (COL1A1, green), CD8 (red), and GZMK (yellow) in NPs. The right image shows a greater magnification of the outlined area. b Spatial distribution analysis of GZMK+CD8+ T and COL1A1+ cells in the same tissue field demonstrated in (a) using HALO software. c–d The number of COL1A1+ fibroblasts within a radius of 25 μm from the nuclear center of GZMK+CD8+ T, GZMB+CD8+ T, CD4+ T, or CD19+ B cells in CIT group (left, n = 10 samples) and NP group (right, n = 10 samples) (c). Average distance from the indicated cell types to the closest COL1A1+ fibroblasts in CIT group (left, n = 10 samples) and NP group (right, n = 10 samples) (d). e DEGs between NP-derived primary fibroblasts (NPDF) treated with and without recombinant human GZMK (n = 4). Two-sided Wald test (default for DESeq2 r-package) was used for differential expression analysis utilizing standard cutoffs of |log2(fold change) | >1 and P value < 0.05. f GSEA plots showing signaling pathways enriched in the GZMK stimulated NPDF. Two-sided permutation test with Benjamini-Hochberg adjustments was used for GSEA analysis. Normalized enrichment score (NES) > 1 and adjusted P < 0.05 was considered significant. g Expression levels of selected genes in NPDF stimulated with GZMK, GZMA or GZMB (n = 7 biological replicates). h Protein levels of chemokines and cytokines secreted by NPDF stimulated with GZMK, GZMA, or GZMB (n = 10 biological replicates). i Gene expression levels in NPDF cultured with supernatants of NP-derived and activated CD4+ T or CD8+ T cells (n = 8 biological replicates). j Migration of GZMK+CD8+ T cells towards NPDF in the presence or absence of CXCL12 neutraligand LIT-927 (n = 7 biological replicates). Data are presented as mean with standard deviation; two-sided paired t test. k Expression of neutrophil chemokines and inflammatory marker in fibroblasts from the indicated group (5 controls, 5 CRSsNP, and 11 NP samples) in a public dataset (HRA000772). l Representative immunofluorescence staining of myeloperoxidase (MPO, red) positive cells in CIT and NP. Scale bar: 40 μm. m Quantification of MPO+ cells in the indicated group (17 CIT and 34 NP samples). Data are presented as median with interquartile ranges; Two-sided unpaired Wilcoxon test. Spearman correlation between GZMK+CD8+ T cells and MPO+ neutrophil counts (n = 34 samples) (n) or eosinophil counts in NP (n = 57 samples) (o). Two-sided Spearman’s rank correlations test. For (c, d), and (g–i), data are presented as median with interquartile ranges; Two-sided Friedman test with Dunn’s multiple comparisons test. CIT control inferior turbinate sample, NP nasal polyp. Source data are provided as a Source Data file.
Fig. 7
Fig. 7. Clonal relationships and developmental trajectory of CD8+ T cells.
a The doughnut charts showing the distribution of the clonal status of CD8+ T cells across four groups (5 CBL, 8 NP-BL, 4 CIT, and 8 NP samples) in our dataset. b The index scores of the abundance-based coverage estimator (ACE), Chao1 richness estimator (Chao), inverse Simpson index (Inv.Simpson), inverse Pielou evenness index (Inv.Pielou), and Shannon entropy of CD8+ T cells across four groups (5 CBL, 8 NP-BL, 4 CIT, and 8 NP samples). Box plots show median, quantiles, minimum and maximum. Two-sided Kruskal-Wallis with Dunn’s multiple comparisons test. c Cell counts of CD8+ T cell subsets across four groups (up); The distribution of clone status in CD8+ T cell subsets across four groups (down) (5 CBL, 8 NP-BL, 4 CIT, and 8 NP samples). d Top 100 clonal types relative to GZMK+CD8+ T cells in different tissues, showing from top to bottom: cell counts of GZMK+CD8+ T cell in each clonotype, the cell composition of each clonotype, the total cell distribution and GZMK+CD8+T cell distribution of each clonotype across different sample types. e Single T cell analysis by RNA sequencing and TCR tracking (STARTRAC) analysis estimating the clonal expansion (STARTRAC-expa) and state transition (STARTRAC-tran) of CD8+ T cell clusters across four groups (5 CBL, 8 NP-BL, 4 CIT, and 8 NP samples). f Pseudotime and developmental trajectory of CD8+ T cells inferred by Monocle 3 on UMAP plot. g Two-dimensional plots displaying expression scores for three typical gene signatures in cells of paths 1 (brown), path 2 (yellow) and path 3 (red), along the Pseudotime, respectively. h Potential antigens imputed from the top 10 clonotypes of GZMK+CD8+ T cells from NPs in TCRmatch. According to the instructions of TCRmatch, score >0.97 were considered as reliable. CBL control blood sample, CD8+ Tpex CD8+ progenitor exhausted cells, CIT control inferior turbinate sample, MAIT mucosal associated invariant T cell, NP nasal polyp, NP-BL blood sample from CRSwNP patient. Source data are provided as a Source Data file.
Fig. 8
Fig. 8. The expansion of GZMK+CD8+ T cells in chronic inflammatory diseases and interaction with fibroblasts via CXCR4-CXCL12 axis.
a Schematic depicting the unbiased integration of 108,969 CD8+ T cells from 159 samples in 9 public ScRNA-seq datasets of healthy controls (HC) and diseased samples from atopic dermatitis (AD), eosinophilic esophagitis (EoE), allergic asthma, chronic obstructive pulmonary diseases (COPD), cystitis glandularis (CG), lupus erythematosus (LE), thyroiditis, sepsis, and hepatitis B virus (HBV) infection. Part of this figure was created by figdraw.com. CD8+ T subsets (b), the scaled expression of selected canonical markers (c) and expression of GZMK and GZMB (d) in the integrative dataset. e The percentage of GZMK+CD8+ T and GZMB+CD8+ T in the indicated group (sample size in each group is provided in (e) and in the Supplementary Table 18). Box plots show median, quantiles, minimum and maximum. Two-sided unpaired Wilcoxon test. AC allergic controls, Ag allergen challenge, Bln baseline, Dli administration of diluent, DLE discoid lupus erythematosus, HT Hashimoto’s thyroiditis, IRAE immune-related adverse events-thyroiditis, PN prurigo nodularis, SLE systemic lupus erythematosus, Sepsis_NS non-survivor of gram-negative sepsis, Sepsis_S survivor of gram-negative sepsis. f Total cells (left) and CD8+ T cells (right) from the GSE175930_EoE dataset. g Interactions of chemokine ligands (in structural cells) and receptors (in GZMK+CD8+ T) in the GSE175930_EoE dataset. P values are computed from one-sided permutation test (default for CellChat r-package). Dot size represents P value. The color represents communication possibility. h Total cells (left) and CD8+ T cells (right) from the GSE179633_LE_Dermis dataset. i Interactions of chemokine ligands (in structural cells) and receptors (in GZMK+CD8+ T) in the GSE179633_LE_Dermis dataset. P values are computed from one-sided permutation test (default for CellChat r-package). j Representative HE staining of the lesional skin (LS) section of AD from the GSE197023 dataset. AD_7, sample 7 of the AD group. k Co-expression pattern of GZMK+CD8+ T and fibroblasts in AD_7_LS section. l Total spots generated from all samples (n = 18 samples) of the GSE197023 dataset. m Neighborhood enrichment analysis between cell clusters in the LS group (n = 7 samples) of AD in the GSE197023 dataset. The “GZMK+CD8+ T cells” and “Fibroblasts/leukocyte infiltration (FB/Leu)” show a positive enrichment score. n Ligand-receptor interactions of CXCL12-CXCR4 from the structural cells to GZMK+CD8+ T cells in the LS group (n = 7 samples) of AD in the GSE197023 dataset. P values result from a one-sided permutation-based test with 1000 permutations and were adjusted with the Benjamini-Hochberg method. ECM extracellular matrix, MAIT mucosal associated invariant T cell, SMCs smooth muscle cells. Source data are provided as a Source Data file.

References

    1. Fokkens, W. J. et al. European position paper on rhinosinusitis and nasal polyps 2020. Rhinology58, 1–464 (2020). - PubMed
    1. Bachert, C. et al. Endotypes of chronic rhinosinusitis with nasal polyps: Pathology and possible therapeutic implications. J. Allergy Clin. Immunol. Pract.8, 1514–1519 (2020). - PubMed
    1. Bachert, C. et al. Biologics for chronic rhinosinusitis with nasal polyps. J. Allergy Clin. Immunol.145, 725–739 (2020). - PubMed
    1. Calus, L. et al. Twelve-year follow-up study after endoscopic sinus surgery in patients with chronic rhinosinusitis with nasal polyposis. Clin. Transl. Allergy9, 30 (2019). - PMC - PubMed
    1. Han, J. K. et al. Mepolizumab for chronic rhinosinusitis with nasal polyps (SYNAPSE): A randomised, double-blind, placebo-controlled, phase 3 trial. Lancet Respir. Med.9, 1141–1153 (2021). - PubMed

Publication types

MeSH terms

LinkOut - more resources