. 2024 Nov 29;15(1):10417.
doi: 10.1038/s41467-024-54806-w.

Broadly conserved FlgV controls flagellar assembly and Borrelia burgdorferi dissemination in mice

Affiliations

Broadly conserved FlgV controls flagellar assembly and Borrelia burgdorferi dissemination in mice

Maxime Zamba-Campero et al. Nat Commun. .

Abstract

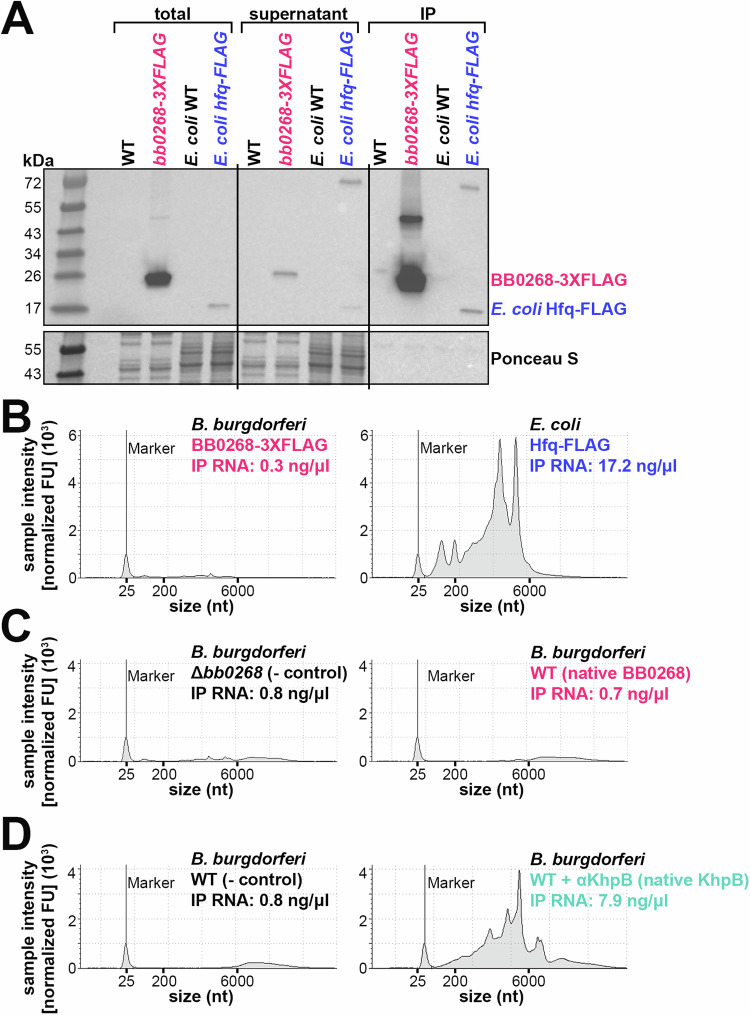
Flagella propel pathogens through their environments, yet are expensive to synthesize and are immunogenic. Thus, complex hierarchical regulatory networks control flagellar gene expression. Spirochetes are highly motile bacteria, but peculiarly, the archetypal flagellar regulator σ28 is absent in the Lyme spirochete Borrelia burgdorferi. Here, we show that gene bb0268 (flgV) in B. burgdorferi, previously and incorrectly annotated to encode the RNA-binding protein Hfq, is instead a structural flagellar component that modulates flagellar assembly. The flgV gene is broadly conserved in the flagellar superoperon alongside σ28 in many Spirochaetae, Firmicutes and other phyla, with distant homologs in Epsilonproteobacteria. We find that B. burgdorferi FlgV is localized within flagellar basal bodies, and strains lacking flgV produce fewer and shorter flagellar filaments and are defective in cell division and motility. During the enzootic cycle, flgV-deficient B. burgdorferi survive and replicate in Ixodes ticks but are attenuated for infection and dissemination in mice. Our work defines infection timepoints when spirochete motility is most crucial and implicates FlgV as a broadly distributed structural flagellar component that modulates flagellar assembly.


Conflict of interest statement

Competing interests: The authors declare no competing interests.

Figures

Fig. 1
Fig. 1. BB0268 does not bind RNA.
A Immunoblot analysis of immunoprecipitated B. burgdorferi BB0268-3XFLAG (PA007) or E. coli Hfq-FLAG (EC153) samples. The parent WT strains (PA003 and EC152, respectively) were used as controls. B. burgdorferi cells were grown to 1 × 108 cells/ml and E. coli cells were grown to an OD600 = 1.0 and then exposed to UV to crosslink any RNAs associated with the proteins. After cell lysis, the tagged proteins were immunoprecipitated (IP) and RNA was isolated from the IP samples. Equal volumes of cell lysis (total), supernatant of the α-FLAG-beads during washing, and elution from the α-FLAG-beads (IP) were separated on a Tris-Glycine gel, transferred to a membrane, stained with Ponceau S, and probed using ɑ-FLAG antibodies. Size markers are indicated. B Quantification of α-FLAG immunoprecipitated RNA. Each sample (2 µl) was analyzed using an Agilent 4200 TapeStation System and the RNA high sensitivity reagents. C Quantification of α-BB0268 immunoprecipitated RNA, as in panel (B). D Quantification of α-KhpB immunoprecipitated RNA, as in panel (B). Panels A and B are a representative experiment from three independent experimental replicates, also including lysates from stationary phase B. burgdorferi. All replicates showed the same results.
Fig. 2
Fig. 2. bb0268 (flgV) is broadly conserved with flagellar genes and σ28 in bacteria.
Examples of the flagellar superoperons from diverse bacterial lineages mentioned in the text are depicted, centered on the gene encoding FlgV, marked with a dashed box. The genes are shown as box arrows (only drawn to approximate size) and labeled with the domain architectures of the encoded proteins. The genes belonging to distinct genetic/functional submodules are distinguished using different colors. Each operon is labeled, below the box arrows, based on the GenBank accession of the anchor flgV gene and the species name. The encoded protein names from model systems are shown above the first row, and the corresponding Borrelia (Borreliella) gene names are listed below the operon from that organism. The versions are labeled as Type-1, -2, and -3 based on the type of FlgV encoded in the operon. All versions are Type-1 except the last two exemplars. The Turneriella parva superoperon is fragmented into more than one gene cluster, and the one containing flgV ends with that gene.
Fig. 3
Fig. 3. FlgV levels impact B. burgdorferi cell division and motility.
A Immunoblot analysis of FlgV levels in WT, flgV deletion and flgV complementation strains. WT/pind (PA273), ΔflgV/pind (PA310), and ΔflgV/pind+flgV (PA312) were grown with 0.1 mM IPTG, after dilution of the starter culture, to an average density of ~1.1 × 107 cells/ml (log) and ~2.3 × 108 cells/ml (stationary) and total protein was isolated. ΔflgV/pind (PA310) samples were collected 9 h after the WT/pind (PA273) and ΔflgV/pind+flgV (PA312) samples, so that all cultures were collected at the same cell density. Protein extracts were separated on a Tris-Glycine gel, transferred to a membrane, stained with Ponceau S as a loading control, and probed with α-FlgV antibodies. Panel A was cropped to remove B. burgdorferi samples expressing E. coli Hfq. All samples are depicted in Fig. S4E. Size markers are indicated. B Immunoblot analysis of FlgV levels in WT and flgV overexpression strains. WT/p (PA023) and WT/pcon ++flgV (PA267) were grown to an average density of ~2.6 × 107 cells/ml (log) and ~1.8 × 108 cells/ml (stationary) and total protein isolated. WT/pcon ++flgV (PA267) samples were collected 6 h after the WT/p (PA023) sample, so that all cultures were collected at the same cell density. A dimer is detected with high levels of FlgV. Immunoblot was conducted as in panel (A). C Growth curve of B. burgdorferi expressing different levels of FlgV. Cell growth was monitored by dark field microscopy enumeration at the indicated time points, after dilution of the starter culture to 1 × 105 cells/ml. Each data point (circles) represents the mean of three biological replicates with the standard deviation. Dark field microscopy images of representative D WT/pind (PA273), E ΔflgV/pind (PA310), F ΔflgV/pind+flgV (PA312), G WT/p (PA023), and H WT/pcon ++flgV (PA267). All cultures were grown to an average density of ~2.1 × 107 cells/ml, washed with 1X PBS and imaged. For WT/pind, ΔflgV/pind, and ΔflgV/pind+flgV, 0.1 mM IPTG was added at the subculture. White arrow indicates septa. Scale bar on panel D applies to panels (DH). I Quantification of spirochete length, for the strains in panels (DH); n = 100. Cells were traced using the curve (spline) tool with ZEN 3.4 (blue edition) software. Each data point (circles) represents the length of one spirochete; the line corresponds to the mean length for each strain. Average length across WT/pind, ΔflgV/pind, and ΔflgV/pind+flgV samples or WT/p and WT/pcon ++flgV were compared by one-way ANOVA with Tukey’s multiple comparisons test or two-tailed t test, respectively, GraphPad Prism 9.5.1 (n.s., not significant). J Motility assay of B. burgdorferi expressing different levels of FlgV. Representative plates of each strain were photographed 9 d after inoculating into a BSKII 0.35% agarose plate. Scale bar on first plate applies to all plates. K Quantification of spirochete motility, for the strains in panel J. Each data point (circles; n = 10) represents the motility ring size (distance spirochetes spread from the inoculation site) for one sample; the line corresponds to the mean motility ring size for each strain. The statistical analysis was performed as reported for panel (I).
Fig. 4
Fig. 4. FlgV is localized to the flagellar basal body.
A Immunoblot analysis of B. burgdorferi total protein lysate fractionated into soluble and membrane samples. WT B. burgdorferi (PA001) were grown to a density of ~2.2x10⁷ cells/ml and then lysed by sonication, total protein was isolated, and the samples were fractioned by ultracentrifugation. Protein extracts were separated on a Tris-Glycine gel, transferred to a membrane, stained with Ponceau S as a loading control, and probed with α-FlgV, α-OspC, and α-SodA antibodies. Proteins were probed sequentially on the same membrane; size markers are indicated. B Localization of FlgV-GFP by confocal microscopy. B. burgdorferi (PA402) were grown to a density of ~2.0x10⁷ cells/ml, prior to imaging. Left panels: Bright field and fluorescence composite (left micrograph) and fluorescence-only (right micrograph) are shown. Scale bar on left micrograph also applies to right micrograph. Right panel: Demograph of the GFP profile for 300 spirochetes, cells were positioned in order of increasing length. C Reconstructed cryo-ET central (side-view) cross section of WT/p (PA023) B. burgdorferi flagellar basal body (left) with overlaid cartoon model of the flagellar basal body (right). The inner membrane (IM, green), export apparatus (blue), C ring (light blue), MS ring (green), rod (lavender), hook (light purple) and FlgV (dark pink) are labeled. Reconstructed central (side-view) and bottom-view cryo-ET cross sections of D WT/p (PA023; repeated from panel C), E ΔflgV/pind (PA310), F ΔflgV/pind+flgV (PA312), G WT flgV-gfp (PA402), and H WT/pcon ++flgV (PA267) B. burgdorferi. All cultures were grown to an average density of ~3.6 × 107 cells/ml, washed with 1X PBS, mixed with 10 nm gold particles, deposited on glow-discharged grids and imaged. Tomographs were generated, aligned and reconstructed for each strain. Densities predicted to correlate with FlgV (pink arrow) and FlgV-GFP (green arrow) are indicated. Scale bar on panel D applies to panels D–H.
Fig. 5
Fig. 5. FlgV levels impact the assembly of flagellar filaments.
Surface-view cryo-ET micrograph of representative central periplasmic cell sections of A WT/p (PA023), B ΔflgV/pind (PA310), C ΔflgV/pind+flgV (PA312), and D WT/pcon + +flgV (PA267) B. burgdorferi. All cultures were grown to an average density of ~3.6 × 10⁷ cells/ml, washed with 1X PBS, mixed with 10 nm gold particles, deposited on glow-discharged grids, and imaged. Scale bar on panel A applies to panels (AD). EH Projection images of a representative cell pole for each strain, described in panels A–D. The outer membrane (blue), inner membrane (green), flagellar basal bodies (red) and flagellar hooks and filaments (pink), were manually segmented in IMOD and are indicated. Scale bar on panel E applies to panels E–H. See Supplementary Movies 1-4. I–J Quantification of flagellar basal bodies and filaments. Individual spirochetes were tallied for number of basal bodies and filaments at one cell pole. Each data point (circles) represents one spirochete (n = 18-21); the line corresponds to the mean number of flagellar basal bodies or filaments for each strain. Panels I and J were independent experiments; panel I: 0.1 mM IPTG was added at the subculture and WT/pind (PA273), ΔflgV/pind (PA310), and ΔflgV/pind+flgV (PA312) cultures were grown to an average density of 3.8 × 10⁶ cells/ml; panel J: WT/p (PA023) and WT/pcon + +flgV (PA267) were grown to an average density of 2.3 × 10⁷ cells/ml. Average flagellar basal bodies and filament numbers per sample were compared by one-way ANOVA with Tukey’s multiple comparisons test, GraphPad Prism 9.5.1. K Immunoblot analysis of flagellar structural proteins when FlgV is overexpressed. The membrane from Fig. 3B was stripped and reprobed with α-FlaB, α-FlgG and α-FliF antibodies. The FlgV panel was repeated from Fig. 3B; the Ponceau S panel is the same as Fig. 3B, but shows a different region; size markers are indicated. The fold change (FlgV overexpression compared to WT) of specific bands was calculated by densitometry analysis: FlaB, log: 1.2 fold decrease; FlgG, log: 1.2 fold decrease; FliF, log: 1.0 fold decrease; FlgV, log: 2.7 fold increase; and FlaB, stationary: 1.3 fold decrease; FlgG, stationary: 1.3 fold decrease; FliF, stationary 1.1 fold decrease; FlgV, stationary: 1.9 fold increase (Image J 1.53t; normalized to the nonspecific band detected with the α-FlgG antibody). A second independent immunoblot was performed (Fig. S8C). L Northern analysis of flaB levels. Total RNA was isolated from a portion of the same cultures used in panel K. RNA was separated on an agarose gel, transferred to a membrane and probed for flaB. The membrane was stripped and probed for 5S as a loading control; size markers are indicated.
Fig. 6
Fig. 6. flgV is not important for B. burgdorferi replication or survival in Ixodes ticks.
A Schematic of artificial tick infection by immersion used for tick-mouse infection study. Naïve, unfed larvae were desiccated and submerged in BSKII containing WT/p (PA023), ΔflgV/p (PA257), or WT/pcon ++flgV (PA267) B. burgdorferi. Ticks were assayed for infectivity at each life-stage: B unfed larvae, C fed larvae, D unfed nymphs, and E fed nymphs. Ticks were surface sterilized, crushed and plated in solid BSKII containing RPA cocktail and gentamycin. Data points (circles) represent the number of colony-forming units (CFUs) for infected ticks. For unfed larvae (panel B), 3 groups of 10 unfed larvae from each strain were assayed for infectivity; one plate of the ΔflgV/p sample was contaminated and not able to be counted. Ticks from all other life-stages (panels CE), were assayed individually for infectivity; the number of individual infected ticks over the number of individual crushed ticks is listed below the x-axis. The average numbers of B. burgdorferi per tick, for each tick life-stage, were compared by one-way ANOVA with Tukey’s multiple comparisons test, GraphPad Prism 9.5.1; no significant difference was observed for any tick life-stage. F Reisolation of B. burgdorferi from mouse tissues after larval tick feeding. 3 mice per group were assessed for infection 3 weeks post larval tick-feeding. Ear, heart, bladder and joint tissues were collected and analyzed for spirochete reisolation in BSKII by dark-field microscopy enumeration. Average numbers of larval ticks collected per mouse are indicated.
Fig. 7
Fig. 7. flgV is important for timely and productive dissemination in mice.
A Schematic of mouse-B. burgdorferi infection kinetics by intradermal needle inoculation. Mice (n = 6) were infected intradermally with 1 × 104 WT (PA001) or ΔflgV (PA251) B. burgdorferi. After the indicated times, the B skin inoculation site, C blood, and D distal tissues were assessed for spirochete infectivity and burden. In a separate experiment, mice were infected intradermally with 1 × 104 WT/p (PA023) or WT/pcon ++flgV (PA267) B. burgdorferi. After the indicated times, the E skin inoculation site, F blood, and G distal tissues assessed for the presence of spirochetes. For panels B–G: Each data point (circles) represents one mouse; samples with no detectable spirochetes are indicated by a data point on the dotted line (N.D. = not detected). The mean for each strain is indicated by a line, only detected data were used to calculate the mean. For quantitative-PCR analysis, DNA was extracted from tissues and B. burgdorferi load was measured by quantifying B. burgdorferi flaB copies normalized to 106 mouse nid copies, in technical triplicate for each sample. For bacteremia analysis, blood was collected, diluted in BSKII and plated. For tissue reisolation, skin inoculation site, ear, heart, and joint tissues were collected, submerged in BSKII and enumerated by dark-field microscopy. The calculated means between WT versus ΔflgV or WT/p versus WT/pcon ++flgV for each tissue/blood at a given timepoint were compared by a one-tailed, unpaired t test; for all statistical analyses N.D. data points were included as zero; GraphPad Prism 9.5.1; (n.s., not significant).

Update of

References

    1. Wolgemuth, C. W., Charon, N. W., Goldstein, S. F. & Goldstein, R. E. The flagellar cytoskeleton of the spirochetes. J. Mol. Microbiol Biotechnol.11, 221–227 (2006). - PubMed
    1. Yang, D. C., Blair, K. M. & Salama, N. R. Staying in Shape: the Impact of Cell Shape on Bacterial Survival in Diverse Environments. Microbiol Mol. Biol. Rev.80, 187–203 (2016). - PMC - PubMed
    1. Popp, P. F. & Erhardt, M. With or without you: crosstalk between cell division and flagellum assembly. Dev. Cell56, 573–574 (2021). - PubMed
    1. Wolgemuth, C. W. Flagellar motility of the pathogenic spirochetes. Semin Cell Dev. Biol.46, 104–112 (2015). - PMC - PubMed
    1. San Martin, F., Fule, L., Iraola, G., Buschiazzo, A. & Picardeau, M. Diving into the complexity of the spirochetal endoflagellum. Trends Microbiol31, 294–307 (2023). - PubMed

Publication types

Substances

LinkOut - more resources