

Global, regional, and national pancreatitis burden and health inequality of pancreatitis from 1990 to 2019 with a prediction from 2020 to 2034
- PMID: 39614245
- PMCID: PMC11606095
- DOI: 10.1186/s12889-024-20796-z
Global, regional, and national pancreatitis burden and health inequality of pancreatitis from 1990 to 2019 with a prediction from 2020 to 2034
Abstract
Background: Pancreatitis is a digestive system disease that imposes a significant burden on society. However, there is a lack of comprehensive research on the incidence, prevalence, mortality, years of life lost (YLLs), years lived with disability (YLDs), and disability-adjusted life years (DALYs) of pancreatitis, as well as on health inequalities and future trends.
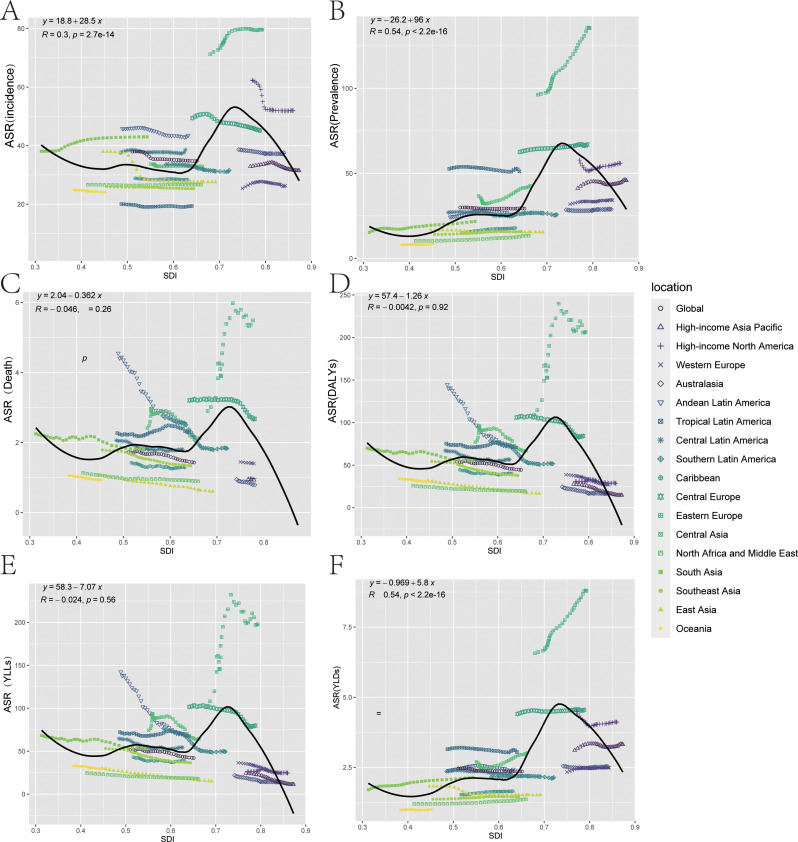
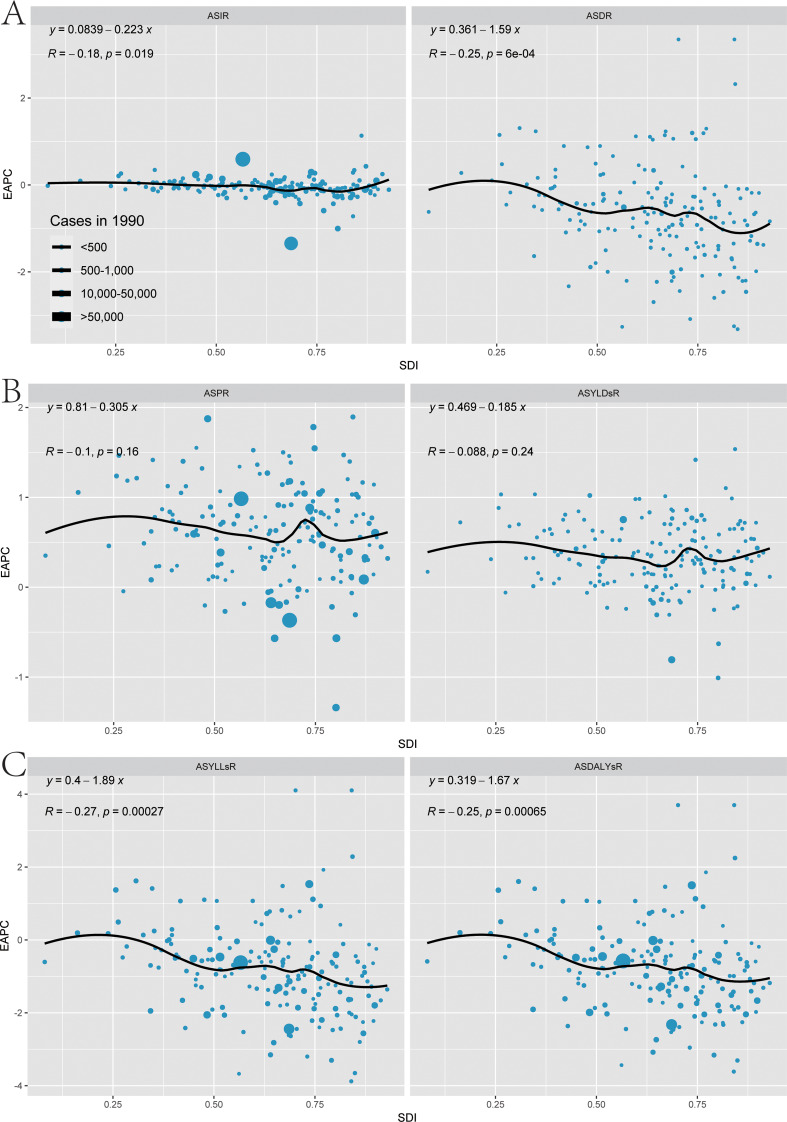
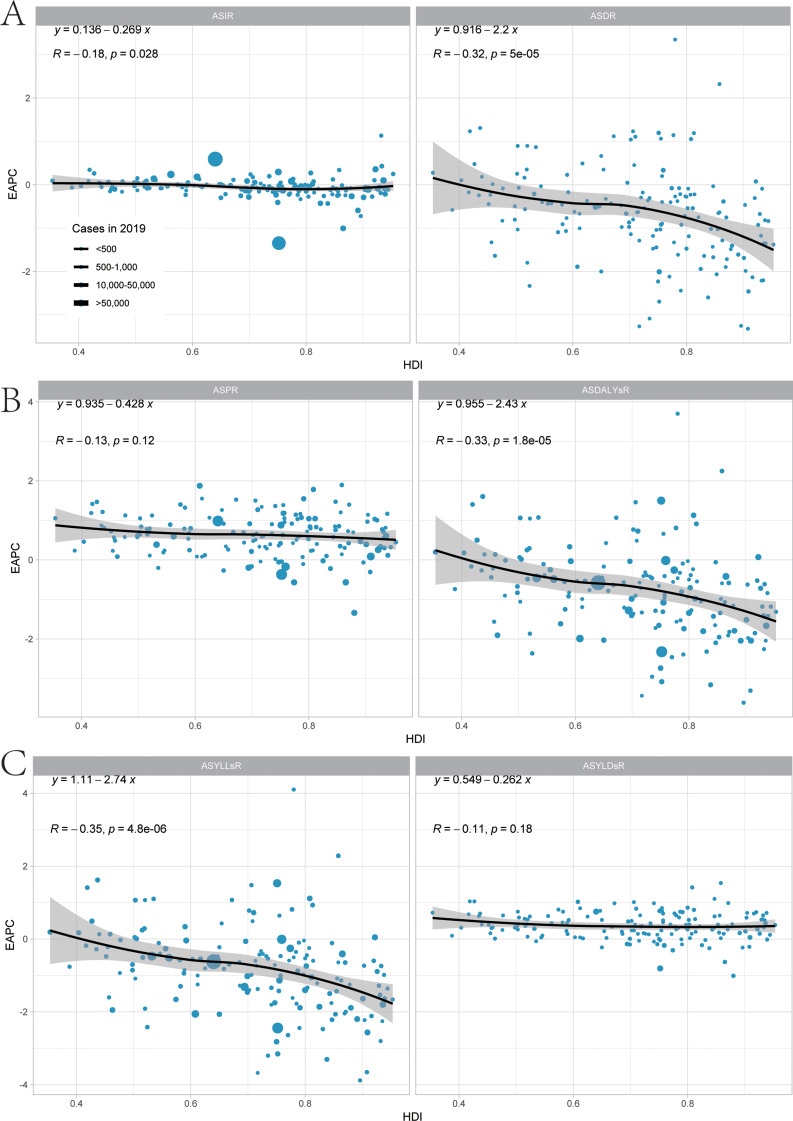
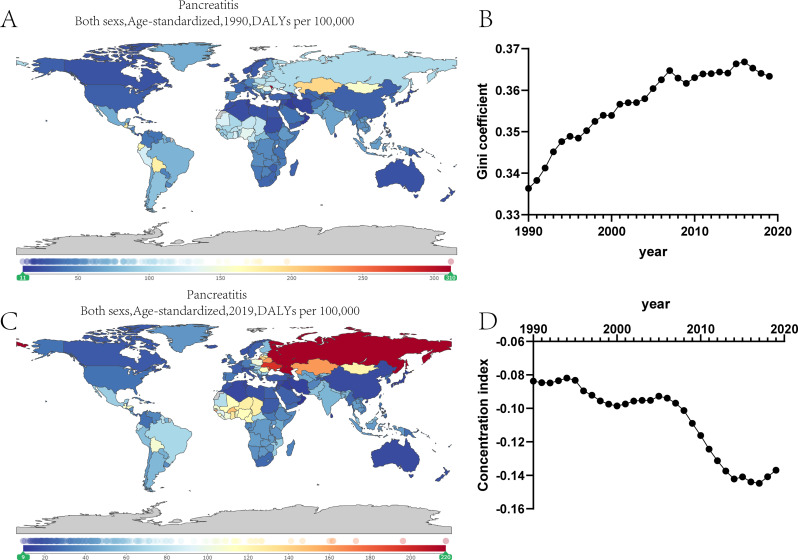
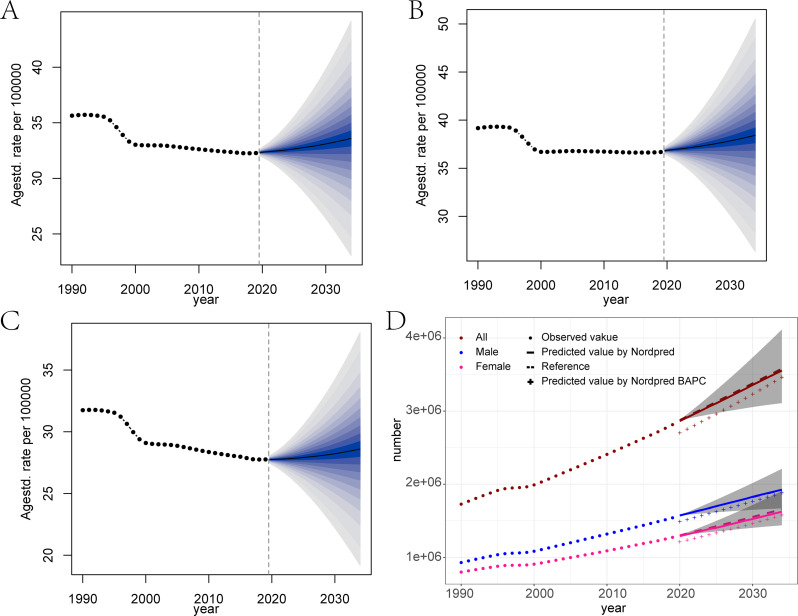
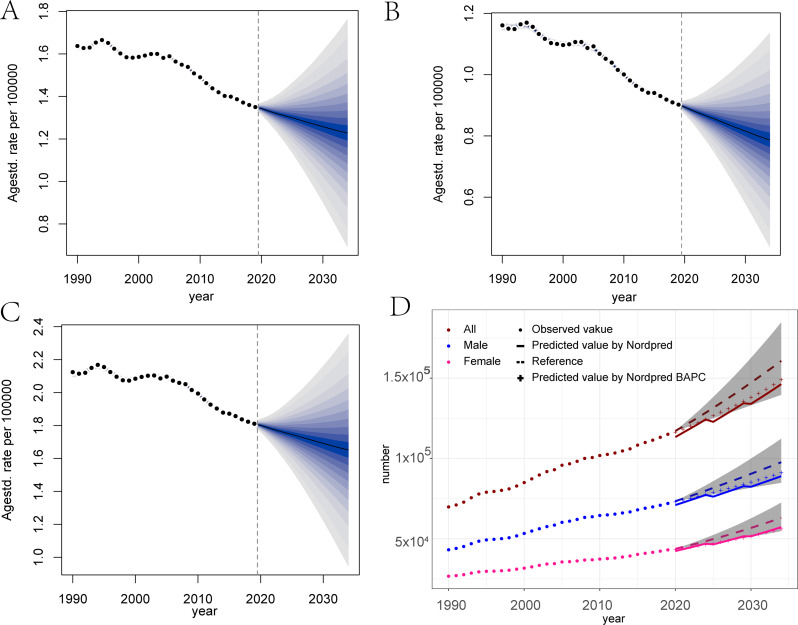
Methods: Pancreatitis burden data, including the number and age-standardized rates (ASR) of incidence, prevalence, deaths, years of life lost (YLLs), years lived with disability (YLDs), and disability-adjusted life years (DALYs), were collected from the Global Burden of Diseases 2019 (GBD 2019). SDI and HDI were used to analyze the influence of societal development on the burden of pancreatitis in the population. Additionally, the Gini coefficient and the Concentration index were used to assess health inequalities in the burden of pancreatitis. Global population data from 1990 to 2034 was obtained from WHO. Based on the population data and pancreatitis burden data, a prediction model of the burden was constructed to calculate the number and ASR of incidence, prevalence, deaths, YLLs, YLDs, and DALYs from 2019 to 2034 using the BAPC package and the Nordpred package.
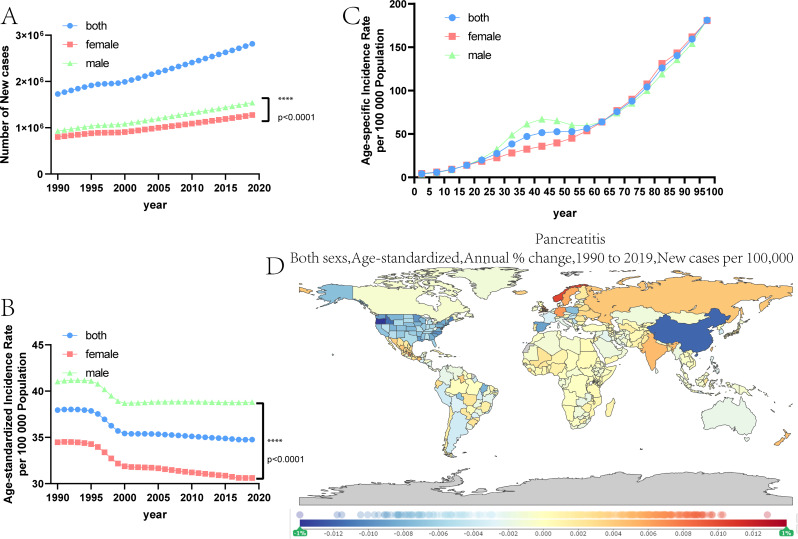
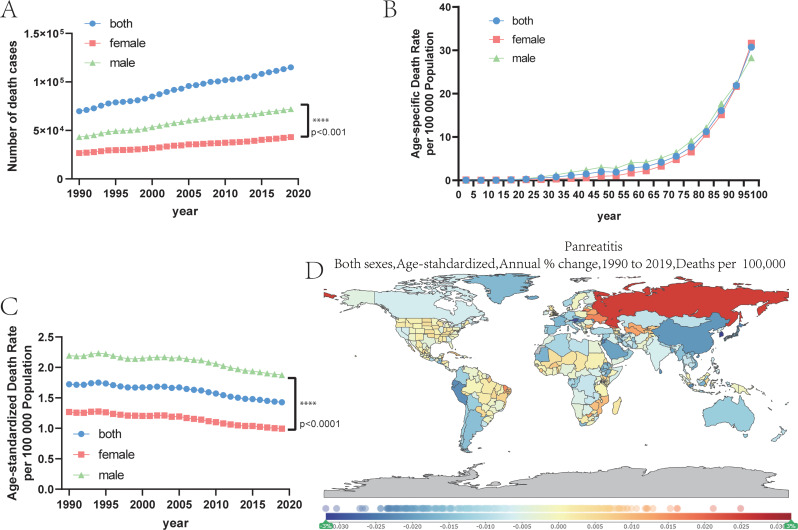
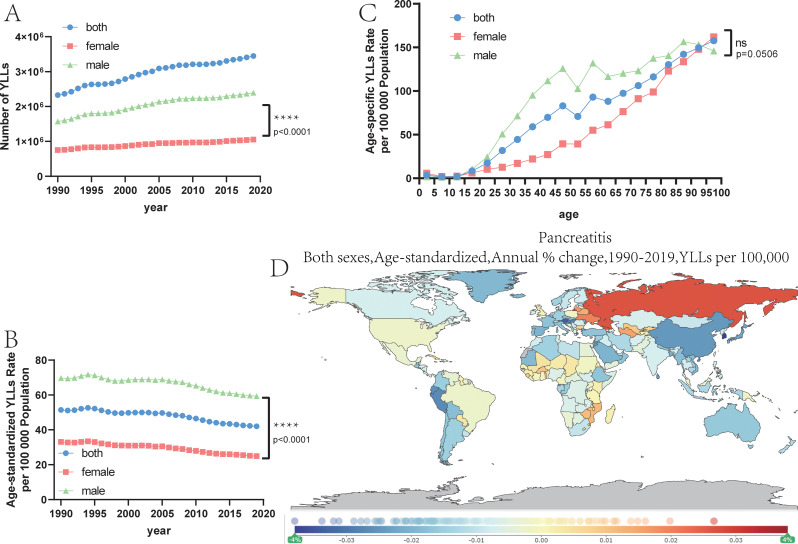
Results: From 1990 to 2019, there has been a decreasing trend in the ASR of incidence, prevalence, deaths, YLLs, YLDs, and DALYs in pancreatitis. However, despite this decline, the number of cases has been on the rise. Furthermore, pancreatitis imposes a higher burden on males in comparison to females, and there exists a negative correlation between pancreatitis burden and both the Social Development Index (SDI) and the Human Development Index (HDI). Additionally, health inequalities have progressively worsened globally between 1990 and 2019, particularly concerning the burden of pancreatitis in countries with low Social Development Index (SDI). Looking to the future, it is projected that the number of deaths and new cases will continue to increase from 2020 to 2034.
Conclusions: Pancreatitis remains a mounting worldwide burden. In order to alleviate this challenge, preventive strategies should focus on males and middle-aged or older individuals, specifically in countries with a low SDI. Pancreatitis is expected to predominantly impact Eastern Europe, characterized by a high ASR of incidence, and Asia, boasting a substantial population.
Keywords: Death; Disability-adjusted life-years; Health inequality; Incidence; Pancreatitis; Prevalence; The years of life lost; Years lived with disability.
© 2024. The Author(s).
Conflict of interest statement
Declarations. Ethics approval and consent to participate: Not applicable. Consent for publication: Not applicable. Competing interests: The authors declare no competing interests.
Figures
Similar articles
-
Global incidence, prevalence, years lived with disability (YLDs), disability-adjusted life-years (DALYs), and healthy life expectancy (HALE) for 371 diseases and injuries in 204 countries and territories and 811 subnational locations, 1990-2021: a systematic analysis for the Global Burden of Disease Study 2021.Lancet. 2024 May 18;403(10440):2133-2161. doi: 10.1016/S0140-6736(24)00757-8. Epub 2024 Apr 17. Lancet. 2024. PMID: 38642570 Free PMC article.
-
Burden of disease scenarios for 204 countries and territories, 2022-2050: a forecasting analysis for the Global Burden of Disease Study 2021.Lancet. 2024 May 18;403(10440):2204-2256. doi: 10.1016/S0140-6736(24)00685-8. Lancet. 2024. PMID: 38762325 Free PMC article.
-
Global, regional, and national burden of 12 mental disorders in 204 countries and territories, 1990-2019: a systematic analysis for the Global Burden of Disease Study 2019.Lancet Psychiatry. 2022 Feb;9(2):137-150. doi: 10.1016/S2215-0366(21)00395-3. Epub 2022 Jan 10. Lancet Psychiatry. 2022. PMID: 35026139 Free PMC article.
-
Global burden of liver cirrhosis 1990-2019 and 20 years forecast: results from the global burden of disease study 2019.Ann Med. 2024 Dec;56(1):2328521. doi: 10.1080/07853890.2024.2328521. Epub 2024 May 10. Ann Med. 2024. PMID: 38727511 Free PMC article.
-
The global, regional, and national burden of pancreatitis in 195 countries and territories, 1990-2017: a systematic analysis for the Global Burden of Disease Study 2017.BMC Med. 2020 Dec 10;18(1):388. doi: 10.1186/s12916-020-01859-5. BMC Med. 2020. PMID: 33298026 Free PMC article.
Cited by
-
Global, Regional, and National Burden of Pancreatitis in Adults Aged 20-54 Years, 1990-2021: Insight from the Global Burden of Disease Study 2021.Dig Dis Sci. 2025 Jul 24. doi: 10.1007/s10620-025-09247-w. Online ahead of print. Dig Dis Sci. 2025. PMID: 40705245
-
Case Report: Spontaneous Pneumomediastinum and Pneumothorax Complicating Severe Ketoacidosis-An Unexpected Presentation.Reports (MDPI). 2025 Jun 18;8(2):95. doi: 10.3390/reports8020095. Reports (MDPI). 2025. PMID: 40710886 Free PMC article.
-
Navigating chronic pancreatitis pain: a pathophysiological and therapeutic overview.Front Physiol. 2025 Jul 10;16:1622845. doi: 10.3389/fphys.2025.1622845. eCollection 2025. Front Physiol. 2025. PMID: 40708786 Free PMC article. Review.
-
Numbers Matter: Influence of Pancreatitis on Life Expectancy.Dig Dis Sci. 2025 Jul;70(7):2248-2250. doi: 10.1007/s10620-025-09013-y. Epub 2025 Mar 28. Dig Dis Sci. 2025. PMID: 40153239 Free PMC article. No abstract available.
References
MeSH terms
Grants and funding
LinkOut - more resources
Full Text Sources
Medical
