. 2024 Dec 15;38(23):e70222.
doi: 10.1096/fj.202401946R.

The central role of creatine and polyamines in fetal growth restriction

Affiliations

The central role of creatine and polyamines in fetal growth restriction

Eros Di Giorgio et al. FASEB J. .

Abstract

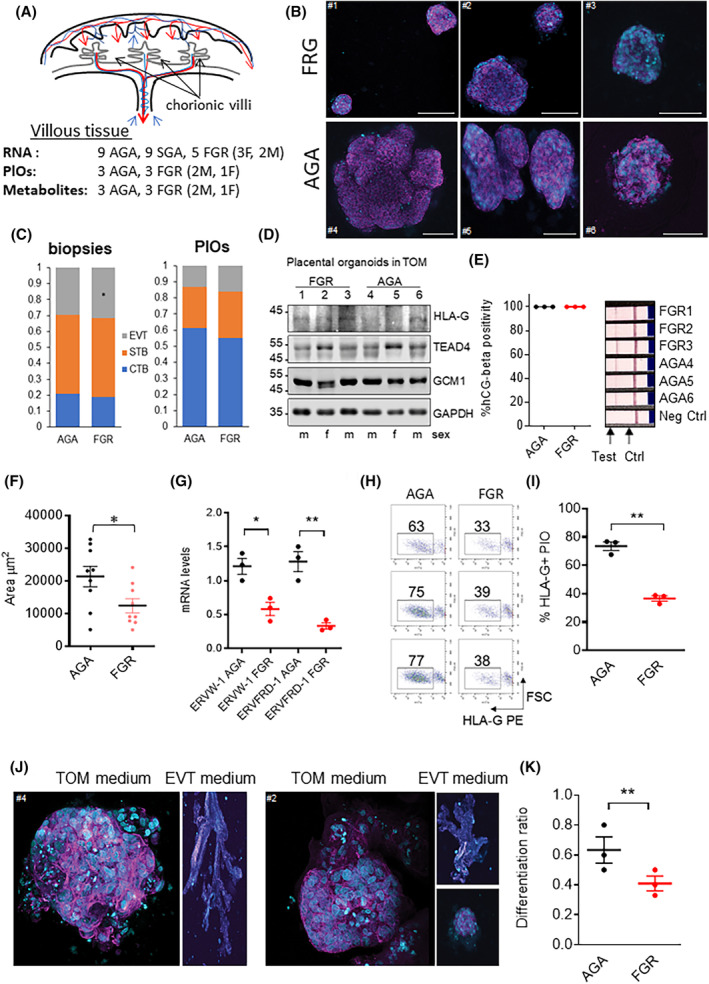
Placental insufficiency often correlates with fetal growth restriction (FGR), a condition that has both short- and long-term effects on the health of the newborn. In our study, we analyzed placental tissue from infants with FGR and from infants classified as small for gestational age (SGA) or appropriate for gestational age (AGA), performing comprehensive analyses that included transcriptomics and metabolomics. By examining villus tissue biopsies and 3D trophoblast organoids, we identified significant metabolic changes in placentas associated with FGR. These changes include adaptations to reduced oxygen levels and modifications in arginine metabolism, particularly within the polyamine and creatine phosphate synthesis pathways. Specifically, we found that placentas with FGR utilize arginine to produce phosphocreatine, a crucial energy reservoir for ATP production that is essential for maintaining trophoblast function. In addition, we found polyamine insufficiency in FGR placentas due to increased SAT1 expression. SAT1 facilitates the acetylation and subsequent elimination of spermine and spermidine from trophoblasts, resulting in a deficit of polyamines that cannot be compensated by arginine or polyamine supplementation alone, unless SAT1 expression is suppressed. Our study contributes significantly to the understanding of metabolic adaptations associated with placental dysfunction and provides valuable insights into potential therapeutic opportunities for the future.

Keywords: creatine metabolism; fetal growth restriction; metabolome; placenta biopsies; placenta organoids; polyamine metabolism; spermidine/spermidine N1‐acetyltransferase 1; transcriptome.


Figures

FIGURE 1
FIGURE 1
Placental biopsy sampling and characterization of FGR and AGA organoids. (A) Schematic representation of the human placenta, composed of a series of highly branched structures, called villi, which directly bath in maternal blood; scheme of the samples used in this study. (B) Trophoblasts PlOs from FGR and AGA placentas (>32 weeks of gestation) were obtained from villous tissue as reported in Ref. [26] and cultured for 11 day in TOM; Phallodin‐AF546 and Hoechst 33342 were used to stain actin cytoskeleton (magenta) and DNA (cyan). Scale bar 100 μM. (C) Proportions of trophoblast cell type (CTB, STB, and EVT) in placental biopsies and PlOs. (D) Western blot showing the expression of the transcription factors HLA‐G, TEAD4, and GCM1 in AGA and FGR PlOs. GAPDH was used as loading control. (E) Positivity to hCG beta pregnancy test; pregnancy test strips were immersed in PlO culture medium for a few seconds. HEK293 cell culture medium was used as a negative control. (F) Scatter plot representing the area (μm2) of AGA and FGR PlOs reached after 11 days of culture in TOM; mean and SD are indicated, n = 9. (G) mRNA relative levels of ERVW‐1 and ERVFRD‐1 determined by RT‐qPCR in the AGA and FGR PlOs. Mean and standard deviation are indicated. (H, I) Representative cytofluorimetric dot plot of HLA‐G PE in AGA and FGR PlOs and scatter plot representing HLA‐G positivity in AGA and FGR PlOs at the end of the differentiation protocol (11 days in EVT medium +7 7 days without NRG‐1). Means and SD are reported. (J) Representative 3D reconstruction images obtained by confocal imaging obtained from AGA and FGR PlOs maintained in TOM or EVT medium. (K) Dot plot representing the differentiation rate of AGA and FGR PlOs. For each biological sample, the mean value of the rate of matrix invading organoids (FGR samples: 1, 2, 3 and AGA samples: 4, 5, 6) was plotted. Mean and SD are indicated. All data reported represent the mean ± SD of at least 3 independent experiments: *p ≤ .05; **p ≤ .01; and ***p ≤ .001 by Student's t‐test between the indicated pairwise comparisons.
FIGURE 2
FIGURE 2
RNA‐seq reveals transcriptomic differences between FGR and AGA placentas. (A) Volcano plot of DEGs in FGR compared to AGA placentas (|log2(Fc)| > 1, p < .05). (B, C) PCA of the indicated samples based on the 182 coding genes found to be repressed (B) or the 67 coding genes found to be upregulated (C) in FGR compared to AGA placentas. F = FGR, S = SGA, and A = AGA. (D) Heatmap of the DEGs contributing to more than 50% of difference between FGR and AGA. (E, F) Gene ontology analysis (ShinyGO 0.80) of downregulated and upregulated DEGs identifies enriched terms in FGR. The color and size of the dots are proportional to the significance and strength of the enrichment, as indicated.
FIGURE 3
FIGURE 3
Identification of gene signatures defining FGR. Gene set enrichment analysis (GSEA) performed by using as geneset genes found to be repressed in FGR in POP dataset (ref. 21) and as dataset our RNA‐seq; significant positive enrichment was obtained in AGA vs. FGR comparison. (A,B) GSEA performed by using as geneset genes found to be down‐regulated and upregulated in FGR in POP dataset (ref. 21) and as dataset our RNA‐seq; significant positive enrichment was obtained in FGR vs. AGA comparison. (C, D, F) Scatter plot representing the RT‐qPCR quantification of the indicated mRNA of genes (representative of the functional categories described respectively in A, B, E) between AGA, SGA, and FGR samples; mean, SD, and p‐values are indicated. (E) GSEA performed by using as geneset genes found to be depleted in normal placentas (ref. 38) and as dataset our RNA‐seq; significant positive enrichment was obtained in FGR vs. AGA comparison. (G) PCA of the indicated samples, based on the 762 genes found to be depleted in normal placentas with respect to other tissues (ref. 38). F = FGR, S = SGA, and A = AGA. (H) Scatter plot representing the RT‐qPCR quantification of the indicated genes of endogenous retroviral origin; mean and SD are indicated. Data represent the mean ± SD of at least 3 independent experiments: *p ≤ .05; **p ≤ .01; and ***p ≤ .001 by Student's t‐test.
FIGURE 4
FIGURE 4
Hypoxia triggers metabolic reprogramming in FGR. (A) Expression level of specific hypoxia‐related genes determined by RNA‐seq analysis. The fold change of FGR mRNA/ AGA mRNA is reported. (B) Fold change of the indicated genes involved in glycolysis and PPP pathways. Red triangles indicate the fold change obtained from SGA vs. AGA comparison; black circles indicate the fold change obtained from FGR vs. AGA comparison. (C) Schematic representation of the integration of glycolysis and PPP; genes encoding for key rate‐limiting enzymes found to be de‐regulated in FGR are highlighted in blue. (D) Relative levels of the indicated metabolites determined by mass spectrometry in AGA and FGR placentas. F6P: D‐Fructose 6‐phosphate; 6PG: 6‐Phosphogluconic acid; Gro3P: Glycerol‐3‐phosphate; and NAD+: Oxidized Nicotinamide Adenine Dinucleotide. (E) Gro3P pathway and LDHA can regenerate NAD+ for maintaining glycolysis and PPP. (F) Levels of ATP in AGA and FGR organoids cultured for 72 h under different oxygen concentrations: 2, 8, and 21 O2%, as indicated. Data represent the mean ± SD of at least 3 independent experiments: *p ≤ .05; **p ≤ .01; and ***p ≤ .001 by Student's t‐test.
FIGURE 5
FIGURE 5
Metabolism of arginine is subverted in FGR placentas. (A) Metabolic network showing the route of arginine in placenta. Arginine can be channeled into the creatine, polyamine, or nitric oxide pathways; genes encoding key enzymes involved in arginine metabolism and found dysregulated in FGR placentas are highlighted in red. Up arrows indicate upregulation and down arrows repression. (B) Absolute mRNA levels of the indicated genes (encoding key enzymes of the arginine metabolism) in FGR/SGA placentas. Data were obtained from RNA‐seq. (C) Absolute mRNA levels of NOS3 in FGR/SGA and AGA placentas; data were obtained from RNA‐seq. (D) Percentage of cells positive to DAF‐2DA in AGA and FGR PlO kept in TOM. (E) Absolute mRNA levels of CKB mRNA in FGR/SGA and AGA placentas; data were obtained from RNA‐seq. (F) Creatine kinase activity was measured in 3 AGA and 3 FGR placental biopsies, later used to obtain organoids (FGR 1, 2, 3 and AGA 4, 5, 6 samples). (G, H) Relative levels of the indicated metabolites representing key intermediates of creatine pathway determined by mass spectrometry in AGA and FGR placentas. PCr: Phosphocreatine, Cr: Creatine, GAA: Guanidinoacetic Acid, AS: Argininosuccinic acid, Gly: Glycine, and Met: Methionine. (I) ATP levels in AGA and FGR PlOs cultured in TOM and treated or not for 72 h with Cyclocreatine (CCr, 5 mM). Data represent the mean ± SD of at least 3 independent experiments: *p ≤ .05; **p ≤ .01; and ***p ≤ .001 by Student's t‐test, with the exception of Figure 5I (Dunn's multiple comparison test); Figure 5C and Figure 5E (Wilcoxon signed‐rank test).
FIGURE 6
FIGURE 6
The metabolism of arginine and polyamine is altered in FGR placentas. (A) Metabolic network showing that arginine can feed the polyamine pathway. (B) Absolute levels of arginine and polyamines in AGA and FGR placental villous tissue. (C) mRNA level of genes related to arginine metabolism determined by RT‐qPCR in AGA and FGR biopsies. Data are expressed as relative expression in FGR with respect to AGA samples. (D) Relative levels of the indicated metabolites of polyamine metabolism. DAC: N1, N8‐diacetylspermidine, MAS: N1‐acetylspermidine, Spermid.: Spermidine, Putres.: Putrescine, and Ornith.: Ornithine. Data represent the mean ± SD of at least 3 independent experiments: *p ≤ .05; **p ≤ .01; and ***p ≤ .001 by Student's t‐test.
FIGURE 7
FIGURE 7
Increased spermidine acetylation depletes polyamines in FGR placentas. (A) Absolute levels of total (acetylated and diacetylated) polyamines and arginine in AGA and FGR organoids maintained for 11 days in TOM; 2 separate cultures of each of the 3 AGA and FGR PlO were analyzed. (B) Absolute levels of ATP in AGA and FGR PlOs cultured for 11 days in TOM and for the last 2 days in medium deprived of arginine or in medium containing 5 μM DFMO. (C) mRNA levels of SAT1, determined by RT‐qPCR, in AGA and FGR PlOs (AGA4 and FGR1) stably expressing the indicated two shRNA antisense to SAT1 (shSAT1A, shSAT1B) or shCT (against GFP). 3 polyclonal cultures of each PlO clone were compared. Data are relative to one culture of AGA4. (D) Absolute levels of total polyamines in AGA (PlO 4) and FGR (PlO1) organoids silenced or not for SAT1 as indicated and explained in Figure 7C. (E) ATP levels in three independent cultures of FGR organoids (PlO 1), silenced or not for SAT1 as explained in Figure 7C, after 11 days of culture in TOM after removal of puromycin. Data represent the mean ± SD of at least 3 independent experiments or cultures as indicated in the legend: *p ≤ .05; **p ≤ .01; and ***p ≤ .001 by Dunn's multiple comparison test.

References

    1. Society for Maternal‐Fetal Medicine (SMFM). Electronic address: pubs@smfm.org , Miller R, Timor‐Tritsch IE, Gyamfi‐Bannerman C. Society for Maternal‐Fetal Medicine Consult Series #52: diagnosis and management of fetal growth restriction: (replaces clinical guideline number 3, April 2012). Am J Obstet Gynecol. 2020;223(4):B2‐B17. - PubMed
    1. Fetal growth restriction: ACOG practice bulletin, number 227. Obstet Gynecol. 2021;137(2):e16‐e28. - PubMed
    1. Lees CC, Stampalija T, Baschat AA, et al. ISUOG practice guidelines: diagnosis and management of small‐for‐gestational‐age fetus and fetal growth restriction. Ultrasound Obstet Gynecol. 2020;56(2):298‐312. - PubMed
    1. Defining normal and abnormal fetal growth: promises and challenges – ScienceDirect [Internet]. Accessed May 14, 2024. https://www.sciencedirect.com/science/article/pii/S0002937809021152.
    1. Gordijn SJ, Beune IM, Thilaganathan B, et al. Consensus definition of fetal growth restriction: a Delphi procedure. Ultrasound Obstet Gynecol. 2016;48(3):333‐339. - PubMed