. 2025 Jan:59:101092.
doi: 10.1016/j.neo.2024.101092. Epub 2024 Nov 29.

Suppression of ADP-ribosylation reversal triggers cell vulnerability to alkylating agents

Affiliations

Suppression of ADP-ribosylation reversal triggers cell vulnerability to alkylating agents

Rocco Caggiano et al. Neoplasia. 2025 Jan.

Abstract

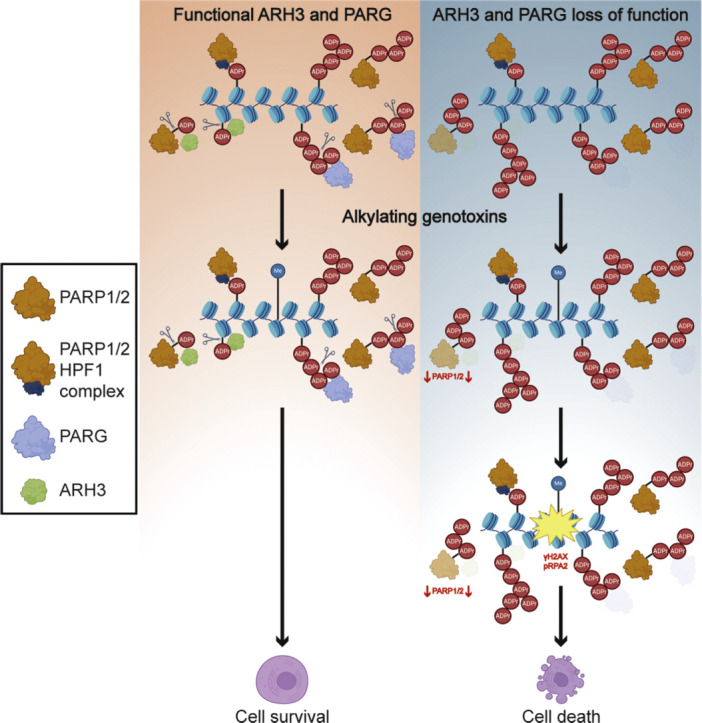
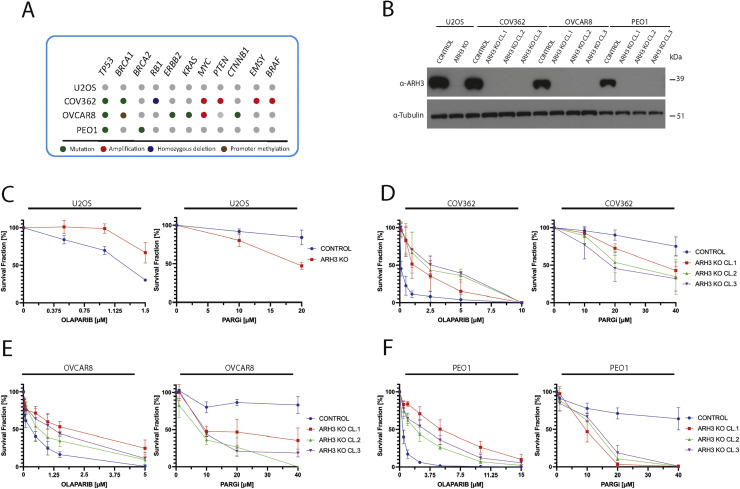
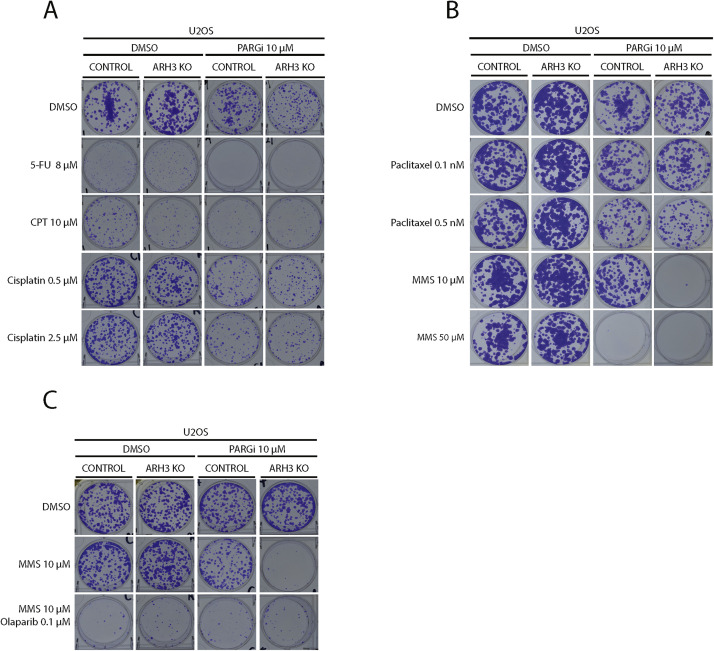
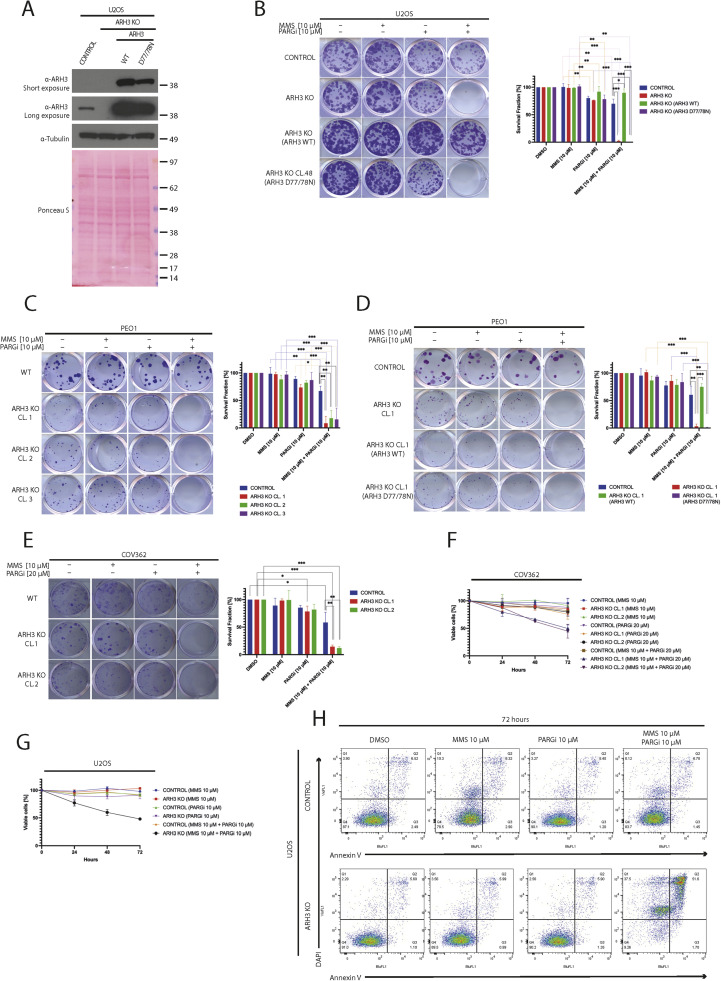
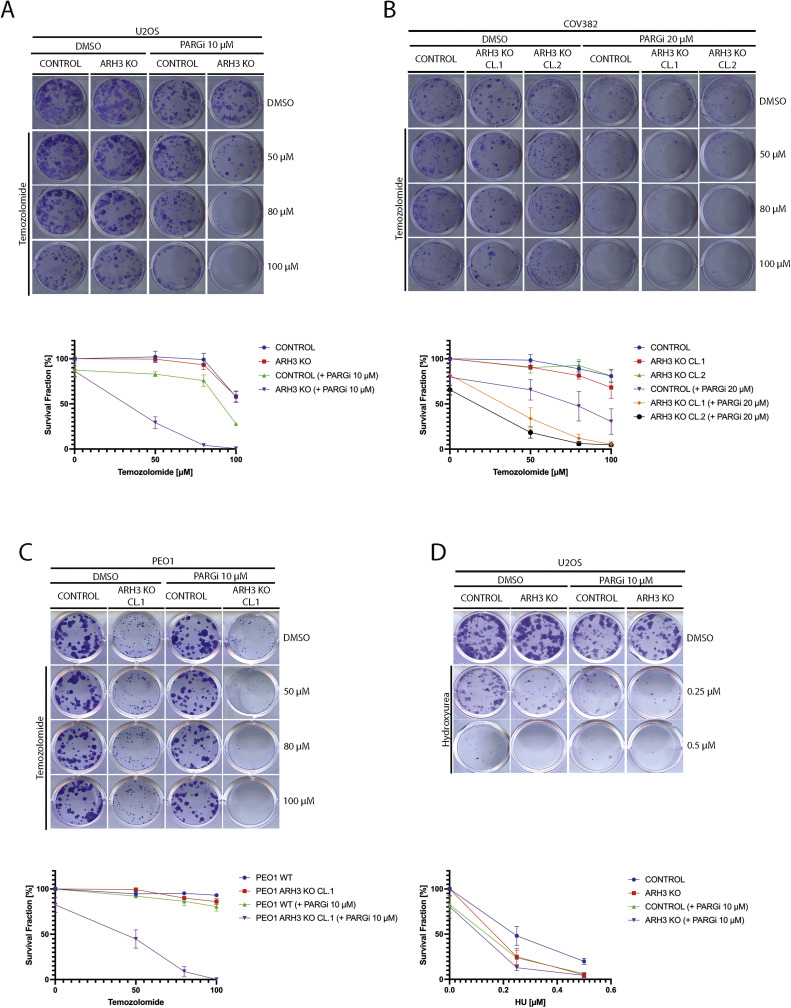
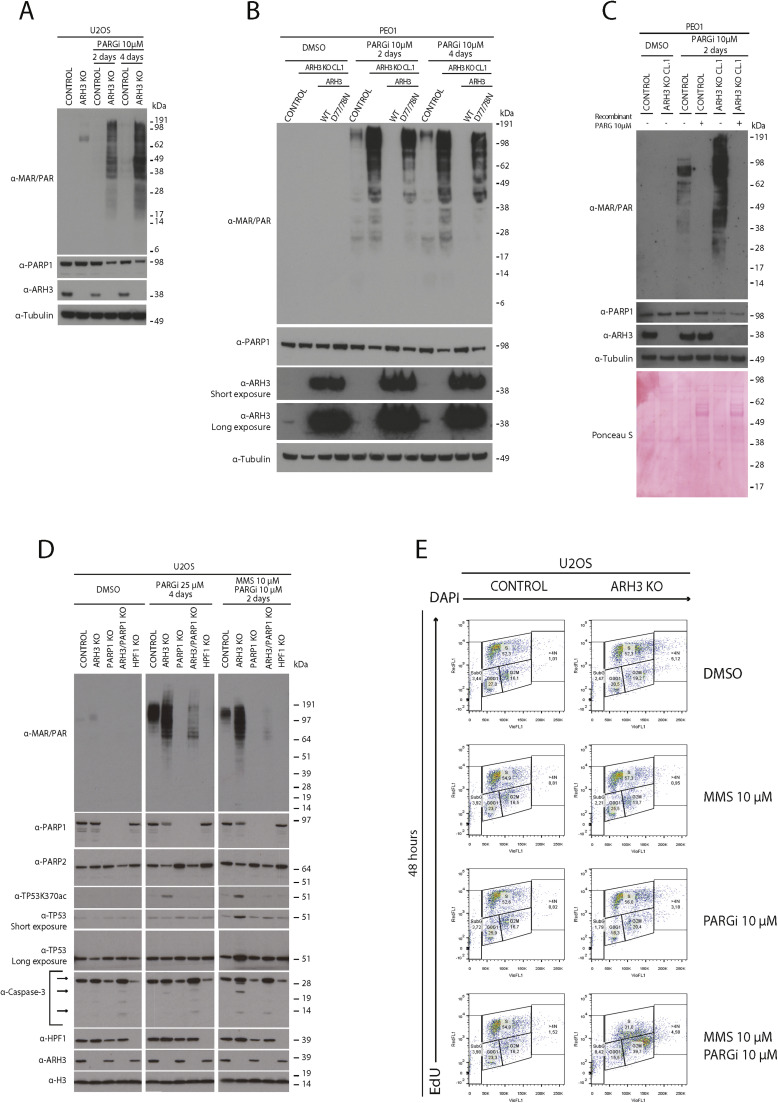
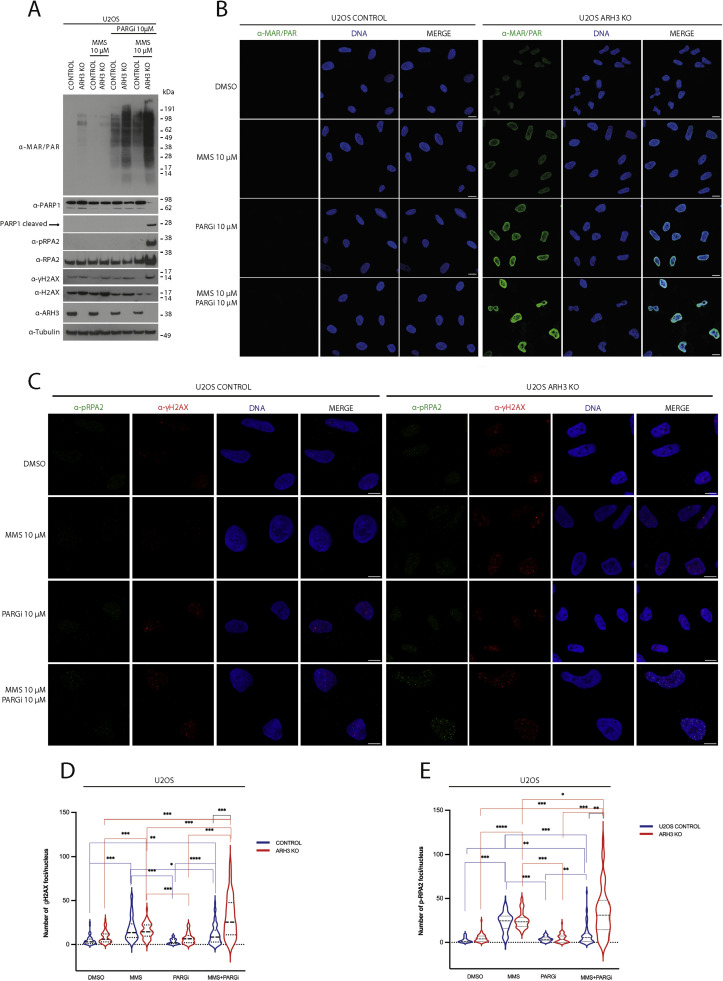
The ADP-ribosyl hydrolases PARG and ARH3 counteract PARP enzymatic activity by removing ADP-ribosylation. PARG and ARH3 activities have a synthetic lethal effect; however, the specific molecular mechanisms underlying this response remain unknown. Here, we show that the PARG and ARH3 synthetic lethality is enhanced further in the presence of DNA alkylating agents, suggesting that the inability to revert ADP-ribosylation primarily affects the repair of alkylated DNA bases. ARH3 knockout cells, treated with PARG inhibitor and alkylating genotoxins, accumulated single-stranded DNA and DNA damage, resulting in G2/M cell cycle arrest and apoptosis. Furthermore, we reveal a reduction in PARP1/PARP2 levels in ARH3-deficient cells treated with PARG inhibitor due to excessive ADP-ribosylation, which may contribute to alkylating agents' vulnerability. Collectively, these results uncover the potential of targeting ADP-ribosyl hydrolases in combination with alkylating agents for cancer therapy and provide insights into the mechanisms underlying the synthetic lethal effect.

Keywords: ADP-ribosyl hydrolases; ADP-ribosylation; ARH3; Alkylating drugs; Cancer; DNA damage; PARG inhibitor; PARP inhibitor.


Conflict of interest statement

Declaration of competing interest The authors declare that they have no known competing financial interests or personal relationships that could have appeared to influence the work reported in this paper.

Figures

Image, graphical abstract
Graphical abstract
Fig 1
Fig. 1
ARH3 loss impacts cancer cell response to PARPi and PARGi. (A) Schematic representation of the main gene mutation profile of the cell lines employed in this study. (B) Representative western blotting analysis of ARH3 protein levels in total cell lysates extracted from control and independent clones of ARH3 KO U2OS, COV362, OVCAR8, and PEO1 cell lines. α-tubulin served as loading controls. (C-F) Survival fraction of cell colony formation assay performed in control and ARH3 KO cells. U2OS, COV362, OVCAR8, and PEO1 cells were treated with olaparib and PARGi used at the indicated concentrations. Experiments were performed in biological and technical triplicates.
Fig 2
Fig. 2
Methyl methanesulfonate contributes to enhanced PARGi sensitivity of ARH3 KO cells. (A-B) Representative images of colony formation assays carried out in control and ARH3 KO U2OS cells. As indicated, the cells were treated with or without 10 μM PARGi in combination with DMSO or genotoxins used at the indicated concentrations. (C) Representative images of colony formation assays carried out in control and ARH3 KO U2OS cells. As indicated, the cells were treated with or without PARGi in combination with DMSO or MMS or a combination of MMS and olaparib used at the indicated concentrations. Each experiment shown in this figure was conducted in biological and technical triplicates.
Fig 3
Fig. 3
The combination of ARH3 KO and PARGi sensitizes diverse cancer cell lines to MMS through the loss of ARH3 catalytic activity. (A) Representative western blotting analysis of ARH3 protein in parental and ARH3 KO U2OS cells, as well as in ARH3 KO U2OS cells, complemented either wild-type ARH3 (ARH3 WT) or catalytically inactive ARH3 D77/78N through stable overexpression. α-tubulin and Ponceau S served as loading controls. (B) Representative images (left panel) and relative quantification with statistics (right panel) of colony formation assays conducted in parental, ARH3 KO U2OS cells, ARH3 KO U2OS cells complemented with either wild-type ARH3 (ARH3 WT) or catalytically inactive ARH3 D77/78N treated with DMSO, MMS, PARGi, or a combination of MMS and PARGi at the indicated concentrations. (C) Representative images (left panel) and relative quantification (right panel) of colony formation assays conducted in parental and independent clones of ARH3 KO PEO1 cells treated as indicated. (D) Representative images (left panel) and relative quantification (right panel) of colony formation assays conducted in parental and ARH3 KO PEO1 cells complemented with either wild-type ARH3 (ARH3 WT) or catalytically inactive ARH3 D77/78N treated as indicated. (E) Representative images (left panel) and relative quantification (right panel) of colony formation assays conducted in parental and independent clones of ARH3 KO COV362 cells treated as indicated. (F-G) The short-term cell viability of parental and ARH3 KO COV362 (F) and U2OS (G) cells was measured using the metabolic CellTiter 96® AQueous One Solution assay as cells were treated with DMSO, MMS, PARGi, or a combination of MMS and PARGi at the indicated concentrations for 24, 48, and 72 hours. (H) Representative scatterplots of flow cytometry analysis for Annexin V-DAPI stained cells after 72 hours of exposure of parental or ARH3 KO U2OS cells as indicated. Each experiment shown in this figure was conducted in biological and technical triplicates. Quantification data are shown as mean ± SD. Statistical significance was evaluated by using a 2-tailed Student's t-test (∗p < 0.05, ∗∗p < 0.01, and ∗∗∗p < 0.001).
Fig 4
Fig. 4
ARH3 KO and PARG inhibition sensitize cancer cell lines to temozolomide. (A) Representative images (upper panel) and survival fraction (lower panel) from colony formation assay carried out in parental and ARH3 KO U2OS cells treated with or without PARGi in combination with DMSO or temozolomide at the indicated concentrations. (B) Representative images (upper panel) and survival fraction (lower panel) from colony formation assay carried out in parental and two independent clones of ARH3 KO COV362 cells treated with or without PARGi in combination with DMSO or temozolomide. (C) Representative images (upper panel) and survival fraction (lower panel) from colony formation assay carried out in parental and ARH3 KO PEO1 cells treated with or without PARGi in combination with DMSO or temozolomide. (D) Representative images (upper panel) and survival fraction (lower panel) from colony formation assay carried out in parental and ARH3 KO U2OS cells treated with or without PARGi in combination with DMSO or hydroxyurea (HU). Each experiment shown in this figure was conducted in biological and technical triplicates.
Fig 5
Fig. 5
Dual ARH3 and PARG enzymatic activity loss correlates with decreased PARP1/2 protein levels. (A) Representative western blot of total cell lysates extracted from parental and ARH3 KO U2OS cells treated with DMSO or 10 µM PARGi for two or four days. α-tubulin served as loading controls. (B) Representative western blot of total cell lysates extracted from parental PEO1, ARH3 KO PEO1, and ARH3 KO PEO1 complemented with wild-type ARH3 (ARH3 WT) or ARH3 D77/78N double mutant (D77/78N) treated with DMSO or 10 µM PARGi for two or four days. α-tubulin served as loading controls. (C) Representative western blotting analysis of total cell lysates extracted from control and ARH3 KO PEO1. The cells were treated with DMSO or 10 μM PARGi for two days. The cells were lysed, and total cell extracts were incubated with or without 10 μM recombinant PARG enzyme for 30 minutes at 30°C. The cell lysates were then analyzed by western blotting using the indicated antibodies. α-tubulin and Ponceau S served as loading controls. (D) Representative western blot of total cell lysates extracted from parental and ARH3 KO, PARP1 KO, ARH3/PARP1 double KO, and HPF1 KO U2OS cells treated with DMSO or 25 µM PARGi for four days or with the combination of MMS and 10 µM PARGi for two days. α-H3 served as loading controls. (E) Representative scatterplots of flow cytometry analysis for cells were treated with DMSO, MMS, PARGi or a combination of MMS and PARGi for 48 hours and stained with EdU-DAPI. Experiments in this figure were performed in biological triplicates.
Fig 6
Fig. 6
ARH3 KO combined with PARGi results in excessive PARylation and DNA damage in response to treatment with a DNA alkylating agent. (A) Total cell lysates extracted from control and ARH3 KO U2OS cells after treatment with DMSO, MMS, PARGi or a combination of MMS and PARGi for 48 hours were then analyzed by western blotting using the indicated antibodies. α-tubulin and Ponceau S served as loading controls (B) Confocal images of control and ARH3 KO U2OS cells treated with DMSO, MMS, PARGi or a combination of MMS and PARGi for 48 hours before detergent pre-extraction, fixation, further permeabilization and immunostaining with anti-MAR/PAR antibody (green) and DAPI (blue): Scale bars, 10 μm. Experiments were performed in biological triplicates. (C) Confocal images of control and ARH3 KO U2OS cells treated with DMSO, MMS, PARGi, or a combination of MMS and PARGi for 48 hours before detergent pre-extraction, fixation, further permeabilization and immunostaining with the pRPA2 (green) and α-γH2AX (red) antibodies and DAPI dye (blue): Scale bars, 10 μm. The experiments were carried out three times using biological triplicates. (D-E) Quantification of pRPA2 and α-γH2AX foci. The frequency distribution of the population was analyzed, and the median was represented by a dashed line and the quartiles by dotted lines. Statistical significance was assessed using a 2-tailed Student's t-test (*p < 0.05, **p < 0.01, and ***p < 0.001).

References

    1. Huang D., Kraus W.L. The expanding universe of PARP1-mediated molecular and therapeutic mechanisms. Mol. Cell. 2022;82:2315–2334. doi: 10.1016/j.molcel.2022.02.021. - DOI - PMC - PubMed
    1. Suskiewicz M.J., Prokhorova E., Rack J.G.M., Ahel I. ADP-ribosylation from molecular mechanisms to therapeutic implications. Cell. 2023;186:4475–4495. doi: 10.1016/j.cell.2023.08.030. - DOI - PMC - PubMed
    1. Ray Chaudhuri A., Nussenzweig A. The multifaceted roles of PARP1 in DNA repair and chromatin remodelling. Nat. Rev. Mol. Cell Biol. 2017;18:610–621. doi: 10.1038/nrm.2017.53. - DOI - PMC - PubMed
    1. Caldecott K.W. DNA single-strand break repair and human genetic disease. Trends. Cell Biol. 2022;32:733–745. doi: 10.1016/j.tcb.2022.04.010. - DOI - PubMed
    1. Rouleau-Turcotte E., Pascal J.M. ADP-ribose contributions to genome stability and PARP enzyme trapping on sites of DNA damage; paradigm shifts for a coming-of-age modification. J. Biol. Chem. 2023;299 doi: 10.1016/j.jbc.2023.105397. - DOI - PMC - PubMed

Publication types

MeSH terms

LinkOut - more resources