. 2024 Dec:78:103423.
doi: 10.1016/j.redox.2024.103423. Epub 2024 Nov 6.

Activation of receptor-independent fluid-phase pinocytosis promotes foamy monocyte formation in atherosclerotic mice

Affiliations

Activation of receptor-independent fluid-phase pinocytosis promotes foamy monocyte formation in atherosclerotic mice

WonMo Ahn et al. Redox Biol. 2024 Dec.

Abstract

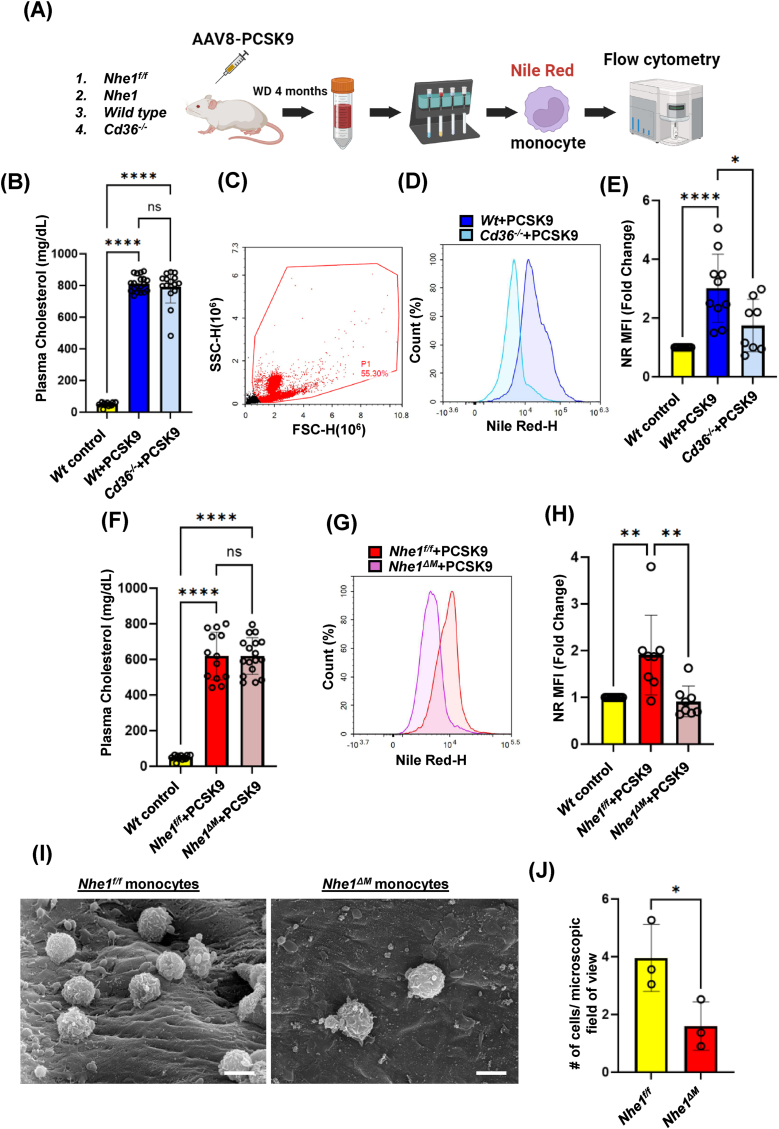
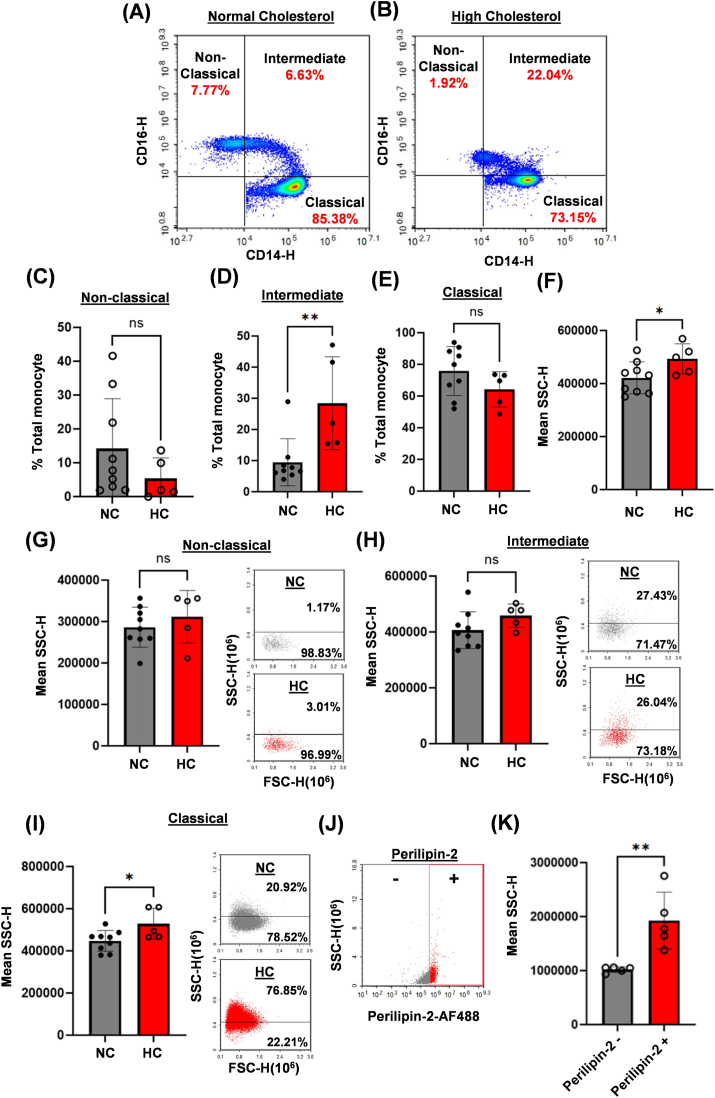
Atherosclerotic cardiovascular disease (ASCVD) is the leading cause of death worldwide. Clinical and experimental data demonstrated that circulating monocytes internalize plasma lipoproteins and become lipid-laden foamy cells in hypercholesterolemic subjects. This study was designed to identify the endocytic mechanisms responsible for foamy monocyte formation, perform functional and transcriptomic analysis of foamy and non-foamy monocytes relevant to ASCVD, and characterize specific monocyte subsets isolated from the circulation of normocholesterolemic controls and hypercholesterolemic patients. We hypothesized that activation of fluid-phase macropinocytosis contributes to foamy monocyte formation in vitro and in hypercholesterolemic mice in vivo. High resolution scanning electron microscopy (SEM) and quantification of FITC/TRITC-dextran internalization demonstrated macropinocytosis stimulation in human (THP-1) and wild type murine monocytes. Stimulation of macropinocytosis induced foamy monocyte formation in the presence of unmodified, native LDL (nLDL) and oxidized LDL (ox-LDL) in vitro. Genetic blockade of macropinocytosis (LysMCre+ Nhe1f/f) inhibited foamy monocyte formation in hypercholesterolemic mice in vivo and attenuated monocyte adhesion to atherosclerotic aortas ex vivo. Mechanistic studies identified NADPH oxidase 2 (Nox2)-derived superoxide anion (O2⋅-) as an important downstream signaling molecule stimulating macropinocytosis in monocytes. qRT-PCR identified CD36 as a major scavenger receptor that increases in response to lipid loading in monocytes and deletion of CD36 (Cd36-/-) inhibited foamy monocyte formation in hypercholesterolemic mice. Bulk RNA-sequencing characterized transcriptional differences between non-foamy and foamy monocytes versus macrophages. Finally, flow cytometry analysis of CD14 and CD16 expression demonstrated a significant increase in intermediate monocytes in hypercholesterolemic patients compared to normocholesterolemic controls. These results provide novel insights into the mechanisms of foamy monocyte formation and potentially identify new therapeutic targets for the treatment of atherosclerosis.

Keywords: Atherosclerosis; Hypercholesterolemia; Macropinocytosis; Monocyte; Ox-LDL; nLDL.


Conflict of interest statement

Declaration of competing interest The authors declare that the research was conducted in the absence of any commercial or financial relationships that could be taken as a potential conflict of interest.

Figures

Image 1
Graphical abstract
Fig. 1
Fig. 1
Stimulation of monocyte macropinocytosis promotes nLDL internalization and foam cell formation in vitro. THP-1 monocytes were seeded onto confluent HAECs and treated with vehicle or PMA (1 μM, 20 min), ± EIPA (25 μM, 30 min preincubation), and processed for SEM. (A) Representative SEM images demonstrating emerging membrane ruffles (yellow arrows) upon PMA stimulation. Scale bar: 10 μm. (B) Quantification of the number of membrane ruffles normalized to cell number. (n = 3). (C, D) THP-1 monocytes were incubated with FITC-dextran (100 μg/ml) and treated with vehicle or PMA (1 μM, 3 h), ± EIPA (25 μM, 30 min preincubation). Internalization of FITC-dextran was quantified via FACS (Ex: 488 nm, Em 530/30 nm). (n = 3). (E) THP-1 monocytes were treated with vehicle or PMA (1 μM), ± EIPA (25 μM, 30 min pre-incubation) in the presence of nLDL (50 μg/mL, 24hr). Cells were fixed in 4 % PFA and nuclei stained with Hoechst (blue); F-actin was labeled with 488 phalloidin (green); and lipids were visualized using Nile Red (red). Images were taken with a Zeiss 780 inverted confocal microscope. Scale bar: 10 μm. (F) Quantification of Nile Red fluorescence normalized to the number of cells in the microscopic field of view. (n = 3; individual data points represent technical replicates). (G) THP-1 monocytes were treated as described in (E), stained with Nile Red and analyzed via FACS (Ex: 488 nm, Ex: 586/20 nm). (n = 7). (H, I) Bone marrow monocytes isolated from Nhe1f/f and Nhe1ΔM mice were incubated with FITC-dextran (100 μg/ml), treated with vehicle or PMA (1 μM, 3 h), and processed for FACS analysis. (n = 5–6). Data are presented as means ± SD. ns = not significant; ∗∗p<0.01; ∗∗∗p<0.001; ∗∗∗∗p<0.0001. P values were calculated using one-way (B, D, F, G) or two-way (I) ANOVA with Tukey's test for multiple comparisons. (For interpretation of the references to colour in this figure legend, the reader is referred to the Web version of this article.)
Fig. 2
Fig. 2
Scavenger receptors and macropinocytosis contribute to ox-LDL uptake and foamy monocyte formation in vitro. (A) Scavenger receptor mRNA expression levels relative to Sr-a1 in untreated wild type bone marrow-derived monocytes. (n = 4). (B) Scavenger receptor mRNA expression levels in wild type bone marrow monocytes treated with vehicle or ox-LDL (50 μg/mL, 24 h). (n = 4). (C) THP-1 monocytes were treated with vehicle or PMA (1 μM) ± EIPA (25 μM, 30 min pre-incubation) in the presence of ox-LDL (50 μg/mL, 24hr). Cells were fixed in 4 % PFA and nuclei stained with Hoechst (blue); F-actin was labeled with 488 phalloidin (green); and lipids were visualized using Nile Red (red). Images were taken with a Zeiss 780 inverted confocal microscope. Scale bar: 10 μm. (D) Quantification of Nile Red fluorescence normalized to the number of cells in the microscopic field of view. (n = 3; individual data points represent technical replicates). (E) THP-1 monocytes were treated as described in (C), stained with Nile Red and analyzed via FACS (Ex: 488 nm, Ex: 586/20 nm). (n = 7). (F) Relative contribution of scavenger receptor vs. macropinocytosis to monocyte uptake of nLDL and ox-LDL.(G-I) Bone marrow monocytes from wild type and Cd36−/− mice were treated with vehicle or PMA (1 μM) in the presence of nLDL (50 μg/mL, 24 h) or ox-LDL (50 μg/mL, 24hr). Cells were stained with Nile Red and analyzed via FACS. (n = 6–11). Data are presented as means ± SD. ns = not significant; ∗p<0.05; ∗∗p<0.01; ∗∗∗p<0.001; ∗∗∗∗p<0.0001. P values were calculated using t-test (A, B, I) or one way ANOVA (D, E, G, H) with Tukey's test for multiple comparisons. (For interpretation of the references to colour in this figure legend, the reader is referred to the Web version of this article.)
Fig. 3
Fig. 3
Macropinocytosis and CD36 mediate lipid uptake and promote foamy monocyte formation in hypercholesterolemic mice in vivo. (A) Schematic flow chart of experimental design. (B) Total plasma cholesterol of normocholesterolemic wild type and hypercholesterolemic wild type and Cd36−/− mice. (n = 11–19). (C) Flow cytometry gating strategy. (D, E) Quantification of Nile Red fluorescent intensity in circulating monocytes isolated from mice described in (B). (n = 8–10). (F) Total plasma cholesterol levels of control wild type and hypercholesterolemic Nhe1f/f, and Nhe1ΔM mice. (n = 13–17). (G, H) Quantification of Nile Red fluorescent intensity in circulating monocytes isolated from mice described in (F). (n = 8–10). (I) Representative SEM images showing monocyte adhesion to the inner curvature of atherosclerotic aorta ex vivo. Scale bar: 5 μm. (J) Quantification of the number of adhered monocytes per microscopic field of view. Data are presented as means ± SD. ns = not significant; ∗p<0.05; ∗∗p<0.01; ∗∗∗∗p<0.0001. P values were calculated using t-test (J) or one-way ANOVA (B, E, F, H) with Tukey's test for multiple comparisons. (For interpretation of the references to colour in this figure legend, the reader is referred to the Web version of this article.)
Fig. 4
Fig. 4
Gene expression in foamy and non-foamy monocytes and macrophages. (A) Principal component analysis (PCA) for wild type splenic monocytes and splenic monocyte-derived macrophages. (n = 5–6 per group). (B) Volcano plot for bulk RNA sequencing from samples shown in (A). (C) Heatmap for the expressions of genes for scavenger receptors (SR), chemokine receptors, adhesion molecules, and NOX subunits from bulk RNA sequencing in (A-B). (D) PCA for wild type splenic monocytes and splenic monocyte-derived macrophages treated with ox-LDL (50 μg/mL, 24 h). (n = 5 per group). (E) Volcano plot for bulk RNA sequencing from samples shown in (D). (F) Heatmap for the expressions of genes for SRs, chemokine receptors, adhesion molecules, and NOX subunits of foamy monocytes and foamy macrophages from bulk RNA sequencing in (D-E). Significance was determined with a p-adjusted value of <0.05.
Fig. 5
Fig. 5
Increased NADPH Oxidase 2 (NOX2) activity stimulates macropinocytosis in monocytes. (A) THP-1 monocytes were treated with either vehicle or PMA (1 μM, 1 h–24 h). Positive control macrophages (MØ): 1 μM PMA for 7 days. Lysates were subjected to Western blot analysis for NOX2. Representative Western blot image is shown. (B) Quantification of NOX2 protein expression normalized to GAPDH. (n = 3).(C, D)Wild type splenic monocytes were treated with vehicle or PMA (1 μM, 3 h), ± DPI (5 μM, 30 min preincubation) or GSK2795039 (20 μM, 30 min preincubation) and O2⋅− production was monitored via L-012 chemiluminescence. Representative chemiluminescence signal curves are shown. SOD and CAT were used as antioxidant controls (n = 5).(E) Representative flow cytometry gating strategy. (F–H) FITC-dextran uptake after treatment as indicated in (C, D). (n = 3-5). Data are presented as means ± SD. ∗∗p<0.01; ∗∗∗p<0.001; ∗∗∗∗p<0.0001. P values were calculated using one-way ANOVA with Tukey's test for multiple comparisons.
Fig. 6
Fig. 6
Characterization of human monocyte subsets isolated from normocholesterolemic controls and hypercholesterolemic patients. (A-B) Representative flow cytometry density plots indicating relative frequencies of CD14 and CD16 expression in circulating monocytes from normocholesterolemic controls (NC) and high cholesterol (HC) patients. Results from flow cytometry experiments show relative percentage of (C) nonclassical monocytes, (D) intermediate monocytes, and (E) classical monocytes. (n = 5–9).(F) Side scatter (SSC) of total CD115+ monocytes between groups. (n = 5–9). Further analysis comparing SSC of nonclassical (G) intermediate (H) and classical (I) monocytes between groups. (n = 5–9).(J, K) Flow cytometry quantification of SSC in peripilin-2+ and perilipin-2- THP-1 monocytes. (n = 5). Data are presented as means ± SD. ∗p<0.05; ∗∗p<0.005. P values were calculated using t-test.

References

    1. Herrington W., Lacey B., Sherliker P., Armitage J., Lewington S. Epidemiology of atherosclerosis and the potential to reduce the global burden of atherothrombotic disease. Circ. Res. 2016;118:535–546. doi: 10.1161/CIRCRESAHA.115.307611. - DOI - PubMed
    1. Yu X.H., Fu Y.C., Zhang D.W., Yin K., Tang C.K. Foam cells in atherosclerosis. Clin. Chim. Acta. 2013;424:245–252. doi: 10.1016/j.cca.2013.06.006. - DOI - PubMed
    1. Gui Y., Zheng H., Cao R.Y. Foam cells in atherosclerosis: novel insights into its origins, consequences, and molecular mechanisms. Front Cardiovasc Med. 2022;9 doi: 10.3389/fcvm.2022.845942. - DOI - PMC - PubMed
    1. Ghosh S., Zhao B., Bie J., Song J. Macrophage cholesteryl ester mobilization and atherosclerosis. Vasc. Pharmacol. 2010;52:1–10. doi: 10.1016/j.vph.2009.10.002. - DOI - PMC - PubMed
    1. Silverman M.G., Ference B.A., Im K., Wiviott S.D., Giugliano R.P., Grundy S.M., Braunwald E., Sabatine M.S. Association between lowering LDL-C and cardiovascular risk reduction among different therapeutic interventions: a systematic review and meta-analysis. JAMA. 2016;316:1289–1297. doi: 10.1001/jama.2016.13985. - DOI - PubMed

Publication types

Substances