. 2025 Jan;301(1):108042.
doi: 10.1016/j.jbc.2024.108042. Epub 2024 Nov 29.

Metabolic control of luteinizing hormone-responsive ovarian steroidogenesis

Affiliations

Metabolic control of luteinizing hormone-responsive ovarian steroidogenesis

Emilia Przygrodzka et al. J Biol Chem. 2025 Jan.

Abstract

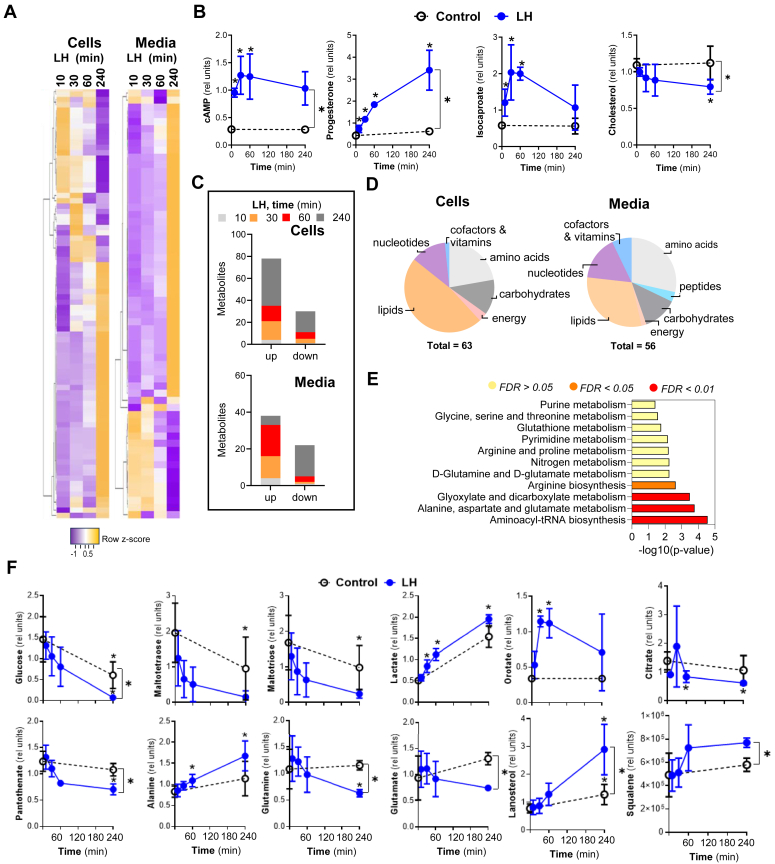
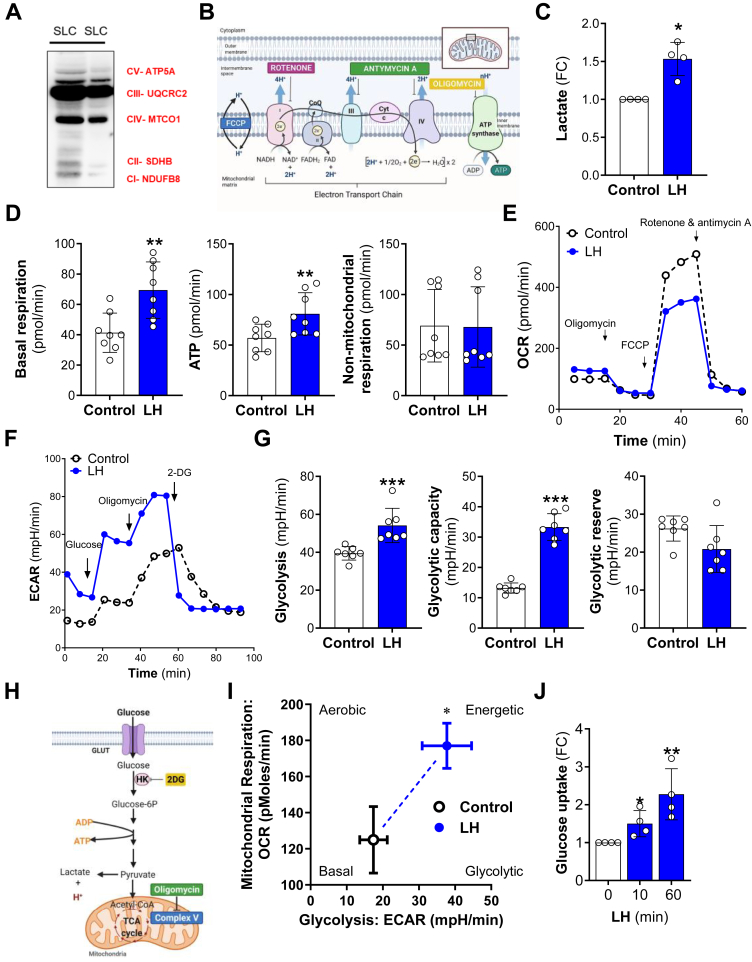
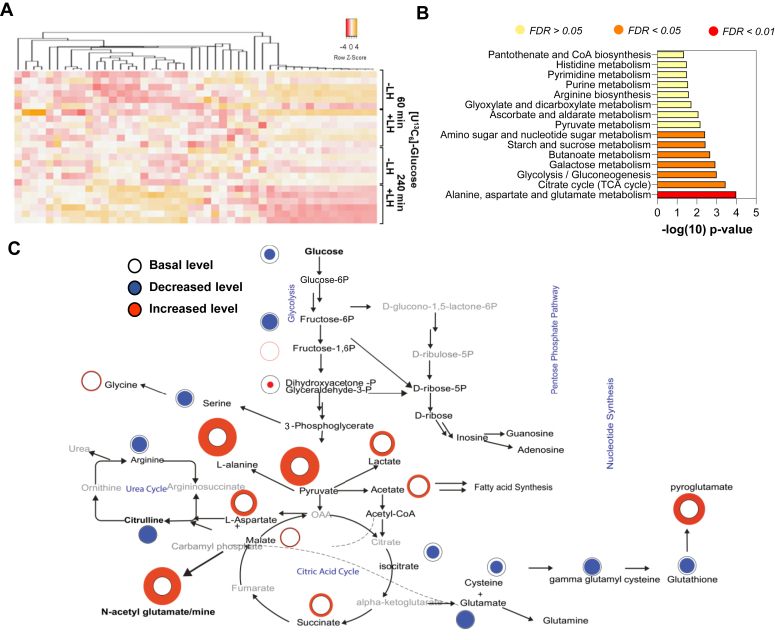
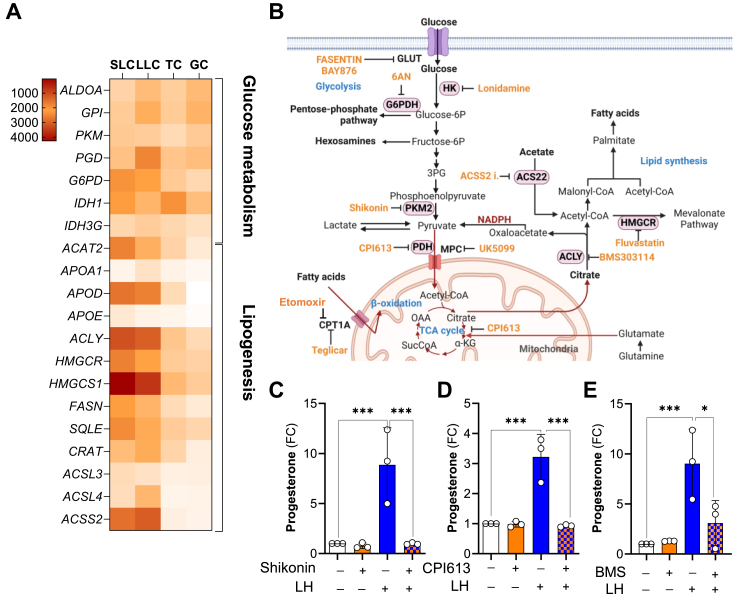
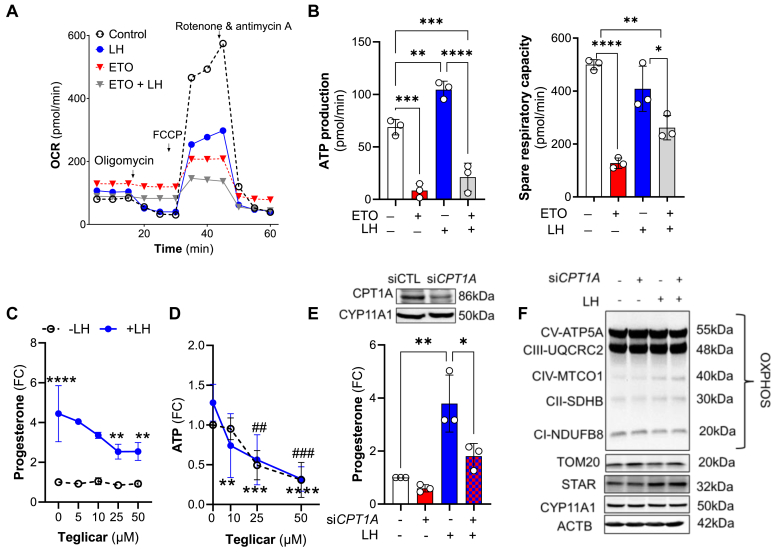
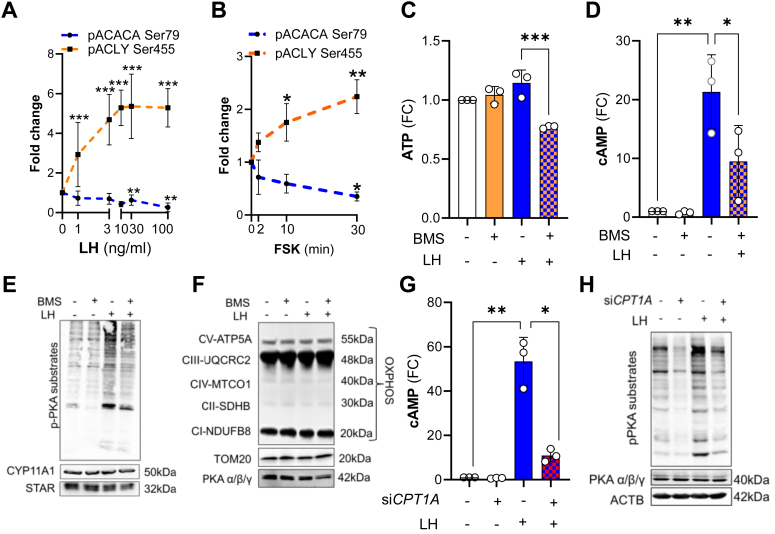
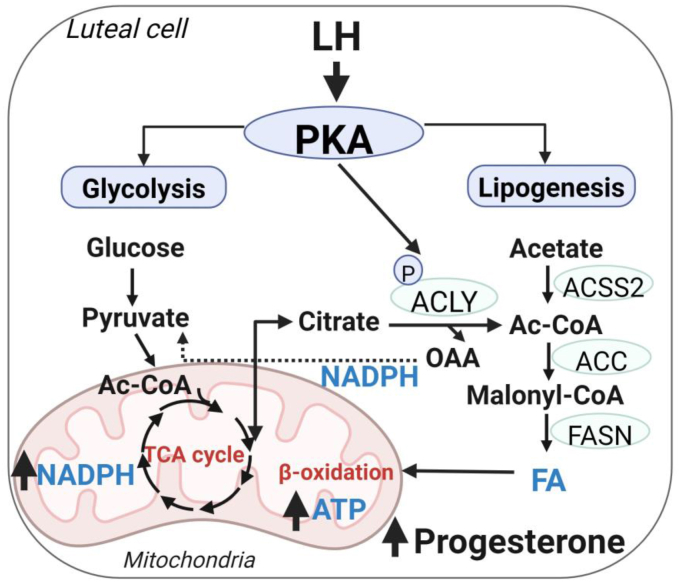
The pituitary gonadotropin luteinizing hormone (LH) is the primary stimulus for ovulation, luteal formation, and progesterone synthesis, regardless of species. Despite increased awareness of intracellular signaling events initiating the massive production of progesterone during the reproductive cycle and pregnancy, critical gaps exist in our knowledge of the metabolic and lipidomic pathways required for initiating and maintaining luteal progesterone synthesis. Using untargeted metabolomics and metabolic flux analysis in primary steroidogenic luteal cells, evidence is provided for rapid LHCGR-stimulation of metabolic pathways leading to increased glycolysis and oxygen consumption. Treatment with LH stimulated posttranslational modifications of enzymes involved in de novo lipogenesis. Mechanistic studies implicated a crucial role for de novo fatty acid synthesis and fatty acid oxidation in energy homeostasis, LHCGR/PKA signaling, and, consequently, progesterone production. These findings reveal novel hormone-sensitive metabolic pathways essential for maintaining LHCGR/PKA signaling and steroidogenesis. Understanding hormonal control of metabolic pathways in steroidogenic cells may help elucidate approaches for improving ovarian function and successful reproduction or identifying metabolic targets for developing nonhormonal contraceptives.

Keywords: G protein-coupled receptor (GPCR); cyclic AMP; lipogenesis; metabolism; ovary; progesterone; protein kinase A (PKA).


Conflict of interest statement

Conflict of interest The authors declare that they have no conflicts of interest with the contents of this article.

Figures

Figure 1
Figure 1
Luteinizing hormone (LH) stimulates acute changes in cellular lipids and glucose metabolism in luteal cells.A, heatmaps showing the most significant (≥1.5 or ≤ −1.5) time-dependent changes post-LH treatment in media and cell extracts. The heatmap was prepared using http://www.heatmapper.ca/. B, changes in cellular or media content of cyclic AMP (cAMP), progesterone, isocaproate, and cholesterol in small luteal cells treated with LH (10 ng/ml) for 0-, 10-, 30-, 60-, and 240-min. Values are presented as relative units (RU) and means ± SD, n = 3. C and D, time-dependent changes in metabolite concentrations and classes in media and cell extracts. E, metabolic pathways changed post-LH treatment. Analysis was done using MetaboAnalyst (Version 3.0, URL: http://www.metaboanalyst.ca) and the most significantly changed (≥1.5 or ≤ −1.5) metabolites in media and cell extracts. False discovery rate (FDR) presented with different colors. F, changes in cellular or media content of selected metabolites in the small luteal cells treated with LH (10 ng/ml) for 0 to 240-min. Values are presented as relative units (RU) and means ± SD, n = 3. For all graphs, ∗ indicates p < 0.05 as determined by the t test.
Figure 2
Figure 2
LH affects mitochondrial respiration and glycolysis.A, representative Western blot using a total OXPHOS antibody cocktail showing content of proteins of the electron transport chain in the small luteal cells. B, diagram presenting electron transport chain and function of inhibitors used in seahorse analysis. Mitochondrial respiration was measured as oxygen consumption rate (OCR) following a sequential addition of inhibitors of mitochondrial function: oligomycin, carbonyl cyanide-p-trifluoromethoxyphenylhydrazone (FCCP), and a combination of rotenone and antimycin A. C, lactate concentration measured in medium post seahorse analysis. Data are presented as a fold change (FC) and mean ± SD (n = 4). D, basal respiration, ATP production, and nonmitochondrial respiration in untreated (control) and LH-treated (60 min) luteal cells. Data are presented as mean ± SD (n = 3 with 2–3 technical replicate). E, representative graph showing oxygen consumption rate (OCR) in the small luteal cells treated with LH (10 ng/ml) for 60 min (blue solid line) and control cells (black dotted line). F, representative graph showing changes in extracellular acidification rate (ECAR) in the small luteal cells untreated (control) or treated with LH (10 ng/ml) for 60 min. G, glycolysis, glycolytic capacity, and glycolytic reserve in control and LH-treated (60 min) cells. Data are represented as mean ± SD (n = 3 with 2–3 technical replicate). H, diagram explaining site of action of inhibitors used in seahorse analysis. Glycolytic rate was analyzed using seahorse glycolytic rate assay. Glycolytic rate was measured as ECAR following a sequential addition of glucose, oligomycin (inhibitor of ATP synthase), and 2-deoxyglucose (2-DG; inhibitor of hexokinase- HK). I, bioenergetics phenotype of untreated (control) and LH-treated cells done basing on OCR and extracellular acidification rate (ECAR) values obtained from seahorse analysis (n = 3). J, glucose uptake assay done using luminescent method for untreated (control) and LH-treated cells for 10- and 60-min. Data are presented as a fold change (FC) and mean ± SD (n = 4). For all graphs ∗, ∗∗, and ∗∗∗, and mean significant change with p < 0.05, p < 0.01, and p < 0.001, respectively, as determined by t test or one-way ANOVA followed by Bonferroni post hoc test. LH, luteinizing hormone; OCR, oxygen consumption rate; OXPHOS, oxidative phosphorylation.
Figure 3
Figure 3
LH stimulates glucose metabolism in luteal cells. Enriched preparation of small luteal cells treated with [U13C6]-glucose (5 mM) alone or in the presence of LH (10 ng/ml) for 60- and 240-min. Cellular metabolites were analyzed by Nuclear Magnetic Resonance (NMR) spectroscopy. A, heatmap representing the most significant changes in [U13C6]-labeled metabolites. B, enrichment pathway analysis done using MetaboAnalyst (Version 3.0, URL: http://www.metaboanalyst.ca). Analysis was performed using the most significantly (p < 0.05) changed metabolites in cells and media. C, flow chart showing the most significant changes and metabolic pathways in cell extracts cultured in the presence of LH. Black, blue, and red circles represent the basic, decreased, or increased concentration of metabolites. LH, luteinizing hormone.
Figure 4
Figure 4
Glycolysis, TCA cycle, and de novo synthesis of fatty acids are vital for steroidogenic capacity of small luteal cells. Small luteal cells were pretreated with inhibitors of selected metabolic pathways for 60 min and then treated with LH (10 ng/ml) for 240 min. Progesterone concentration was measured in media samples. A, heatmap representing the expression of genes related to lipid metabolism in granulosa and theca cells (GC and TC) as well as small and large luteal cells (SLC and LLC). B, flow chart showing sequence of metabolic events occurring in cells with information of inhibited enzymes and applied inhibitors. CE, progesterone production by small luteal cells pretreated with inhibitors [PKM2-Shikonin (1 μM), PDH and KDGH-CPI613 (25 μM), or ACLY-BMS30314 (25 μm)]. Data are presented as a fold change (FC) and mean ± SD (n = 3). ∗, ∗∗∗ mean significant change with p < 0.05, p < 0.001 as determined by one-way ANOVA followed by Bonferroni post hoc test. ACLY, ATP citrate lyase; LH, luteinizing hormone; PDH, pyruvate dehydrogenase; PKM2, pyruvate kinase 2.
Figure 5
Figure 5
Endogenous fatty acids are an essential source of energy in luteal cells.A, representative graph showing oxygen consumption rate (OCR) in the small luteal cells pretreated with etomoxir (ETO; 30 μM) and then treated with LH (10 ng/ml) for 60 min. B, ATP production and spare respiratory capacity in the luteal cells pretreated with etomoxir (ETO) and then treated with LH. Data are represented as mean ± SD (n = 3). C, dose-dependent effects of CPT1A inhibitor (Teglicar; 5–100 μM) on progesterone production by untreated (control) and LH-treated small luteal cells. Data are represented as fold change (FC) and mean ± SD (n = 3–5). D, ATP production by luteal cells pretreated with CPT1A inhibitor (Teglicar; 10–50 μM) and then treated with LH (10 ng/ml) for 240 min. Data are presented as fold change and mean ± SD (n = 3–5). Asterisks ∗∗, ∗∗∗, ∗∗∗∗ mean significant change with p < 0.05, p < 0.01, and p < 0.001, respectively for cells treated with LH alone versus Teglicar + LH. Symbols ## and ### represent significant change with p < 0.01 and p < 0.01, for cells treated with Teglicar versus control (untreated). E, progesterone production by small luteal cells with knockdown CPT1A (siCPT1A; 50 nM) and treated with LH (10 ng/ml) for 240 min. Control cells were transfected with siControl (50 nM). Data are presented as a fold change (FC) and mean ± SD (n = 3). Efficiency of siRNA transfection was confirmed using Western blotting and is presented above the bar graph. F, representative blots showing content of electron transport chain (ETC) proteins in the small luteal cells with knockdown CPT1A (siCPT1A; 50 nM) and then treated with LH (10 ng/ml) for 240 min. For all graphs (AC and E) ∗, ∗∗, ∗∗∗, ∗∗∗∗ mean significant change with p < 0.05, p < 0.01, p < 0.001 and p < 0.0001. Data were analyzed by one- or two-way ANOVA followed by the Bonferroni post hoc test. CPT1A, carnitine palmitoyltransferase 1A; LH, luteinizing hormone; siRNA, silencing RNA.
Figure 6
Figure 6
LHCGR/PKA pathway triggers phosphorylation of enzymes involved in de novo lipogenesis.A, phosphorylation of ACC1 (ACACA) Ser79 and ACLY Ser455 in the small luteal cells treated with different concentrations of LH (1–100 ng/ml) for 30 min. Data are presented as fold change and mean ± SD (n = 3–5). B, phosphorylation of ACC1 Ser79 and ACLY Ser455 in the small luteal cells treated with cAMP/PKA activator-forskolin (FSK; 10 μM) for 2 to 30 min. Data are presented as a fold change (FC) and mean ± SD (n = 3). Data normalized to total protein loaded on each lane. C, ATP production in the small luteal cells pretreated with ACLY inhibitor (BMS303141; 10–50 μm) and then treated with LH (10 ng/ml) for 240 min. Data are presented as fold change (FC) and mean ± SD (n = 3). D, cyclic AMP (cAMP) production by the small luteal cells pretreated with ACLY inhibitor (BMS303141; 25 μm) and then treated with LH (10 ng/ml) for 240 min. Data are presented as fold change (FC) and mean ± SD (n = 3). E and F, representative blots showing phosphorylation of PKA substrates and content of steroidogenic proteins (STAR, CYP11A1), electron transport chain proteins or marker of mitochondria (TOM20) and PKA catalytic subunits in the small luteal cells pretreated with ACLY inhibitor (BMS303141; 25 μM) and then treated with LH (10 ng/ml) for 240 min. G, cyclic AMP (cAMP) production by the small luteal cells with knockdown CPT1A (siCPT1A; 50 nM) and then treated with LH (10 ng/ml) for 240 min. Data are presented as fold change (FC) and mean ± SD (n = 3). H, representative blots showing phosphorylation of PKA substrates and content of PKA catalytic subunits in the small luteal cells with knockdown CPT1A (siCPT1A; 50 nM) and then treated with LH (10 ng/ml) for 240 min. For all graphs ∗, ∗∗, ∗∗∗ and ∗∗∗∗ mean significant change with p < 0.05, p < 0.01, p < 0.001, and p < 0.0001. Data were analyzed by one-way ANOVA followed by the Bonferroni post hoc test. ACACA, acetyl-CoA carboxylase alpha; ACLY, ATP citrate lyase; CPT1A, carnitine palmitoyltransferase 1A; LH, luteinizing hormone; PKA, protein kinase A.
Figure 7
Figure 7
Central role for glycolysis and fatty acids in LH-responsive progesterone synthesis. LH via PKA activates metabolic pathways leading to production of acetyl-CoA (Ac-CoA) and de novo FA synthesis. Ac-CoA can be obtained from citrate or acetate via ACLY or ASCC2. FA can be used for β-oxidation and citrate can be used to produce pyruvate with simultaneous production of NADPH. Obtained energy is required for proper LHCGR/PKA signal transduction and progesterone production. ACLY, ATP citrate lyase; FA, fatt acid; LH, luteinizing hormone; PKA, protein kinase A.

Similar articles

Cited by

References

    1. Talbott H., Davis J.S. In: The Life Cycle of the Corpus Luteum. Meidan R., editor. Springer International Publishing; Cham: 2017. Lipid droplets and metabolic pathways regulate steroidogenesis in the corpus luteum; pp. 57–78.
    1. Niswender G.D., Juengel J.L., McGuire W.J., Belfiore C.J., Wiltbank M.C. Luteal function: the estrous cycle and early pregnancy. Biol. Reprod. 1994;50:239–247. - PubMed
    1. Niswender G.D., Juengel J.L., Silva P.J., Rollyson M.K., McIntush E.W. Mechanisms controlling the function and life span of the corpus luteum. Physiol. Rev. 2000;80:1–29. - PubMed
    1. Borman S.M., Chaffin C.L., Schwinof K.M., Stouffer R.L., Zelinski-Wooten M.B. Progesterone promotes oocyte maturation, but not ovulation, in nonhuman primate follicles without a gonadotropin Surge1. Biol. Reprod. 2004;71:366–373. - PubMed
    1. Robker R.L., Hennebold J.D., Russell D.L. Coordination of ovulation and oocyte maturation: a good egg at the right time. Endocrinology. 2018;159:3209–3218. - PMC - PubMed

Publication types

LinkOut - more resources