. 2024 Nov:51:100680.
doi: 10.1016/j.sste.2024.100680. Epub 2024 Aug 8.

Mapping gentrification, segregation, rental cost burden and sexually transmitted infections in Atlanta, Georgia, 2005-2018

Affiliations

Mapping gentrification, segregation, rental cost burden and sexually transmitted infections in Atlanta, Georgia, 2005-2018

Sabriya L Linton et al. Spat Spatiotemporal Epidemiol. 2024 Nov.

Abstract

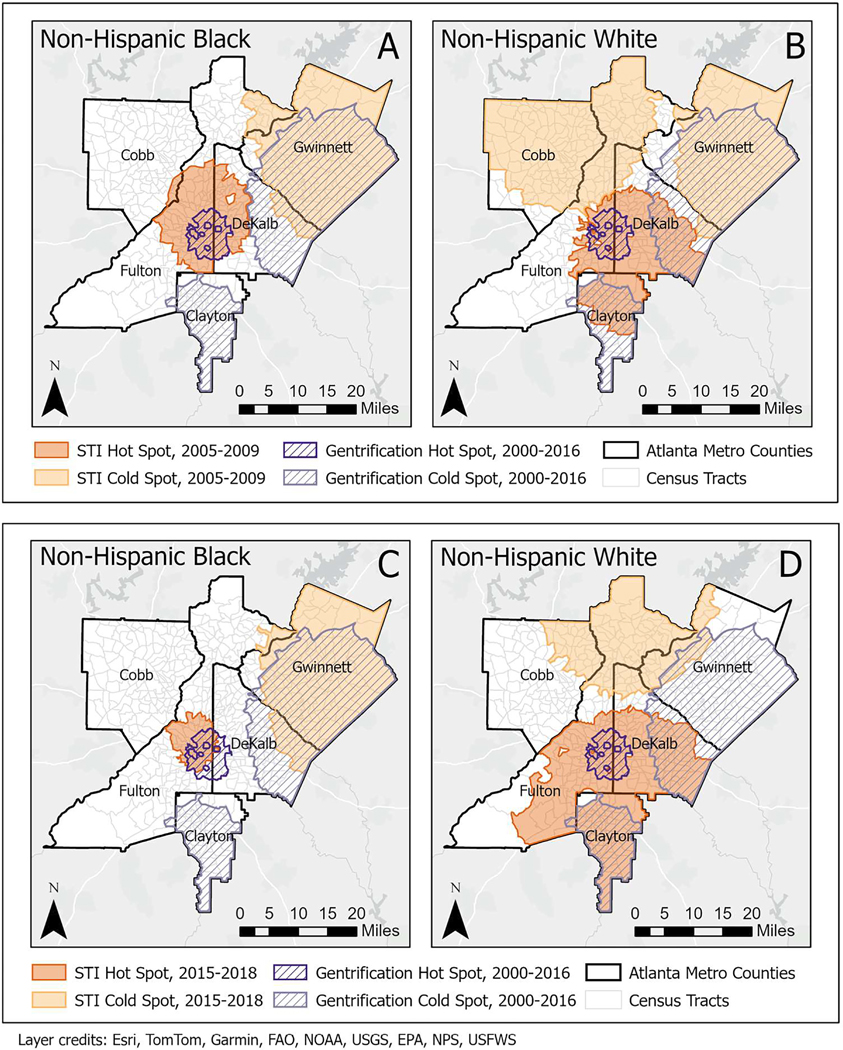
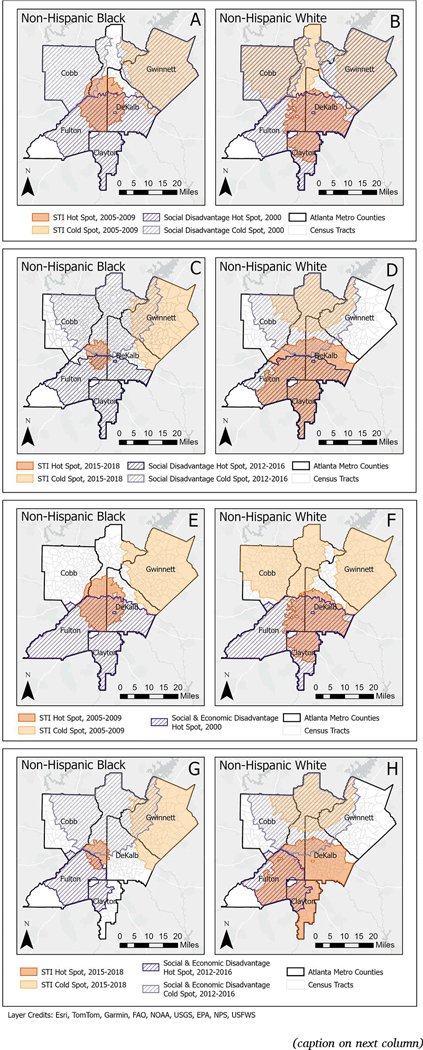
Racial disparities in sexually transmitted infections (STIs) in the United States have been linked to social inequities. Gentrification instigates population-level shifts in housing markets and neighborhood racial/ethnic composition in ways that may impact the spatial distribution of STIs. This study assessed overlap in clusters of STIs, gentrification, social and economic disadvantage, and rental cost burden in Atlanta, Georgia, between 2005 and 2018. Overlap between gentrification and STIs among Black people was greater than that observed for the overlap between gentrification and STIs among White people. Overlap of STIs with social disadvantage and rental cost burden was more prominent among White people than Black people over time. Additional investigation into the factors behind the spatial dynamics observed in this study, and explanations for their variation by race, are necessary to inform where place-based efforts are targeted to reduce racial disparities in STI transmission in gentrifying cities.

Keywords: Gentrification; Health disparities; Sexually transmitted diseases; Social polarization; Spatial statistics.


Conflict of interest statement

Declaration of competing interest The authors have no relevant financial or non-financial interests to disclose.

Figures

Fig. A1.
Fig. A1.
Maps of (a) overlap between hot spots of gentrification 2000–2016 and social disadvantage and rental cost burden in 2000 (b) overlap between cold spots of gentrification 2000–2016 and social disadvantage and rental cost burden in 2000 (c) overlap between hot spots of gentrification 2000–2016 and social disadvantage and rental cost burden in 2012–2016 (d) overlap between cold spots of gentrification 2000–2016 and social disadvantage and rental cost burden in 2012–2016.
Fig. 1.
Fig. 1.
Maps of hot spots and cold spots of sexually transmitted infections among total, Non-Hispanic Black, and Non-Hispanic White case population aged 15+ in the Atlanta, GA metro area (A) 2005–2009 and (B) 2015–2018.
Fig. 2.
Fig. 2.
Maps of overlap between hot spots and cold spots of gentrification in 2000–2016 and (A) sexually transmitted infections among Black people aged 15+ years in 2005–2009 in the Atlanta, GA metro area, B) sexually transmitted infections among White people aged 15+ years in 2005–2009 in the Atlanta, GA metro area, (C) sexually transmitted infections among Black people aged 15+ years in 2015–2018 in the Atlanta, GA metro area, and (D) sexually transmitted infections among White people aged 15+ years in 2015–2018 in the Atlanta, GA metro area.
Fig. 3.
Fig. 3.
Maps of overlap in Atlanta, GA metro area (A) hot spots and cold spots of social disadvantage in 2000 and sexually transmitted infections among Black people 15+ years in 2005–2009, (B) hot spots and cold spots of social disadvantage in 2000 and sexually transmitted infections among White people 15+ years in 2005–2009, (C) hot spots and cold spots of social disadvantage in 2012–2016 and sexually transmitted infections among Black people 15+ years in 2015–2018 (D) hot spots and cold spots of social disadvantage in 2012–2016 and sexually transmitted infections among White people 15+ years in 2015–2018 (E) hot spot of social and economic disadvantage in 2000 and sexually transmitted infections among Black people 15+ years in 2005–2009 (F) hot spot of social and economic disadvantage in 2000 and sexually transmitted infections among White people 15+ years in 2005–2009 (G) hot spots and cold spots of social and economic disadvantage in 2012–2016 and sexually transmitted infections among Black people 15+ years in 2015–2018, and (H) hot spots and cold spots of social and economic disadvantage in 2012–2016 and sexually transmitted infections among White people 15+ years in 2015–2018.
Fig. 4.
Fig. 4.
Maps of (A) overlap between hot spots and cold spots rental cost burden in 2000 and sexually transmitted infections among Black people 15+ years old in 2005–2009 (B) overlap between hot spots and cold spots rental cost burden in 2000 and sexually transmitted infections among White people 15+ years old in 2005–2009, (C) overlap between hot spots and cold spots of rental cost burden in 2012–2016 and sexually transmitted infections among Black people 15+ years old in 2015–2018, and (D) overlap between hot spots and cold spots rental cost burden in 2012–2016 and sexually transmitted infections among White people 15+ years old in 2015–2018.

References

    1. Adimora AA, Schoenbach VJ, 2005. Social context, sexual networks, and racial disparities in rates of sexually transmitted infections. J. Infect. Dis. 191 (Suppl 1), S115–S122. - PubMed
    1. Alexander M, 2011. The new JIM crow. Ohio St. J. Crim. L 9, 7.
    1. Berube A, 2018. City and Metropolitan Income Inequality Data Reveal Ups and Downs Through 2016. Brookings Institution, Washington, DC.
    1. Bhavsar NA, Kumar M, Richman L, 2020. Defining gentrification for epidemiologic research: a systematic review. PLoS ONE 15 (5), e0233361. - PMC - PubMed
    1. Biello KB, Kershaw T, Nelson R, Hogben M, Ickovics J, Niccolai L, 2012. Racial residential segregation and rates of gonorrhea in the United States, 2003–2007. Am. J. Public Health 102 (7), 1370–1377. - PMC - PubMed

LinkOut - more resources