. 2024 Nov 30;15(1):10429.
doi: 10.1038/s41467-024-54911-w.

Analysis of 1386 epileptogenic brain lesions reveals association with DYRK1A and EGFR

Affiliations

Analysis of 1386 epileptogenic brain lesions reveals association with DYRK1A and EGFR

Christian M Boßelmann et al. Nat Commun. .

Abstract

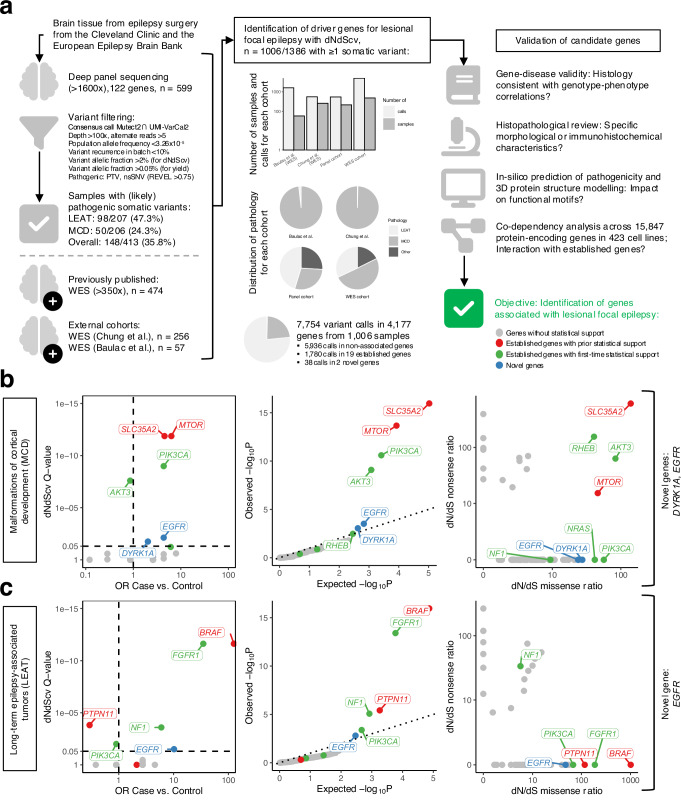
Lesional focal epilepsy (LFE) is a common and severe seizure disorder caused by epileptogenic lesions, including malformations of cortical development (MCD) and low-grade epilepsy-associated tumors (LEAT). Understanding the genetic etiology of these lesions can inform medical and surgical treatment. We conducted a somatic variant enrichment mega-analysis in brain tissue from 1386 individuals who underwent epilepsy surgery, including 599 previously unpublished individuals with ultra-deep ( > 1600x) targeted panel sequencing. Here we confirm four known associations (BRAF, SLC35A2, MTOR, PTPN11), support eight associations without prior statistical support (FGFR1, PIK3CA, AKT3, NF1, PTEN, RHEB, KRAS, NRAS), and identify novel associations for two genes, DYRK1A and EGFR. Both novel genes show specific histopathological phenotypes, interact with LFE genes and pathways, and may represent promising candidates as biomarkers and potentially druggable targets.


Conflict of interest statement

Competing interests: The authors declare no competing interests.

Figures

Fig. 1
Fig. 1. Study design and novel gene associations.
a Study overview and analysis workflow. b DYRK1A and EGFR are novel genes associated with MCD. c EGFR is a novel gene associated with LEAT. Results of the mega-analysis are shown as global dNdScv Q-values (see “Methods“) versus a gene-based collapsing test of relative enrichment (odds ratio, OR) of samples with deleterious variants in LFE versus control pathology samples (Fisher’s exact test; Supplementary Data 5a) and as distribution of observed unadjusted global P values (QQ plots). dNdScv Q-values have been adjusted for multiple testing using the Benjamini-Hochberg method. Excess driver variant ratios are shown for missense and nonsense variants for each gene, denoting if gene effects are specific to certain variant types. Category definitions for each group are given in Supplementary Data 5b.
Fig. 2
Fig. 2. In silico sequence- and structure-based analysis of variants in candidate genes.
a Variants in DYRK1A from our mega-analysis (n = 10) compared to public databases, including (likely) pathogenic (n = 24) and (likely) benign variants (n = 52) from ClinVar, and gnomAD (n = 287), across different predictors of deleteriousness (CADD_PHRED, p = 0.227, p < 0.002, p = 0.009, respectively; EVE, p = 0.103, p = 0.0011, p = 0.24, respectively; REVEL, p = 0.16, p < 0.0001, p < 0.0001, respectively) and by their distribution in missense-intolerant regions (MTR, p = 0.076, p < 0.0001, p = 0.00016, respectively). Paired one-sided Wilcoxon test: ****p < 0.0001, ***p < 0.001, **p < 0.01, *p < 0.05, ns: p > 0.05. b Variants in EGFR from our mega-analysis (n = 17) compared to public databases including (likely) pathogenic (n = 29) and (likely) benign variants (n = 10) from ClinVar, and gnomAD (n = 604), across different predictors of deleteriousness (CADD_PHRED, p = 0.003, p < 0.0001, p < 0.0001, respectively; EVE, p = 0.838, p = 0.00021, p < 0.0001, respectively; REVEL, p = 0.406, p = 0.00015, p < 0.0001, respectively) and by their distribution in missense-intolerant regions (MTR, p = 0.03, p = 003, p < 0.0001, respectively). Paired one-sided Wilcoxon test: ****p < 0.0001, ***p < 0.001, **p < 0.01, *p < 0.05, ns: p > 0.05. Data are presented as box plots that indicate median (center), and the interquartile range (IQR; bounds of box) up to 1.5 IQR (whiskers). Adjustments for multiple testing were done with the Holm-Bonferroni method. c Variants in DYRK1A mapped on the Dyrk1A structure (PDB-ID: 7FHS – chain A). Essential-3D sites are shown in pink. d Variants in EGFR mapped on protein structure fragments of the epidermal growth factor receptor (EGFR). *Variants observed in multiple samples across our cohorts. †Variants present in COSMIC at significance tiers 1–3.

References

    1. Fiest, K. M. et al. Prevalence and incidence of epilepsy: A systematic review and meta-analysis of international studies. Neurology88, 296–303 (2017). - PMC - PubMed
    1. Ben-Menachem, E., Schmitz, B., Kälviäinen, R., Rhys, T. & Klein, P. The burden of chronic drug-refractory focal onset epilepsy: Can it be prevented? Epilepsy Behav.148, 109435 (2023). - PubMed
    1. Blumcke, I. et al. Histopathological findings in brain tissue obtained during epilepsy surgery. N. Engl. J. Med.377, 1648–1656 (2017). - PubMed
    1. Najm, I. et al. The ILAE consensus classification of focal cortical dysplasia: An update proposed by an ad hoc task force of the ILAE diagnostic methods commission. Epilepsia63, 1899–1919 (2022). - PMC - PubMed
    1. Oegema, R. et al. International consensus recommendations on the diagnostic work-up for malformations of cortical development. Nat. Rev. Neurol.16, 618–635 (2020). - PMC - PubMed

Publication types

MeSH terms

LinkOut - more resources