. 2024 Nov 30;10(1):228.
doi: 10.1038/s41531-024-00836-6.

Molecular and cellular determinants of L-Dopa-induced dyskinesia in Parkinson's Disease

Affiliations

Molecular and cellular determinants of L-Dopa-induced dyskinesia in Parkinson's Disease

Federica Servillo et al. NPJ Parkinsons Dis. .

Abstract

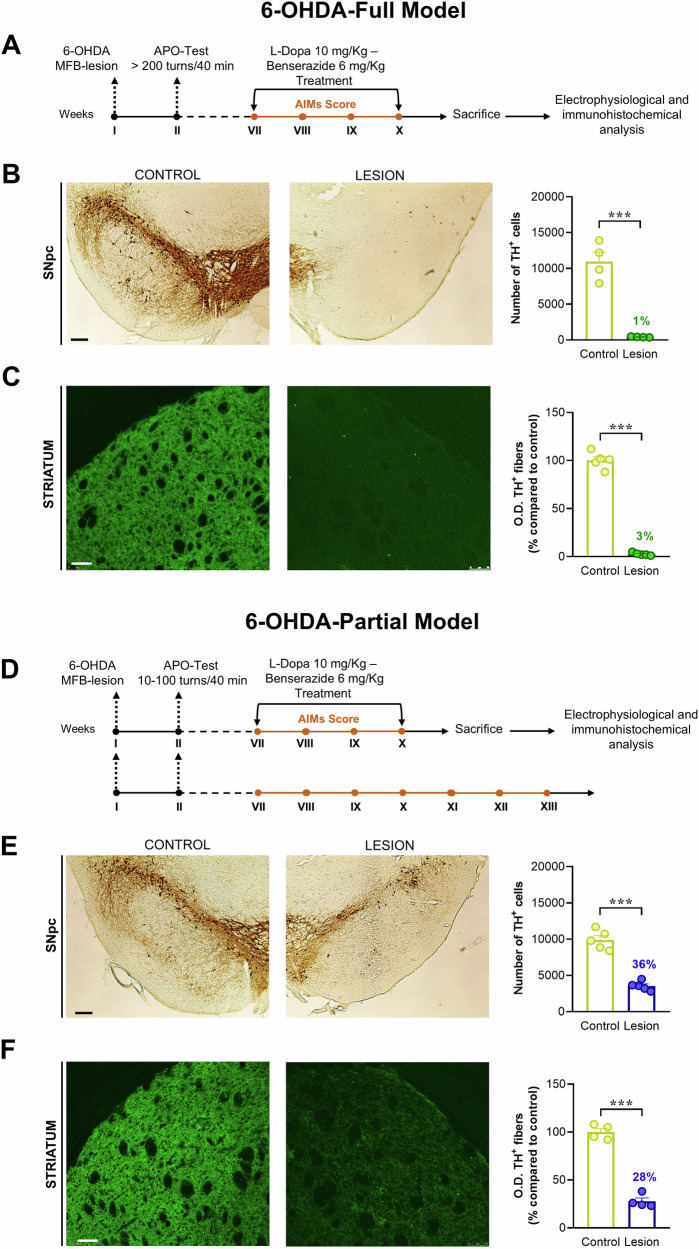
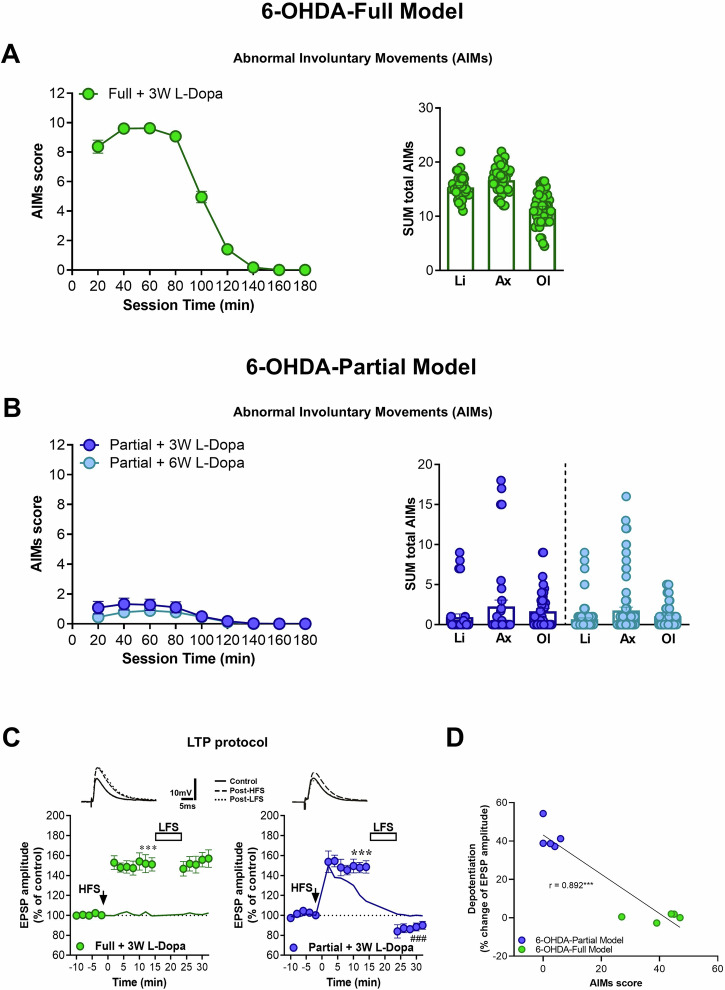
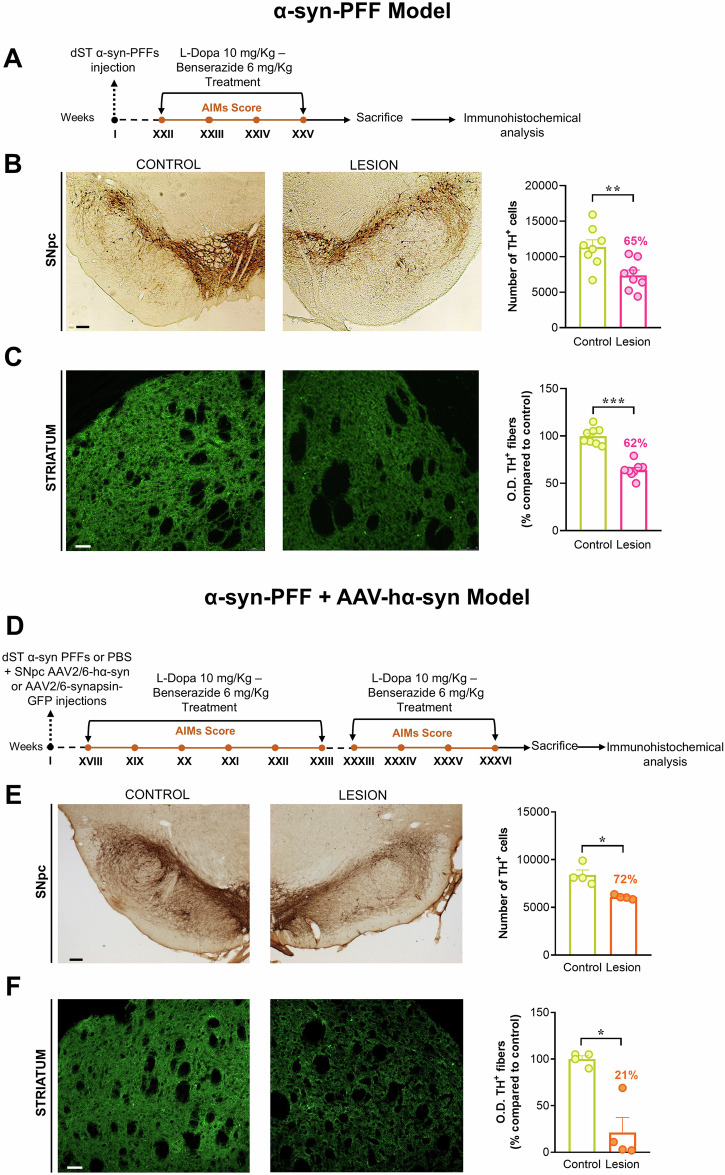
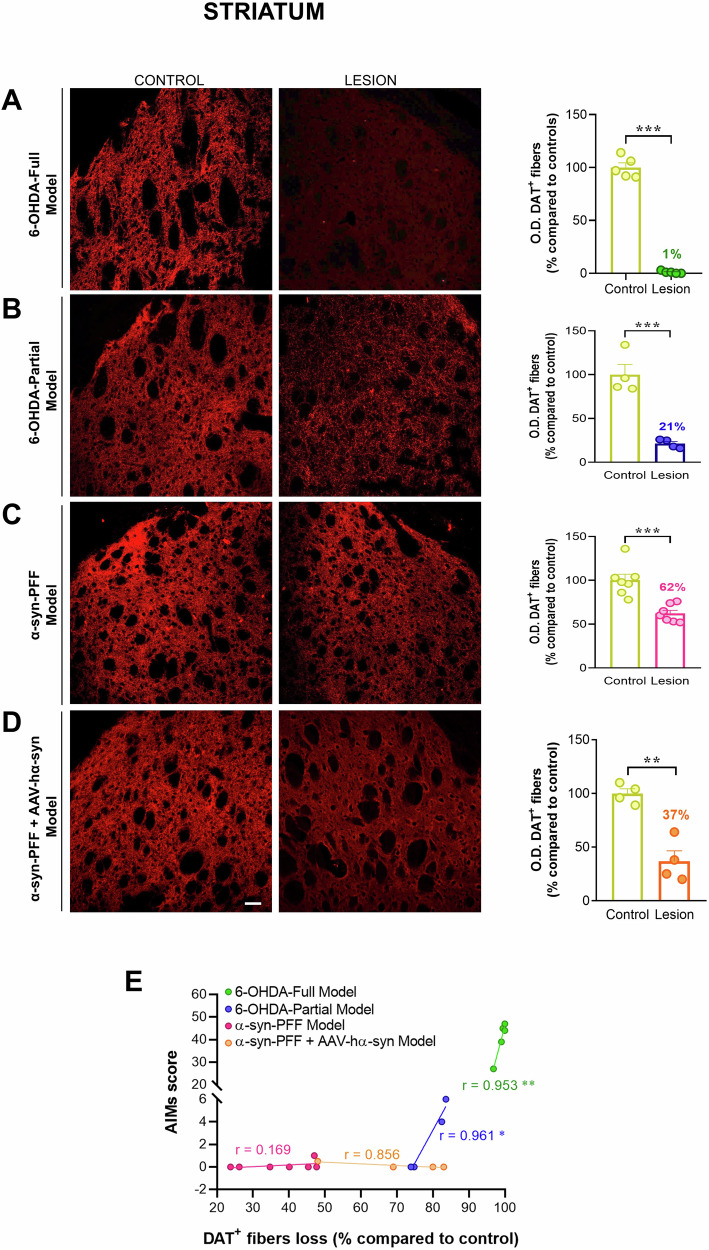
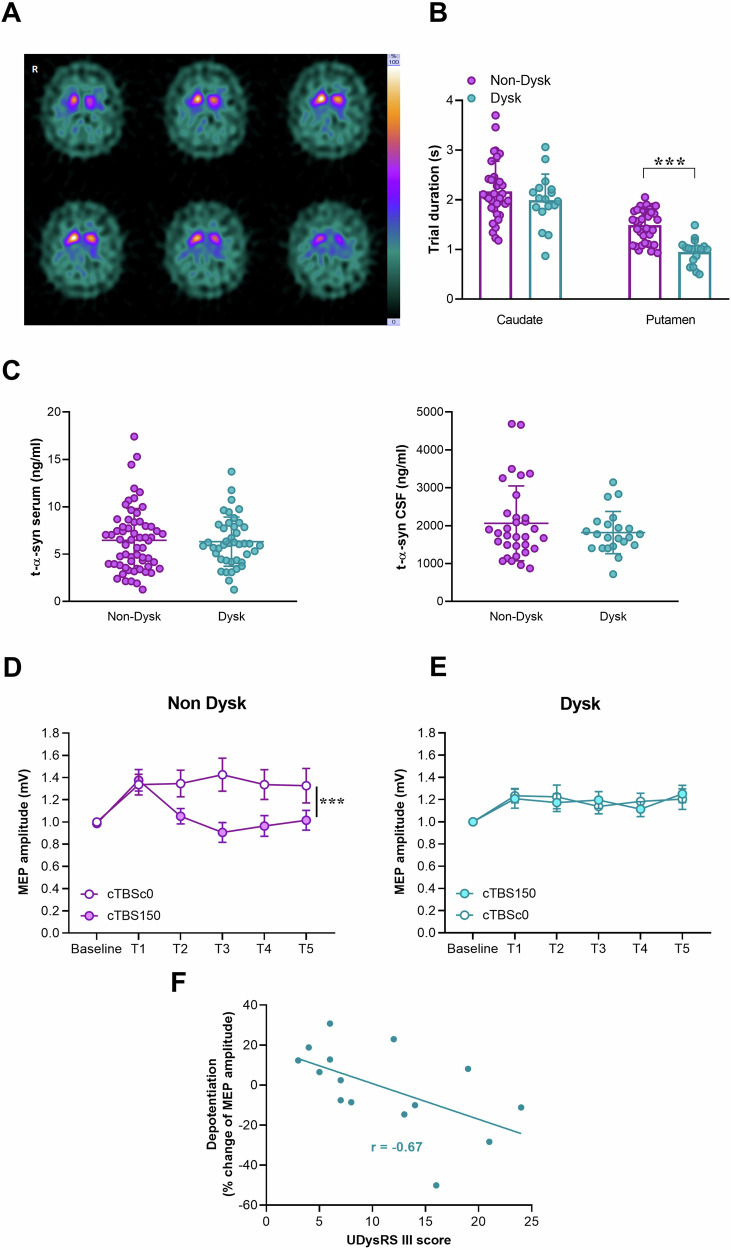
Treatment with L-3,4-dihydroxyphenylalanine (L-Dopa) compensates for decreased striatal dopamine (DA) levels and reduces Parkinson's disease (PD) symptoms. However, during disease progression, L-Dopa-induced dyskinesia (LID) develops virtually in all PD patients, making the control of PD symptoms difficult. Thus, understanding the mechanisms underlying LID and the control of these motor abnormalities is a major issue in the care of PD patients. From experimental and clinical studies, a complex cascade of molecular and cellular events emerges, but the primary determinants of LID are still unclear. Here, with a translational approach, including four animal models and a wide cohort of PD patients, we show that striatal DA denervation is the major causal factor for the emergence of LID, while α-synuclein aggregates do not seem to play a significant role. Our data also support the concept that maladaptive basal ganglia plasticity is the main pathophysiological mechanism underlying LID.


Conflict of interest statement

Competing interests: The authors declare no competing interests.

Figures

Fig. 1
Fig. 1. 6-OHDA Models.
A Scheme representing the timeline of the experimental procedures. Rats were unilaterally injected in the left hemisphere with 6-OHDA in the MFB. After 2 weeks from the injection, rats were subjected to an apomorphine test (APO-Test). Fully-lesioned (Full) animals were treated for 3 weeks with L-Dopa.  Twenty min after the last L-Dopa treatment, rats were sacrificed for electrophysiological and immunohistochemical analysis. B Quantification of the number of TH+ cells in the SNpc after 3 weeks of L-Dopa treatment in the contralateral (Control) and ipsilateral (Lesion) hemispheres to the lesion (n = 4 rats; unpaired t-test Lesion vs. Control; t = 8.029, df = 6, ***P < 0.001). C Optical density (O.D.) of TH+ fibers in the contralateral and ipsilateral striatum after L-Dopa treatment (n = 5 rats; unpaired t-test Lesion vs. Control; t = 24.95, df = 8, ***P < 0.001). D Experimental plan of the procedures. Rats were unilaterally injected in the left hemisphere with 6-OHDA in the MFB. After 2 weeks from the injection, rats were subjected to an apomorphine test. Partially-lesioned (Partial) animals were divided into two groups: the first group was subjected to L-Dopa for 3 weeks, while the second group was treated for 6 weeks. Twenty min after the last L-Dopa administration, animals were sacrificed for electrophysiological and immunohistochemical analysis. E Quantification of the number of TH+ cells in the SNpc after L-Dopa treatment in the contralateral (Control) and ipsilateral (Lesion) hemispheres to the lesion (n = 5 rats; unpaired t-test Lesion vs. Control; t = 9.596, df = 8, ***P < 0.001). F Optical density of TH+ fibers in the contralateral and ipsilateral striatum of the lesion after L-Dopa treatment (n = 4 rats; unpaired t-test Lesion vs. Control; t = 13.93, df = 6, ***P < 0.0001).
Fig. 2
Fig. 2. AIMs score and synaptic plasticity in 6-OHDA Models.
A Left: AIMs scores analysis of all session times. Right: evaluation of AIMs distinct components, limb, axial and orolingual. B AIMs scores analysis of Partial rats 3 W (dark blue circle) and Partial rats 6 W (light blue circle) treated with L-Dopa (Two-way ANOVA Partial rats 3 W vs. Partial rats 6 W, Interaction: F(8,1197) = 1.170, P > 0.05 Bonferroni’s post-hoc test). Right: evaluation of AIMs distinct components in both experimental groups (unpaired t-test for limb, axial and orolingual of Partial rats 3 W vs. Partial rats 6 W, P > 0.05). C Effect of L-Dopa treatment on corticostriatal LTP and synaptic depotentiation of SPNs. Left: Time course of EPSPs amplitude in response to HFS (n = 6, paired t-test pre- vs. post‐HFS, t = 8.671, df = 9, ***P < 0.001) and LFS (n = 6, paired t-test post‐HFS vs. post‐LFS, t = 1.013, df = 6, P > 0.05) protocols in Full +3W L-Dopa (green circle). Green solid line shows EPSPs amplitude in response to HFS in SPNs of Full model without treatment (C) Right: Time course of EPSPs amplitude in response to HFS (n = 5, paired t-test pre- vs. post‐HFS, t = 12.190, df = 9, ***P < 0.0001) and LFS (n = 5, paired t-test post‐HFS vs. post‐LFS, t = 11.570, df = 7, ###P < 0.0001) protocols. The blue solid line shows EPSP amplitude in response to HFS in SPNs of the Partial model without treatment. Representative traces of EPSPs from SPNs before (baseline) and after HSF and LFS. The scale bar is 5 ms/10 mV for all traces. D Linear regression and correlation analysis between the depotentiation, expressed as % change of EPSP amplitude and AIMs score (Coefficients of correlation: r = 0.892, F (1,8) = 65.88, ***P < 0.001) in 6-OHDA- Full and -Partial Models following a chronic 3 week L-Dopa administration.
Fig. 3
Fig. 3. A-syn-based Model.
A Scheme representing the experimental setting. Rats were unilaterally injected in the left hemisphere with α-syn-PFFs in the dorsal striatum (dST). After 22 weeks, animals were treated with L-Dopa for 3 weeks. Twenty min after the last L-Dopa administration, animals were sacrificed for immunohistochemical analysis. B Quantification of the number of TH+ cells in the SNpc after 3 weeks of L-Dopa treatment in the contralateral (Control) and ipsilateral (Lesion) hemispheres to the lesion (n = 8 rats; unpaired t-test Lesion vs. Control; t = 3.230, df = 14, **P < 0.01). C Optical density of TH+ fibers in the contralateral and ipsilateral striatum of the lesion after L-Dopa treatment (n = 8 rats; unpaired t-test Lesion vs. Control; t = 10.26, df = 14, ***P < 0.001). D Experimental design and timeline. Rats were injected in dST with the α-syn-PFFs or PBS and into the SNpc with AAV2/6-hα-syn or AAV2/6-synapsin-GFP. At 18- and 33 weeks post-surgery, animals were treated with L-Dopa twice daily for 5 and 3 weeks, respectively. Rats were sacrificed at 36 weeks of surgery for immunohistological analysis. E Left, representative coronal brain images of TH-immunostained SNpc of Control (PBS + AAV2/6-synapsin-GFP-injected) and Lesion (α-syn-PFF + AAV2/6-hα-syn-injected) groups. Right, the stereological cell counts plot shows a significant reduction of SNpc TH+ neurons (n = 4 rats; unpaired t-test Lesion vs. Control; t = 4.339, df = 3.26, *P < 0.05). F Left, coronal brain images of the TH-immunostained dST of Control and α-syn-PFF + AAV-hα-syn injected (Lesion) rats. Scale bar, 50 µm. Right, quantification of TH- immunoreactivity in the dST (n = 4 rats; unpaired t-test Lesion vs. Control; t = 4.793, df = 3.29, *P < 0.05). Data are presented as mean ± SEM of the optical density as a percentage of the control group.
Fig. 4
Fig. 4. Striatal DAT immunoreactivity in parkinsonian models.
Left, confocal images of coronal brain sections showing DAT-immunostaining in the dST of Full (A), Partial (B), α-syn-PFF (C) and α-syn-PFF + AAV-hα-syn (D) models. Scale bar, 50 µm. Right, quantification of DAT immunoreactivity in the dST of all experimental groups (unpaired t-test Lesion vs. Control, Full (n = 5 rats): t = 22.36, df = 8, ***P < 0.0001, Partial (n = 4 rats): t = 6.619, df = 6, ***P < 0.001, α-syn-PFF (n = 7 rats): t = 5.221, df = 13, ***P < 0.001 and α-syn-PFF + AAV-hα-syn (n = 4 rats): t = 5.80, df = 6, **P < 0.01). Data are presented as mean ± SEM of the optical density as a percentage of the Control. E Linear regression of XY pairs describes the correlation between DAT+ terminals in dST and AIMs score (Coefficients of correlation: 6-OHDA Full Model r = 0.953, F(1,3) = 61.23, **P < 0.01; 6-OHDA Partial Model r = 0.961, F(1,2) = 48.83; *P < 0.05; α-syn-PFF Model r = 0.169, F(1,5) = 1.013 and α-syn-PFF + AAV-hα-syn Model r = 0.856, F(1,2) = 11.88, both P > 0.05).
Fig. 5
Fig. 5. Findings in PD patients.
A Example of 123I-FP-CIT (DaTSCAN) SPECT imaging in a patient with PD who developed LID. R indicates the right side of the brain. The bar on the right side shows the color scale used for the uptake values (white 100%, on top, and black 0% on the bottom). In the six cuts, the asymmetrically reduced striatal uptake values are shown. B Differences in the putamen and caudate uptake values in dyskinetic (Dysk) and non-dyskinetic (Non-Dysk) patients (unpaired t-test Non-Dysk vs. Dysk DaTSCAN: Putamen, t = 5.863, df = 48, ***P < 0.001 and Caudate, t = 1.02, df = 48, P > 0.05). C Patients with and without LID share similar values of total-α-syn in serum (unpaired t-test Non-Dysk vs. Dysk, t = 0.271, df = 102, P > 0.05), and CSF (unpaired t-test Non-Dysk vs. Dysk, t = 0.306, df = 52, P > 0.05). D In Non-Dysk patients, cTBSc0 facilitates motor evoked potentials. cTBS150 given at 1 min after cTBSc0 reverses the potentiation following cTBSc0 by returning it to baseline level. Error bars refer to the standard error of the measurements (Two-way ANOVA of the time points after application of cTBS150: F3.93 = 24.74, P < 0.001). MEPs size was assessed after the end of TBS and every 5 min for 20 min after the end of TBS (respectively T1, T2, T3, T4 and T5). E In Dysk patients, cTBSc0 facilitates motor evoked potentials, while cTBS150 given at 1 min after cTBSc0 does not modify the facilitation produced by cTBSc0. Error bars refer to the standard error of the measurements (Two-way ANOVA of the time points after application of cTBS150: F3.93 = 0.006, P = 0.9). MEPs size was assessed after the end of TBS and every 5 min for 20 min after the end of TBS (respectively T1, T2, T3, T4 and T5). F The amount of depotentiation induced with cTBS150 given at 1 min after cTBSc0 (measured as percent change of normalized motor evoked potential -MEP- amplitudes between T1 and time points after cTBS150) inversely correlates to patients’ clinical dyskinesia scores (part III-UDysRS). Patients with more severe dyskinesia (higher scores) undergo lower depotentiation following cTBS150 than patients with less severe dyskinesia (lower scores).

References

    1. Poewe, W. et al. Parkinson disease. Nat. Rev. Dis. Primers3, 17013 (2017). - PubMed
    1. Spillantini, M. G. et al. Alpha-synuclein in Lewy bodies. Nature388, 839–840 (1997). - PubMed
    1. Calabresi, P., Di Lazzaro, G., Marino, G., Campanelli, F. & Ghiglieri, V. Advances in understanding of the function of alpha-synuclein: implications for Parkinson’s disease. Brain146, 3587–3597 (2023). - PMC - PubMed
    1. Bastide, M. F. et al. Pathophysiology of L-dopa-induced motor and non-motor complications in Parkinson’s disease. Prog. Neurobio.l132, 96–168 (2015). - PubMed
    1. Ahlskog, J. E. & Muenter, M. D. Frequency of levodopa-related dyskinesias and motor fluctuations as estimated from the cumulative literature. Mov. Disord.16, 448–458 (2001). - PubMed

LinkOut - more resources