

The timing of marine heatwaves during the moulting cycle affects performance of decapod larvae
- PMID: 39616196
- PMCID: PMC11608274
- DOI: 10.1038/s41598-024-81258-5
The timing of marine heatwaves during the moulting cycle affects performance of decapod larvae
Abstract
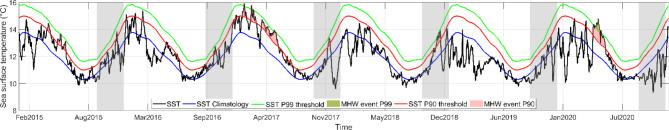
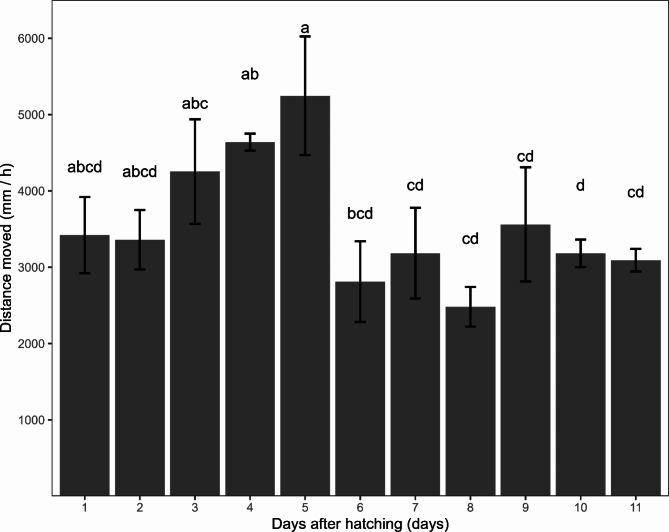
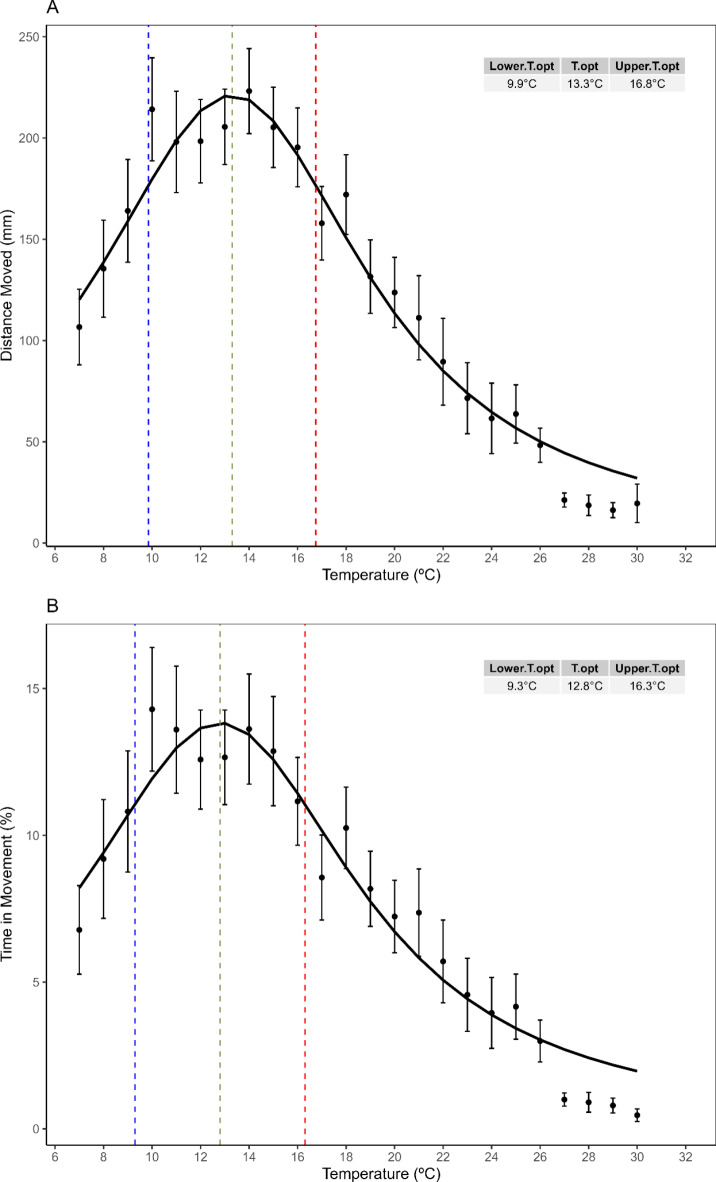
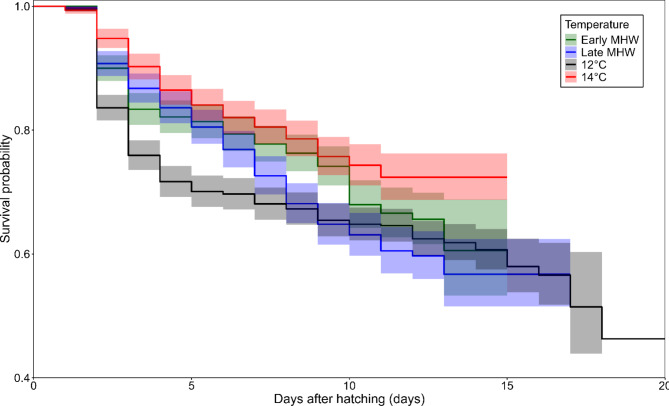
Marine heatwaves (MHW) pose an increasing threat and have a critical impact on meroplanktonic organisms, because their larvae are highly sensitive to environmental stress and key for species' dispersion and population connectivity. This study assesses the effects of MHW on two key moulting cycle periods within first zoea of the valuable crab, Metacarcinus edwardsii. First, the changes in swimming behaviour during zoea I were recorded and associated to moult cycle substages. Then, larvae were exposed during the zoea I to (1) control temperature of 12 °C, (2) Early MHW, occurring in intermoult, (3) Late MHW, occurring in premoult and (4) 14 °C, representing MHW during whole development. Additionally, optimum temperature was estimated from thermal performance curves through swimming behaviour of one-day zoea I. The timing of the MHW within the moulting cycle significantly affects larval fitness. Early MHW led to improved survival rates (72%) and reduced developmental times (9.8 days) compared to those exposed to Later MHW (63% and 10.3 days, respectively). As optimum temperature was higher than 12 °C, MHW events maybe favouring larval performance. These results highlight the importance of interaction between the moult cycle and environmental variables as a factor of sublethal effects on population dynamics.
© 2024. The Author(s).
Conflict of interest statement
Declarations. Competing interests: The authors declare no competing interests.
Figures
References
-
- Hobday, A. J. et al. A hierarchical approach to defining marine heatwaves. Prog. Oceanogr.141, 227–238 (2016). - DOI
-
- Kikuchi, E., De Grande, F. R., Duarte, R. M. & Vaske-Júnior, T. Thermal response of demersal and pelagic juvenile fishes from the surf zone during a heat-wave simulation. J. Appl. Ichthyol.35, 1209–1217 (2019). - DOI
-
- IPCC. 2019: IPCC Special Report on the Ocean and Cryosphere in a Changing Climate (eds. Pörtner, H.-O., Roberts, D.C., Masson-Delmotte, V., Zhai, P., Tignor, M., Poloczanska, E., Mintenbeck, K., Alegría, A., Nicolai, M., Okem, A., Petzold, J., Rama, B. & Weyer, N.M.) 755 (Cambridge University Press, 2019). 10.1017/9781009157964.
MeSH terms
Grants and funding
LinkOut - more resources
Full Text Sources
Research Materials
