. 2024 Nov 30;15(1):10438.
doi: 10.1038/s41467-024-54762-5.

TRIM7 ubiquitinates SARS-CoV-2 membrane protein to limit apoptosis and viral replication

Affiliations

TRIM7 ubiquitinates SARS-CoV-2 membrane protein to limit apoptosis and viral replication

Maria Gonzalez-Orozco et al. Nat Commun. .

Abstract

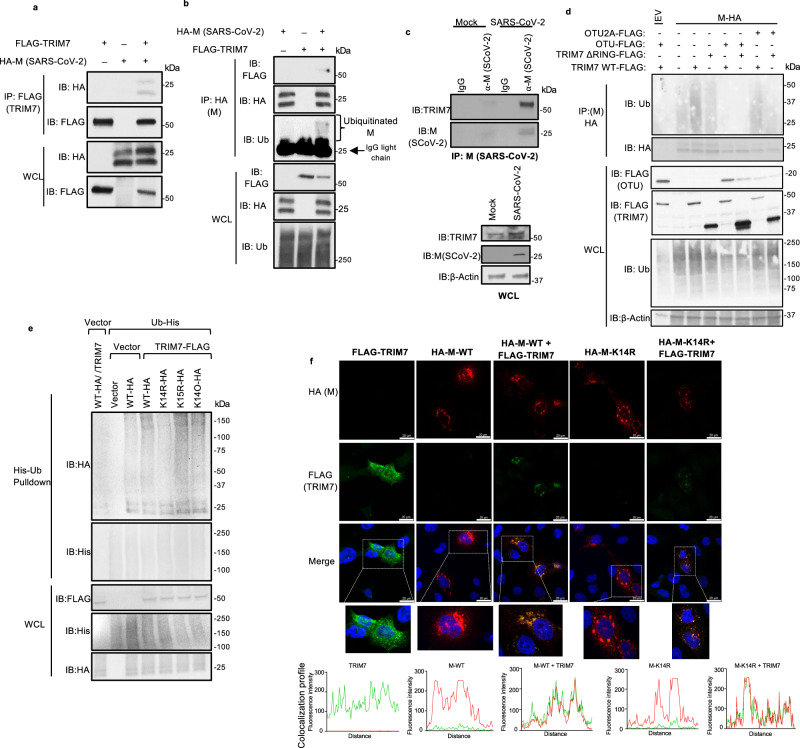
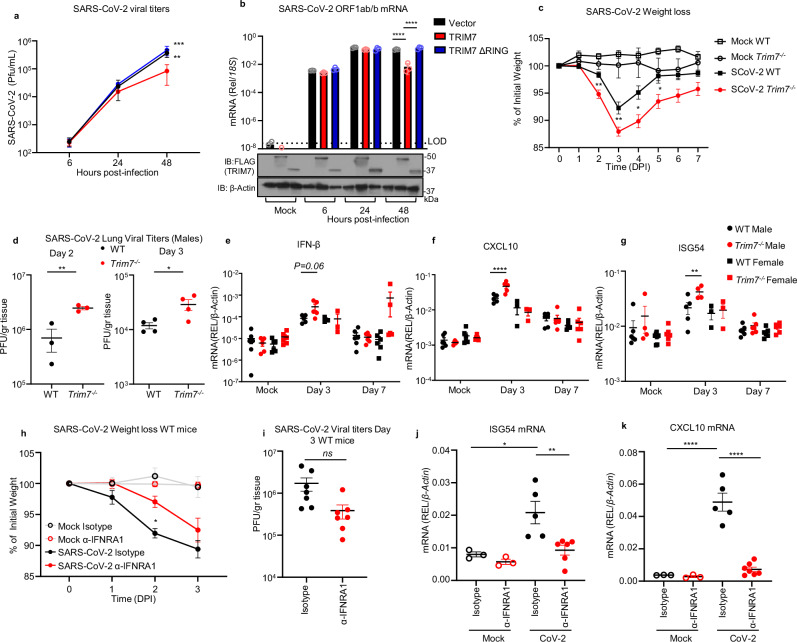
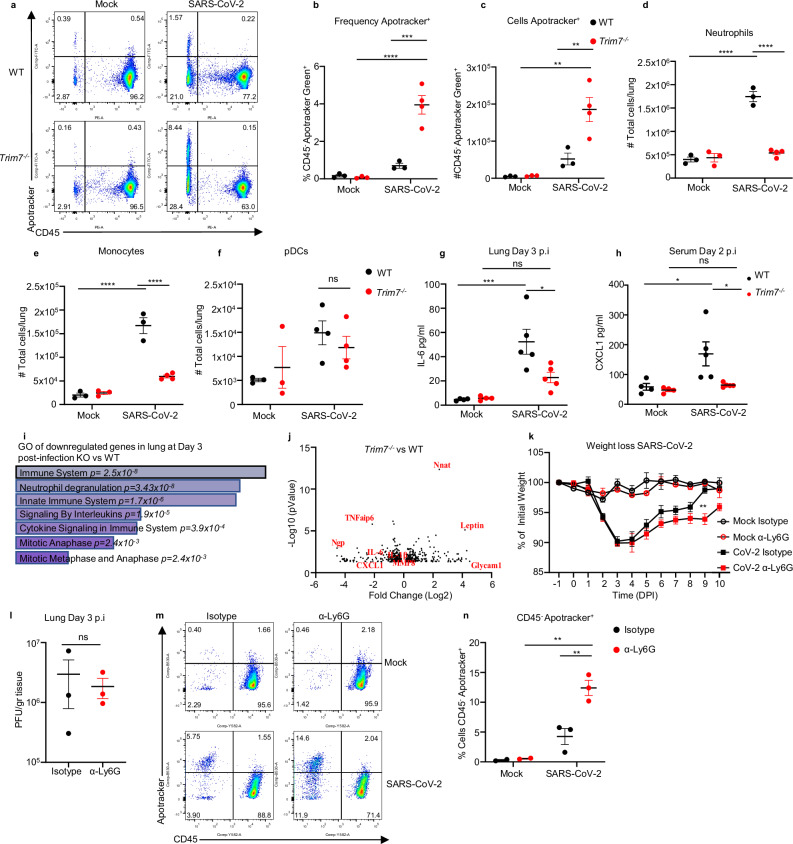
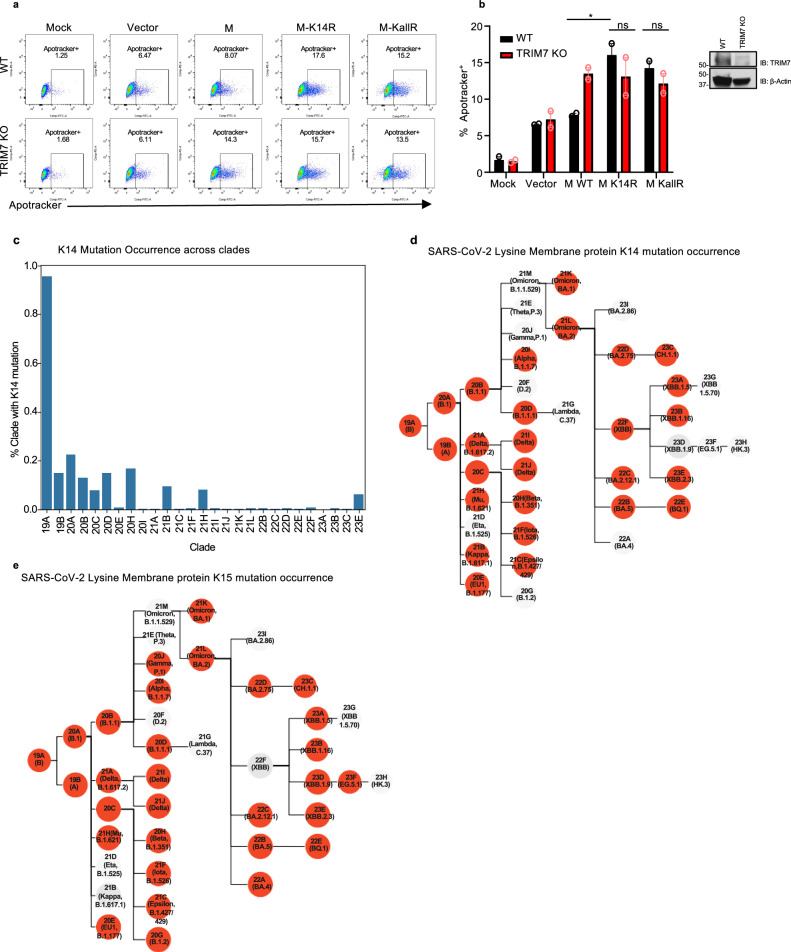
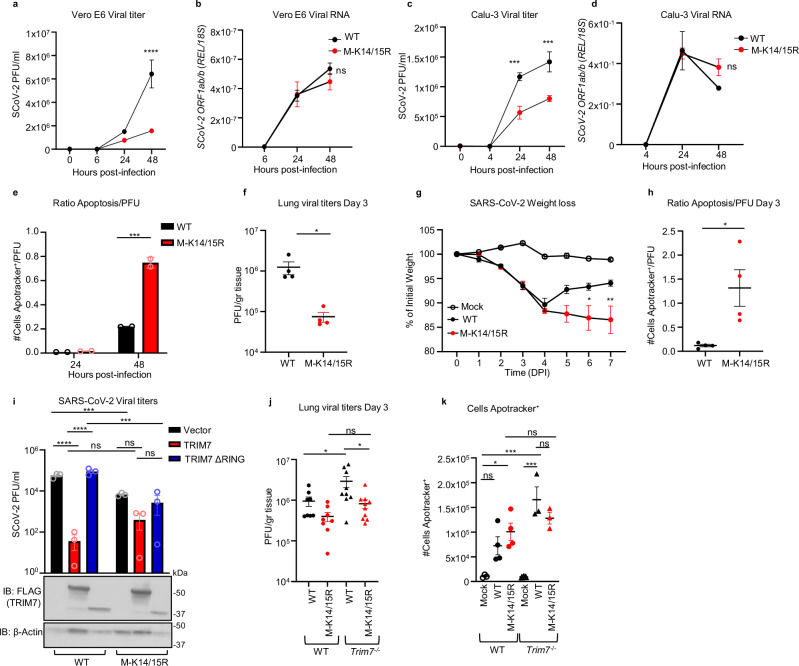
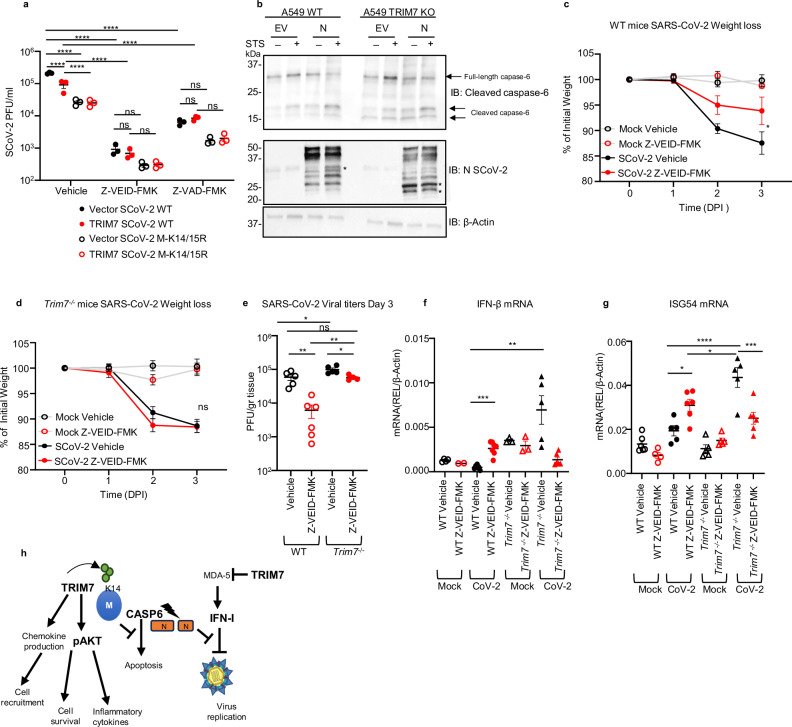
SARS-CoV-2 is a highly transmissible virus that causes COVID-19 disease. Mechanisms of viral pathogenesis include excessive inflammation and viral-induced cell death, resulting in tissue damage. Here we show that the host E3-ubiquitin ligase TRIM7 acts as an inhibitor of apoptosis and SARS-CoV-2 replication via ubiquitination of the viral membrane (M) protein. Trim7-/- mice exhibit increased pathology and virus titers associated with epithelial apoptosis and dysregulated immune responses. Mechanistically, TRIM7 ubiquitinates M on K14, which protects cells from cell death. Longitudinal SARS-CoV-2 sequence analysis from infected patients reveal that mutations on M-K14 appeared in circulating variants during the pandemic. The relevance of these mutations was tested in a mouse model. A recombinant M-K14/K15R virus shows reduced viral replication, consistent with the role of K15 in virus assembly, and increased levels of apoptosis associated with the loss of ubiquitination on K14. TRIM7 antiviral activity requires caspase-6 inhibition, linking apoptosis with viral replication and pathology.


Conflict of interest statement

Competing interests: The authors declare no competing interests.

Figures

Fig. 1
Fig. 1. TRIM7 ubiquitinates SARS-CoV-2 Membrane protein.
a, b HEK293T cells were transfected with vector, M-HA, ±TRIM7 WT-FLAG, and immunoprecipitated using anti-FLAG beads (a) or anti-HA beads (b). c Immunoprecipitation of M protein of SARS-CoV-2 (SCoV-2) from Calu-3 cells infected with SARS-CoV-2 MOI 1 for 24 h using anti-M SCoV-2 or IgG control. d HEK293T cells transfected with M-HA, of TRIM7 WT-FLAG or TRIM7-ΔRING-FLAG (TRIM7 lacking the RING domain) ±OTU-WT-FLAG or OTU-2A-FLAG followed by immunoprecipitation with anti-HA beads, e denaturing pulldown using NiNTA beads. HEK293T cells transfected with 100 ng of His-Ub, M-WT-HA, M-K14R, M-K15R, M-K14O (all Ks mutated to Rs except for K14), +/- TRIM7 WT-FLAG. f Confocal microscopy of Hela cells transfected with TRIM7-FLAG (488), M-WT-HA or M K14R-HA (555), for 24 h. Colocalization profile graphs are shown. Data are representative of 2 independent experiments with at least 4 micrographs per condition. All western blot panels are representative of at least two independent experiments. Ub Ubiquitin, OTU ovarian tumor deubiqitinase. Source data are provided in the Source data file.
Fig. 2
Fig. 2. TRIM7 has antiviral activity during SARS-CoV-2 infection.
a, b HEK293T-hACE-2 cells were transfected with 200 ng of TRIM7 WT or TRIM7-ΔRING followed by infected with SARS-CoV-2 (MOI 0.1). Viral titers quantified by plaque assay (a) or viral RNA by qPCR (b). Bottom (b) shows immunoblot control for TRIM7 expression. Two-way ANOVA Tukey’s multiple comparisons (**p = 0.0038, ***p = 0.0001, ****p < 0.0001). c C57BL/6NJ WT (n = 18, 9 females, 9 males) and Trim7−/− mice (n = 23, 10 females, 13 males) infected with maSARS-CoV-2 (1 × 106 PFU). Weight loss (c) data were from three combined independent experiments and multiple T-test (**p = 0.001, p = 0.003, *p = 0.005). d Viral titers (day 2, n = 3 males and day 3, n = 4 males per group). Two-tailed T-test (**p = 0.0083, *p = 0.03). e IFN-β gene expression in lung tissue by qPCR (n = 5 male day 3, 6 male day 7, and 3 female per infected group, mock n = 3 male and 3 female). f CXCL10 (same animal number as in (e). g ISG54 (mice numbers as in e, except for day 3, n = 5 WT and 4 Trim7−/− male). Two-way ANOVA Tukey’s multiple comparisons (****p < 0.0001, *p = 0.026). hk IFNAR1 blockade: C57BL/6J WT (n = 7/group five females and two males) were treated with anti-IFNRA1 or isotype 24 h before infection with maSARS-CoV-2 (1×10⁶ PFU). h Weight loss, two-way ANOVA Tukey’s multiple comparisons (*p = 0.023), i viral titers in the lung. j ISG54 gene expression by qPCR (n = 5 isotype, 6 α-IFNRA1 *p = 0.01, **0.009). k CXCL10 gene expression, one-way ANOVA Tukey’s multiple comparisons (n = 5 isotype, 7 α-IFNRA1, ****p < 0.0001). DPI days post infection, α-IFNRA1 anti-IFNRA1. Data were depicted as mean + SEM. Source data are provided in the Source data file.
Fig. 3
Fig. 3. Trim7−/− mice have impaired innate immune response to SARS-CoV-2 infection.
aj Male C57BL/6NJ WT and Trim7/ mice were infected with maSARS-CoV-2 (WT n = 3, KO n = 4). On day 3 post infection, lung cells were stained for CD45 and Apotracker Green (a representative FACS dot plots; b frequency of CD45-/Apotracker Green+ cells; c total number of CD45-/Apotracker cells per lung). d Total number of neutrophils (CD45+CD11c-CD11b+Ly6CintLy6Ghi). e Total monocytes (CD45+CD11c-CD11b+Ly6ChiLy6G-). f Total pDCs (CD45+CD11cloPDCA-1+CD11b). Two-way ANOVA Tukey’s multiple comparisons (***p = 0.0002, ****p < 0.0001). g 23-Bioplex analysis shows IL-6 levels in lung homogenate, or h CXCL1 in serum (complete Bioplex shown in S4a, b). Two-way ANOVA Tukey’s multiple comparisons (***p = 0.0006, *p = 0.01, p = 0.02). i, j RNAseq analysis of infected lungs at day 3 post infection. i Gene ontology of genes downregulated in Trim7−/− mice. j Volcano plot of the RNAseq (n = 3 per group, Wald test). kn Neutrophil depletion in WT mice using anti-Ly6G antibody or isotype as control followed by infected with maSARS-CoV-2 (n = 8) (**p = 0.001), weigh loss (k), viral titers (l, n = 3), two-tailed T-test analysis, representative dot blot of lung cells (m, CD45/Apotracker Green), frequency CD45/Apotracker Green+ cells (n), two-way ANOVA Tukey’s multiple comparisons (**p = 0.001, p = 0.006). Data were depicted as Mean ± SEM. DPI days post infection, GO gene ontology, α-Ly6G anti-Ly6G. Source data are provided in the Source data file.
Fig. 4
Fig. 4. Mutations on M lysine 14 induce apoptosis and are present in circulating stains of SARS-CoV-2.
a, b A549 WT or TRIM7 KO transfected with 500 ng of M-WT, M-K14R, or M-KallR mutants for 24 h and then stained with Apotracker Green, a representative dot blot. b Frequency of Apotracker+ cells, representative data of two independent experiments and each with two biological replicates. ce M lysine mutations in SARS-CoV-2 sequences of circulating variants. Percentage of occurrence of M-K14 mutation across the clades (c) and membrane protein K14 mutation occurrence (d), or membrane protein K15 mutation occurrence (e). Red highlighted nodes indicate at least one mutation occurrence in the specific clade. Data were depicted as Mean ± SEM. Source data are provided in the Source data file.
Fig. 5
Fig. 5. Recombinant virus with M K14/K15 mutations shows increased pathogenesis.
Vero E6 (a, b) or Calu-3 (c, d) infected with SARS-Cov-2 WT or M-K14/15R MOI 0.1 and 1, respectively. Viral titers (a, c) and viral RNA by qPCR (b, d). Two-way ANOVA Tukey’s multiple comparisons (****p < 0.0001, ***p = 0.001, p = 0.0007). e Ratio of cells in apoptosis Apotracker+ normalized by viral titers (Apotracker+/PFU) in Calu-3 cells. Data were representative of two independent experiments, each with two biological replicates. Multiple T-test comparison (***p = 0.003). fh WT C57BL/6J male mice infected with SARS-CoV-2 WT (n = 8) or M-K14/15R mutant viruses (n = 10) and mock (n = 5). f viral titers in lung (n = 4), two-tailed t-test analysis (*p = 0.036). g weight loss curve. Two-way ANOVA Tukey’s multiple comparisons (*p = 0.02, **p = 0.001). h Ratio of cells in apoptosis in the lung (Apotracker+/PFU, n = 4). Two-tailed t-test analysis (*p = 0.02). i Viral titers of HEK293T-hACE-2 cells transfected with 200 ng of TRIM7 WT or TRIM7 ΔRING and infected with SARS-CoV-2 WT or M K14/15R at MOI 0.1 (bottom panel shows immunoblot for TRIM7). Two-way ANOVA Tukey’s multiple comparisons (****p < 0.0001, ***p = 0.0007). WT (n = 8, 6 males, 2 females) and Trim7−/− (n = 9 and 11, 7 or 9 males and 2 females) infected with SARS-CoV-2 WT or M-K14/15R and euthanized at day 3. j Lung viral titers are combined data from two independent experiments (*p = 0.038, 0.016). k Total number of cells in apoptosis (CD45 +Apotracker+) are representative of 1 of the 2 independent experiments shown in (j). Mock n = 3/group, SARS-CoV-2 WT n = 4 in WT and 3 in Trim7/− mice. M K14/15R virus n = 4 in WT and 3 in Trim7−/. One-way ANOVA Tukey’s multiple comparisons (*p = 0.014, ***p = 0.0002). Data were depicted as mean ± SEM. DPI days post infection. Source data are provided in the Source data file.
Fig. 6
Fig. 6. TRIM7 mediates its antiviral effects by inhibiting caspase-6 activation.
a Viral titers of HEK293T-hACE-2 cells overexpressing TRIM7 WT and infected with SARS-CoV-2 WT or M-K14/15R at MOI 0.1 and treated with vehicle (DMSO) or 50 μM of Z-VEID-FMK 24 h post infection. Two-way ANOVA Tukey’s multiple comparisons (****p < 0.0001). b Western blot analysis of A549 WT and TRIM7 KO cells transfected with SARS-CoV-2 N protein or empty vector and treated with Staurosporine (STS) *indicates a cleaved form of N (blot is representative of two independent experiments). c Weight loss of WT female mice infected intranasally with SARS-CoV-2 WT, treated intraperitoneally with caspase-6 inhibitor or vehicle. Mock (n = 6 each) vehicle (n = 5) or Z-VEID-FMK (n = 6). Two-way ANOVA Tukey’s multiple comparisons (*p = 0.03) (d) weight loss Trim7−/− female mice infected as in (c), vehicle mocks (n = 5 each) infected vehicle (n = 4) or Z-VEID-FMK (n = 6). e Viral titers in lung (WT n = 5 and 6, Trim7−/− n = 5 and 4, respectively). One-way ANOVA Tukey’s multiple comparisons (**p = 0.002, p = 0.003, *p = 0.02). f IFN-β mRNA multiple T-test comparison (***p = 0.0003, **p = 0.001). g ISG54 mRNA expression levels in the lung. One-way ANOVA Tukey’s multiple comparisons (*p = 0.03, p = 0.01, ***p = 0.0002, ****p < 0.0001). h Scheme of the multiple functions of TRIM7 during SARS-CoV-2 infection. Data were depicted as mean ± SEM. DPI days post infection, CoV-2 SARS-CoV-2. Source data are provided in the Source data file.

Update of

References

    1. Lamers, M. M. & Haagmans, B. L. SARS-CoV-2 pathogenesis. Nat. Rev. Microbiol.20, 270–284 (2022). - PubMed
    1. Martines, R. B. et al. Pathology and pathogenesis of SARS-CoV-2 associated with fatal coronavirus disease, United States. Emerg. Infect. Dis.26, 2005–2015 (2020). - PMC - PubMed
    1. Yan, W., Zheng, Y., Zeng, X., He, B. & Cheng, W. Structural biology of SARS-CoV-2: open the door for novel therapies. Signal Transduct. Target Ther. 7, 26 (2022). - PMC - PubMed
    1. Zhang, Z. et al. Structure of SARS-CoV-2 membrane protein essential for virus assembly. Nat. Commun.13, 4399 (2022). - PMC - PubMed
    1. Hou, Y. J. et al. SARS-CoV-2 reverse genetics reveals a variable infection gradient in the respiratory tract. Cell182, 429–446 e414 (2020). - PMC - PubMed

Publication types

MeSH terms

Associated data