. 2024 Nov 30;14(1):29826.
doi: 10.1038/s41598-024-80502-2.

A computational model that integrates unrestricted callus growth, mechanobiology, and angiogenesis can predict bone healing in rodents

Affiliations

A computational model that integrates unrestricted callus growth, mechanobiology, and angiogenesis can predict bone healing in rodents

Ahmad Hedayatzadeh Razavi et al. Sci Rep. .

Abstract

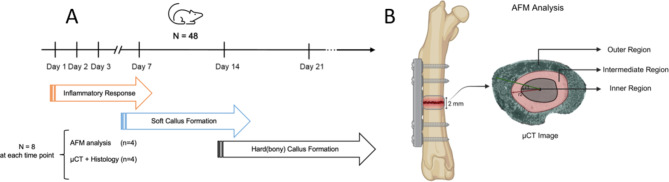
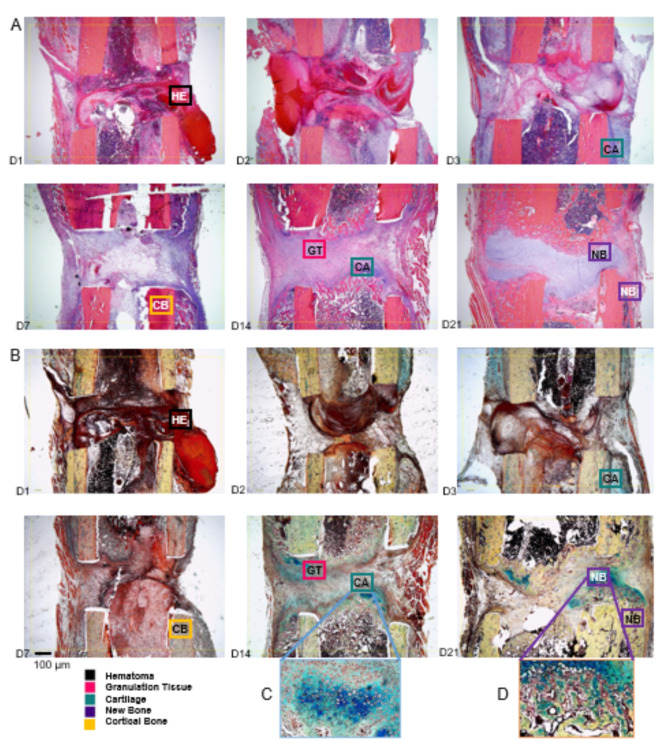
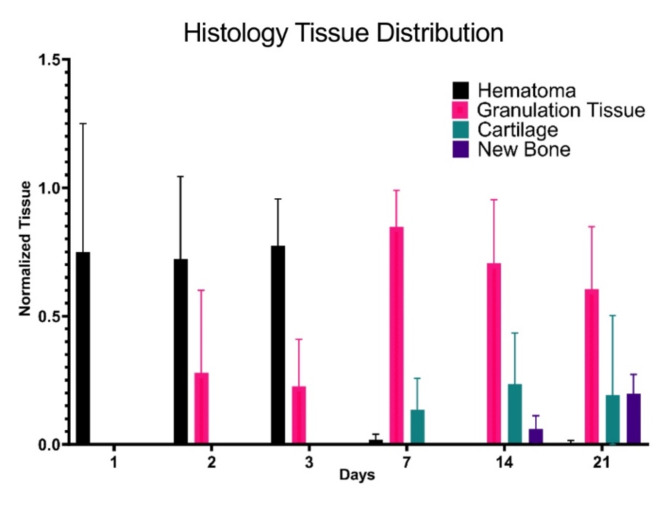
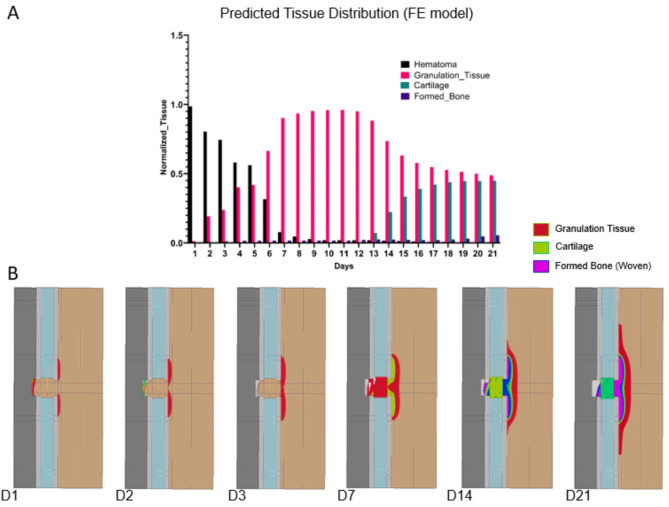
We present a computational model that integrates mechanobiological regulations, angiogenesis simulations and models natural callus development to simulate bone fracture healing in rodents. The model inputs include atomic force microscopy values and micro-computed tomography on the first-day post osteotomy, which, combined with detailed finite element modeling, enables scrutinizing mechanical and biological interactions in early bone healing and throughout the healing process. The model detailed mesenchymal stem cell migration patterns, which are essential for tissue transformation and vascularization during healing, indicating the vital role of blood supply in the healing process. The model predicted bone healing in rodents (n = 48) over 21 days, matching daily tissue development with histological evidence. The developed computational model successfully predicts tissue formation rates and stiffness, reflecting physiological callus growth, and offers a method to simulate the healing process, potentially extending to humans in the future.

Keywords: Angiogenesis; Bone healing mechanobiology; Computational modeling; Plate fixation; Rat fracture model; Unrestricted callus growth.


Conflict of interest statement

Competing interests: The authors declare no competing interests.

Figures

Fig. 1
Fig. 1
(A) Overview of the animal model and experimental setup for the study. (B) AFM analysis of fracture site tissues in the animals post-osteotomy, representing tissue sampling from the fracture site’s central, intermediate, and outer regions borders at various follow-up times. Tissues were preserved in PBS for biomechanical property examination.
Fig. 2
Fig. 2
(A1) Mechanobiological regulation by Prendergast et al.. (A2) Modified (smoothed) mechanobiological regulation criteria for tissue differentiation in rats. (A3) Reaction diagram showing the rates of differentiation between MSCs, fibroblasts, chondrocytes, and osteoblasts, labeled with corresponding rate constants Fi=1,0.7. (B) Blood regulation functions (fi=1,3,4, f2) showing the dependencies of cell differentiation rates to blood vessel density. (C1) 2D Finite element model of rat femur for biomechanical analysis modeled femoral shaft as a hollow cylinder with specifications derived from µCT scans post-surgery. (C2) highlights the refined mesh around the fracture site and mesh convergence analysis for each region separately. (C3) Force and boundary conditions contain mechanical (axial load and fixed screws) and physiological (cell concentrations) used for separate phases of the simulation. (D) Schematic representation of the algorithm used for cell differentiation influenced by angiogenesis and mechanical stimulus. A closer look into simulation of tissue differentiation and vascularization in healing callus: this demonstrates the dynamic development of bone, cartilage, and fibrous tissue within the callus influenced by mechanical conditions and MSC concentration, alongside an angiogenesis model reflecting blood vessel growth regulated by strain-dependent diffusion, mirroring the oxygen supply to cells during the healing process based on work of Ganadhiepan.
Fig. 3
Fig. 3
Schematic of the MSC differentiation algorithm in fracture healing simulation. This illustrates the iterative process used to update tissue types and material properties daily, based on MSC differentiation rates into fibrogenic, chondrogenic, and osteogenic cells, influenced by mechanical stimuli, cell concentration, and vascularization, guiding tissue repair and growth in the rat model.
Fig. 4
Fig. 4
Temporal stiffness progression in fracture site regions from AFM Data, displaying the stiffness of tissues within central, intermediate, and outer regions over 21 days, based on AFM measurements at nine random locations per animal.
Fig. 5
Fig. 5
Histological analysis of tissue progression and differentiation post-fracture for one representative sample at each timepoint between days (1–21). This represents histology slides at various time points post-fracture using H&E staining (A) and (B) Movat’s Pentachrome staining with higher magnification views of cartilage and new bone outlined in blue and orange, respectively. The images illustrate the tissue progression and differentiation trend within the fracture site. The images illustrate the progression and differentiation of tissue within the fracture site. Parts (C) and (D) provide detailed, zoomed-in views of specific regions on days 14 and 21, highlighting chondrocytes and osteoblasts within the fracture window, respectively.
Fig. 6
Fig. 6
Analysis of tissue volume formation post-fracture, presenting daily tissue formation volumes within a designated region up to day 21 post-surgery, as quantified from the histological study.
Fig. 7
Fig. 7
Evolution of material properties in fracture healing from FE simulation. Rows a and b showcase the progressive changes in tissue stiffness (E), especially around the cortical bones and beneath the plate, leading to hard callus formation with stiffness of 10–40 MPa by day 21, highlighting the model’s ability to capture the dynamic nature of bone healing. Row c shows MSCs Migration and Concentration in Fracture Healing Simulation. Row c demonstrates MSCs migration from high concentration areas towards the outer regions of the fracture site, with significant cell accumulation noted beneath the plate by day 7. It highlights the dynamic distribution of MSCs critical for tissue transformation, reaching saturation around days 7 to 14, and the diminishing impact of further MSC distribution on the healing process beyond this point. Lastly, Row d shows FE Simulation of Vascularization in Fracture Healing. Illustrates vessel density changes and oxygen supply via diffusion, showing blood vessel network development in the callus by day seven and gradual stabilization of vascularization to normal levels by days 14 to 21, highlighting the importance of vascular growth and oxygenation in the healing process.
Fig. 8
Fig. 8
(A) Temporal analysis of tissue volume formation post-fracture. Presents daily tissue formation volumes within a designated region up to day 21 post-surgery, as quantified from model simulations. The result demonstrates the model’s ability to replicate hematoma formation and transformation of tissue types together as the healing progresses. Comparing it to histological data from Fig. 7 highlights the correlation in timing and quantity of hematoma, granulation tissue, cartilage, and new osteogenesis. (B) The spatial and temporal tissue formation and differentiation trend in the model after fracture specified to match the coloring in part A.
Fig. 9
Fig. 9
Elastic modulus comparison across fracture site regions over 21 days. The first row shows the current model, and the second row shows the common MR model using sheep data, illustrating the variation in tissue stiffness within the fracture site’s central, intermediate, and outer regions based on daily assessments and AFM-based nanoindentation tests. Figures (AC), and (DF) compare current and previous MR simulation predictions of elastic modulus with AFM experimental data, respectively, highlighting this model’s accuracy in early bone healing stages and demonstrating its particularly effective prediction in the intermediate region.

References

    1. Isaksson, H. Recent advances in mechanobiological modeling of bone regeneration. Mech. Res. Commun.42, 22–31 (2012).
    1. Ghiasi, M. S., Chen, J., Vaziri, A., Rodriguez, E. K. & Nazarian, A. Bone fracture healing in mechanobiological modeling: A review of principles and methods. Bone Rep.6, 87–100 (2017). - PMC - PubMed
    1. Prendergast, P., Huiskes, R. & Søballe, K. Biophysical stimuli on cells during tissue differentiation at implant interfaces. J. Biomech.30, 539–548 (1997). - PubMed
    1. Claes, L. & Heigele, C. Magnitudes of local stress and strain along bony surfaces predict the course and type of fracture healing. J. Biomech.32, 255–266 (1999). - PubMed
    1. Søballe, K. Hydroxyapatite ceramic coating for bone implant fixation: Mechanical and histological studies in dogs. Acta Orthop. Scand.64, 1–58 (1993). - PubMed

LinkOut - more resources