. 2024 Nov 30;23(1):428.
doi: 10.1186/s12933-024-02507-5.

ASGR1 deficiency improves atherosclerosis but alters liver metabolism in ApoE-/- mice

Affiliations

ASGR1 deficiency improves atherosclerosis but alters liver metabolism in ApoE-/- mice

Monika Svecla et al. Cardiovasc Diabetol. .

Abstract

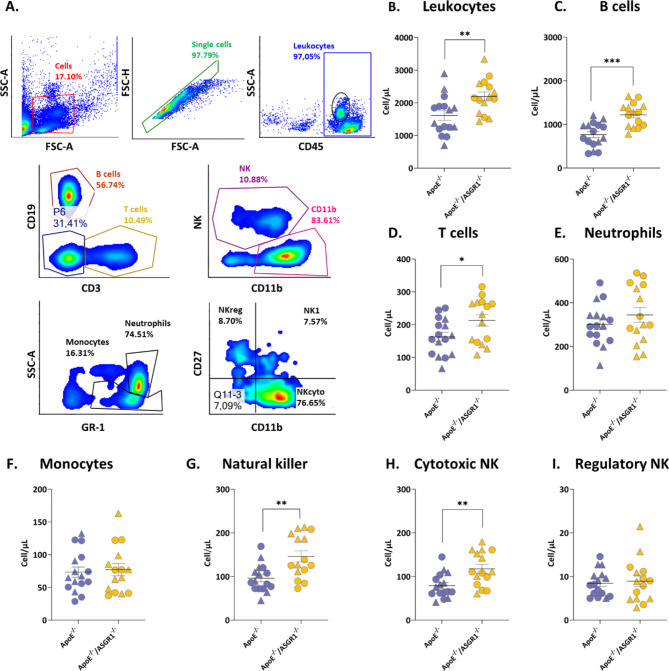
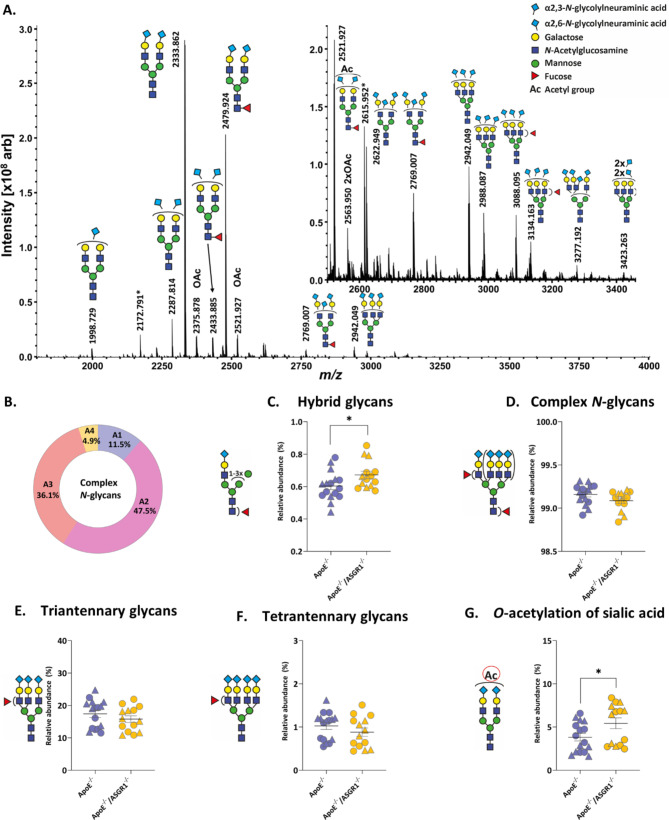
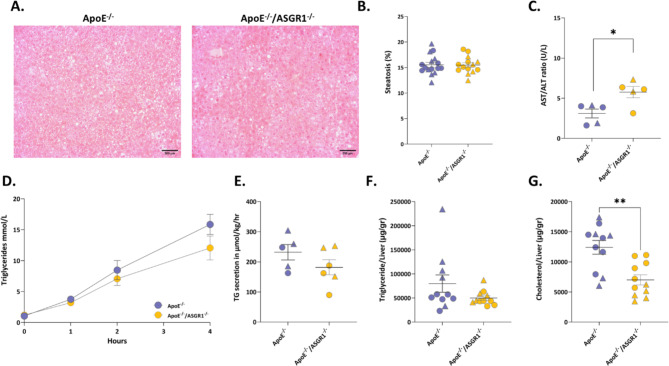
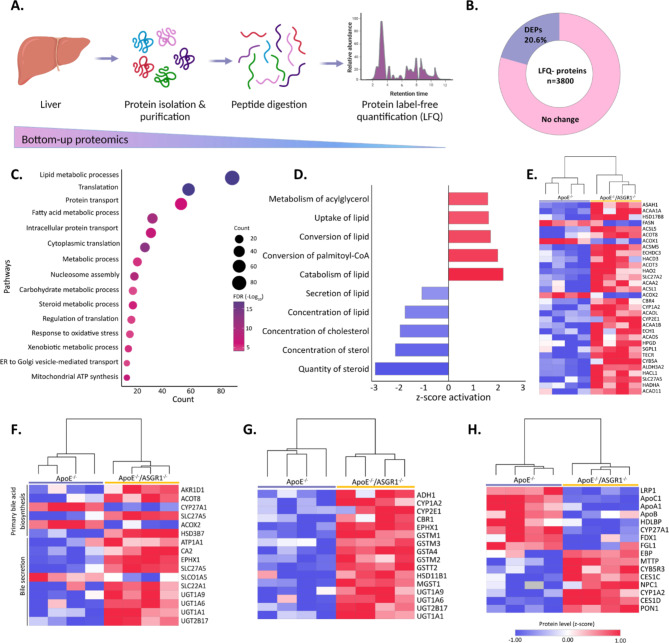
The asialoglycoprotein receptor 1 (ASGR1), a multivalent carbohydrate-binding receptor that primarily is responsible for recognizing and eliminating circulating glycoproteins with exposed galactose (Gal) or N-acetylgalactosamine (GalNAc) as terminal glycan residues, has been implicated in modulating the lipid metabolism and reducing cardiovascular disease burden. In this study, we investigated the impact of ASGR1 deficiency (ASGR1-/-) on atherosclerosis by evaluating its effects on plaque formation, lipid metabolism, circulating immunoinflammatory response, and circulating N-glycome under the hypercholesterolemic condition in ApoE-deficient mice. After 16 weeks of a western-type diet, ApoE-/-/ASGR1-/- mice presented lower plasma cholesterol and triglyceride levels compared to ApoE-/-. This was associated with reduced atherosclerotic plaque area and necrotic core formation. Interestingly, ApoE-/-/ASGR1-/- mice showed increased levels of circulating immune cells, increased AST/ALT ratio, and no changes in the N-glycome profile and liver morphology. The liver of ApoE-/-/ASGR1-/- mice, however, presented alterations in the metabolism of lipids, xenobiotics, and bile secretion, indicating broader alterations in liver homeostasis beyond lipids. These data suggest that improvements in circulating lipid metabolism and atherosclerosis in ASGR1 deficiency is paralleled by a deterioration of liver injury. These findings point to the need for additional evaluation before considering ASGR1 as a pharmacological target for dyslipidemia and cardiovascular disorders.

Keywords: Asialoglycoprotein receptor 1; Atherosclerosis; Cholesterol; Liver metabolism; Plaque composition.


Conflict of interest statement

Declarations. Competing interests: The authors declare no competing interests.

Figures

Fig. 1
Fig. 1
ASGR1 deficiency reduces plasma lipids and atherosclerosis in experimental mice. Plasma and aorta were collected after 16 weeks of western type diet (WTD) in male (represented by triangles) and female (represented by circles), in ApoE−/− and ApoE−/−/ASGR1−/− mice. The lipid levels were measure in fasting condition (A) The circulating cholesterol levels in ApoE−/− (n = 16) and ApoE−/−/ASGR1−/− (n = 15) mice (B) Cholesterol content measured in fractionated plasma in ApoE−/− (n = 4) and ApoE−/−/ASGR1−/− (n = 4) mice (C) The circulating triglyceride levels in ApoE−/− (n = 16) and ApoE−/−/ASGR1−/− (n = 15) mice (D) Triglyceride content measured in fractionated plasma in ApoE−/− (n = 4) and ApoE−/−/ASGR1−/− (n = 4) mice (E) Representative images at the aortic sinus stained for hematoxylin and eosin, Masson’s trichrome and immunofluorescence images for macrophage content (Mac2+, red) and smooth muscle cell (α-SMA+, magenta). Magnification 5x, scale bars 100–200 μm (F) Atherosclerotic plaque area (expressed in µm [2]) in ApoE−/− (n = 9) and ApoE−/−/ASGR1−/− (n = 9) mice (G) Necrotic core area (expressed in µm [2]) in ApoE−/− (n = 9) and ApoE−/−/ASGR1−/− (n = 9) mice (H) Collagen content (Masson’s trichrome staining expressed as % of positive stained area -blue staining- compared to total plaque area) in ApoE−/− (n = 9) and ApoE−/−/ASGR1−/− (n = 9) mice (I) Macrophage content (Mac2+ expressed as % of positive stained area -red staining- compared to total plaque area) in ApoE−/− (n = 8) and ApoE−/−/ASGR1−/− (n = 8) mice at the aortic sinus. The error bars show the mean ± SEM of male (represented by triangles) and female (represented by circle), ApoE−/− and ApoE−/−/ASGR1−/− mice. Each symbol in the graph represents an individual value. P values were calculated unpaired two-tailed Student’s t-test. *P < 0.05, **<0.01 and ***<0.001
Fig. 2
Fig. 2
ASGR1 deficiency increases circulating immune cell surveillance in atherosclerotic mice. (A) Flow cytometry gating strategy for blood immunophenotyping: cells were gated based on dimensions (SSC-H vs. FSC-H) and doublets were excluded by the analysis (SSC-A vs. SSC-H). Immune cells, in ApoE−/− (n = 16) and ApoE−/−/ASGR1−/− (n = 15) mice, male (represented by triangles) and female (represented by circles), were identified as following: Leukocytes were gated on CD45+ positive cells (B), B cells (CD19+, CD3) (C), T lymphocytes (CD19, CD3+) (D), monocytes and neutrophils (NK1, CD11b+, GR-1+) (E-F), Natural killer cells (NK, CD19, CD3,CD11b,NK1+) (G), Cytotoxic NK cells (CD27+,CD11b among NK1+) (H), Regulatory NK cells (CD27+, CD11b among NK1+) (I). Data are expressed as absolute count. The error bars show the mean of cell/µL ± SEM of male (triangles) and female (circles), ApoE−/− and ApoE−/−/ASGR1−/− mice. Each symbol in the graph represents an individual value. P values were calculated unpaired two-tailed Student’s t-test. *P < 0.05, **<0.01 and ***<0.001
Fig. 3
Fig. 3
ASGR1 deficiency impacts plasma O-acetylation of sialic acid in atherosclerotic mice. Plasma N-glycome in male (represented by triangles) and female (represented by circles), ApoE−/− (n = 16) and ApoE−/−/ASGR1−/− (n = 14) mice after 16 weeks of western type diet (WTD) (A) MALDI-FT-ICR-MS spectrum depicting annotated N-glycans in ApoE−/−/ASGR1−/− mice. N-Glycans are detected as [M + Na]+ ions and the descriptions of the glycan cartoons are shown in the right upper panel (B) Percentage of complex N-glycans based on the antennary (C) Hybrid glycans (D) Complex N-glycans (E) Tri-antennary glycans (F) Tetra-antennary glycans (G) O-acetylation of sialic acid. The error bars show the mean of relative abundance (%) ± SEM of male (triangles) and female (circles), ApoE−/− and ApoE−/−/ASGR1−/− mice. Each symbol in the graph represents an individual value. P values were calculated unpaired two-tailed Student’s t-test. *P < 0.05, **<0.01 and ***<0.001
Fig. 4
Fig. 4
ASGR1 deficiency affects cholesterol content in the liver of atherosclerotic mice. Liver and plasma were collected after 16 weeks of western type diet (WTD) in male (represented by triangles) and female (represented by circles), ApoE−/− and ApoE−/−/ASGR1−/− mice. (A) Representative images of liver sections stained with H&E. Scale bar, 200 μm (B) Liver lipid droplet quantification in ApoE−/− (n = 16) and ApoE−/−/ASGR1−/− mice (n = 14) (C) Plasma ALT/AST ratio in ApoE−/− (n = 5) and ApoE−/−/ASGR1−/− mice (n = 5) (D) Circulating plasma triglyceride levels (mmol/L) in mice following poloxamer injection, in ApoE−/−/ASGR1−/− mice (n = 6) compare to ApoE−/− (n = 5) (E) Triglyceride (TG) secretion rate in µmol/kg/hr, calculated from (D). (F) Liver triglyceride levels in ApoE−/− (n = 11) and ApoE−/−/ASGR1−/− mice (n = 11) (G) Liver cholesterol levels in ApoE−/− (n = 11) and ApoE−/−/ASGR1−/− mice (n = 11). Each symbol in the graph represents an individual value of male (triangles) and female (circles), ApoE−/− and ApoE−/−/ASGR1−/− mice. P values were calculated using the unpaired two-tailed Student’s t-test. *P < 0.05, **<0.01 and ***<0.001
Fig. 5
Fig. 5
ASGR1 deficiency enhances lipid catabolism in atherosclerotic mice. Liver was collected after 16 weeks of western type diet (WTD) in ApoE−/− (n = 4) and ApoE−/−/ASGR1−/− mice (n = 4) (A) Scheme depicting proteomic strategy used to identify and label-free quantify (LFQ) liver proteins in ApoE−/− and ApoE−/−/ASGR1−/− mice. Created with BioRender. (B) Untargeted liver proteome showing differentially expressed proteins (p-value < 0.05) (C) Top 15 pathways based on the gene ontology term for biological processes on the differentially expressed proteins (DEPs) in the liver of ApoE−/−/ASGR1−/− mice compare to ApoE−/− (D) Lipid metabolic processes, based on IPA pathways, of differently expressed proteins, the inhibited pathways are highlighted in blue (z-score < -2) and activated pathways are highlighted in red (z-score > 2) (E-H) Heatmap with hierarchical clustering representing the protein level (z-score transformed) for the fatty acid metabolic processes (E), Primary bile acid biosynthesis and bile secretion (F), Xenobiotics by CYP P450 (G), and Cholesterol metabolism (H) in the liver of ApoE−/−/ASGR1−/− mice compare to ApoE−/−. P values were calculated unpaired two-tailed Student’s t-test. *P < 0.05, **<0.01 and ***<0.001

References

    1. Weber C, Noels H. Atherosclerosis: current pathogenesis and therapeutic options. Nat Med. 2011;17:1410–22. - PubMed
    1. Seidah NG, Prat A, Pirillo A, Catapano AL, Norata G. D. Novel strategies to target proprotein convertase subtilisin kexin 9: beyond monoclonal antibodies. Cardiovasc Res. 2019;115:510–8. - PMC - PubMed
    1. van der Harst P, Verweij N. Identification of 64 Novel genetic loci provides an expanded view on the Genetic Architecture of Coronary Artery Disease. Circ Res. 2018;122:433–43. - PMC - PubMed
    1. Björkegren JLM, Lusis AJ. Atherosclerosis: recent developments. Cell. 2022;185:1630–45. - PMC - PubMed
    1. Nioi P, et al. Variant ASGR1 Associated with a reduced risk of coronary artery disease. N Engl J Med. 2016;374:2131–41. - PubMed

Publication types

MeSH terms