. 2024 Nov 30;21(1):313.
doi: 10.1186/s12974-024-03305-2.

CD22 blockade exacerbates neuroinflammation in Neuromyelitis optica spectrum disorder

Affiliations

CD22 blockade exacerbates neuroinflammation in Neuromyelitis optica spectrum disorder

Wenjun Zhang et al. J Neuroinflammation. .

Abstract

Background: Neuromyelitis optica spectrum disorder (NMOSD) is an autoantibody-triggered central nervous system (CNS) demyelinating disease that primarily affects the spinal cord, optic nerves and brainstem. Among the first responders to CNS injury, microglia are prominent players that drive NMOSD lesion formation. However, the key molecular switches controlling the detrimental activity of microglia in NMOSD are poorly understood. CD22 governs the activity of innate and adaptive immunity. In this study, we investigated to what extent and by what mechanisms CD22 may modulate microglial activity, neuroinflammation and CNS lesion formation.

Methods: To determine the expression profile of CD22 in NMOSD, we performed single-cell sequencing and flow cytometry analysis of immune cells from human peripheral blood. We investigated the potential effects and mechanisms of CD22 blockade on microglial activity, leukocyte infiltration and CNS demyelination in a mouse model of NMOSD induced by injection of NMOSD patient serum-derived AQP4-IgG and human complement.

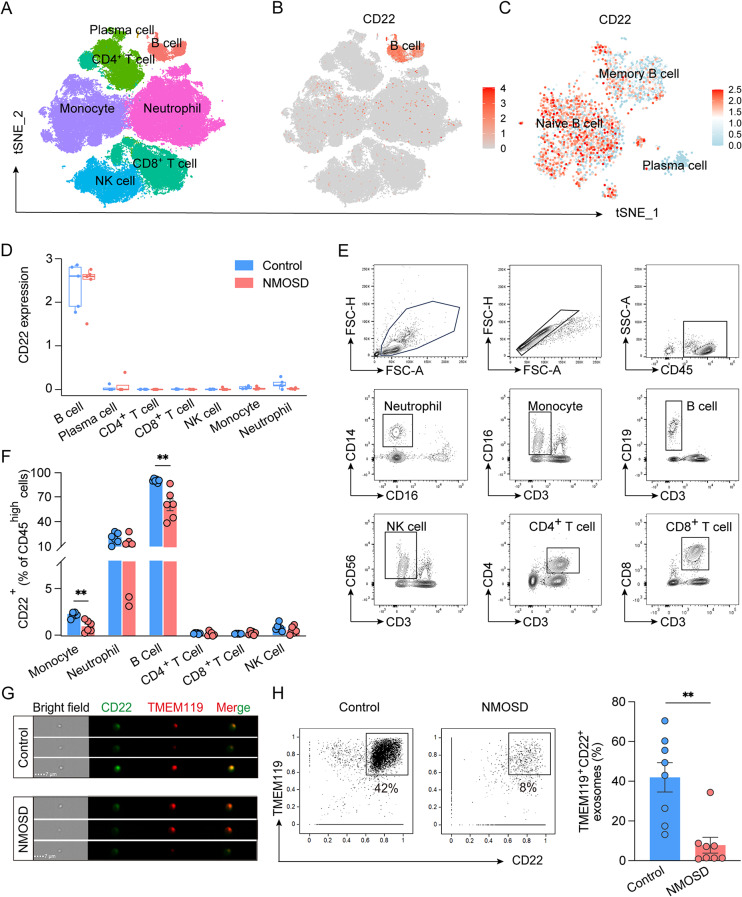
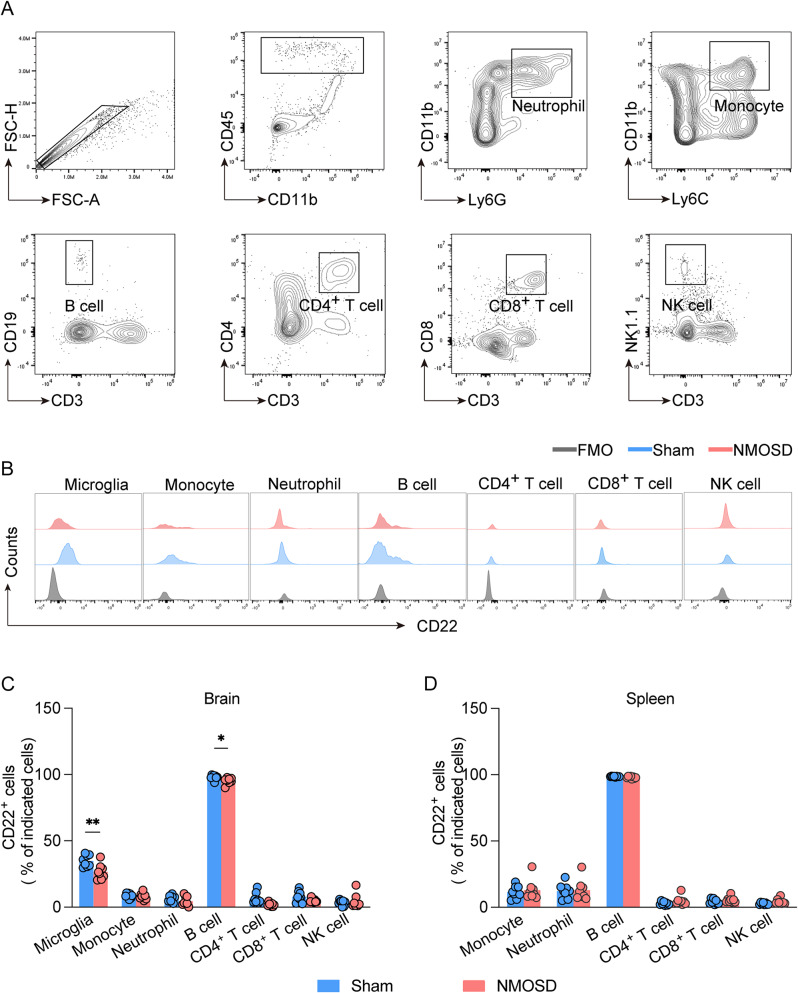
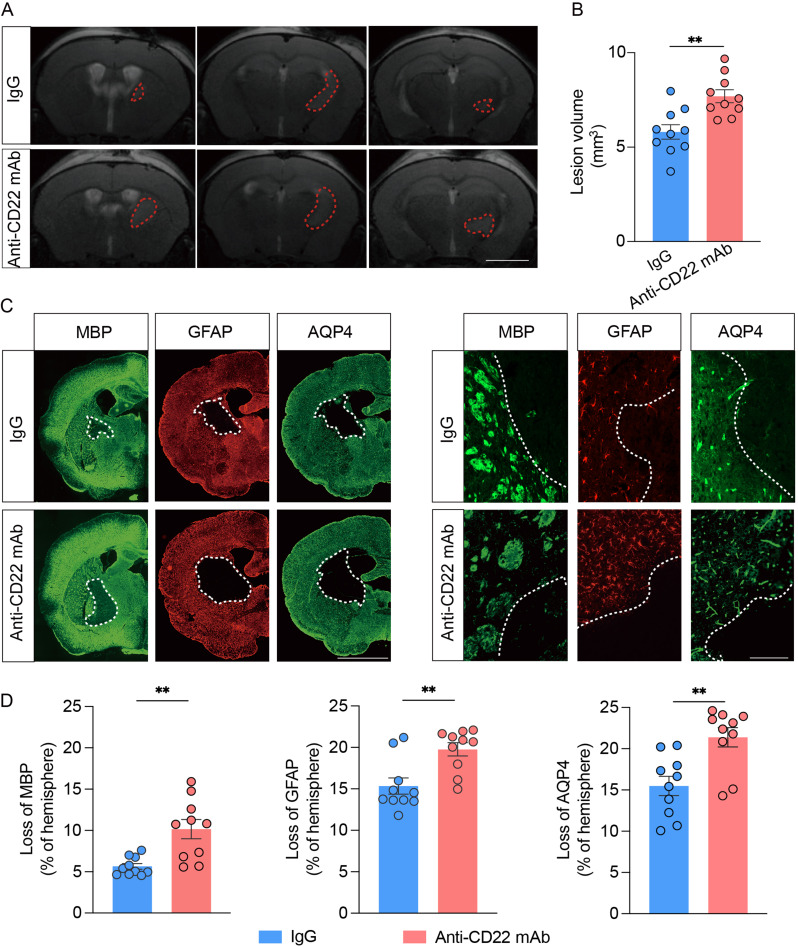
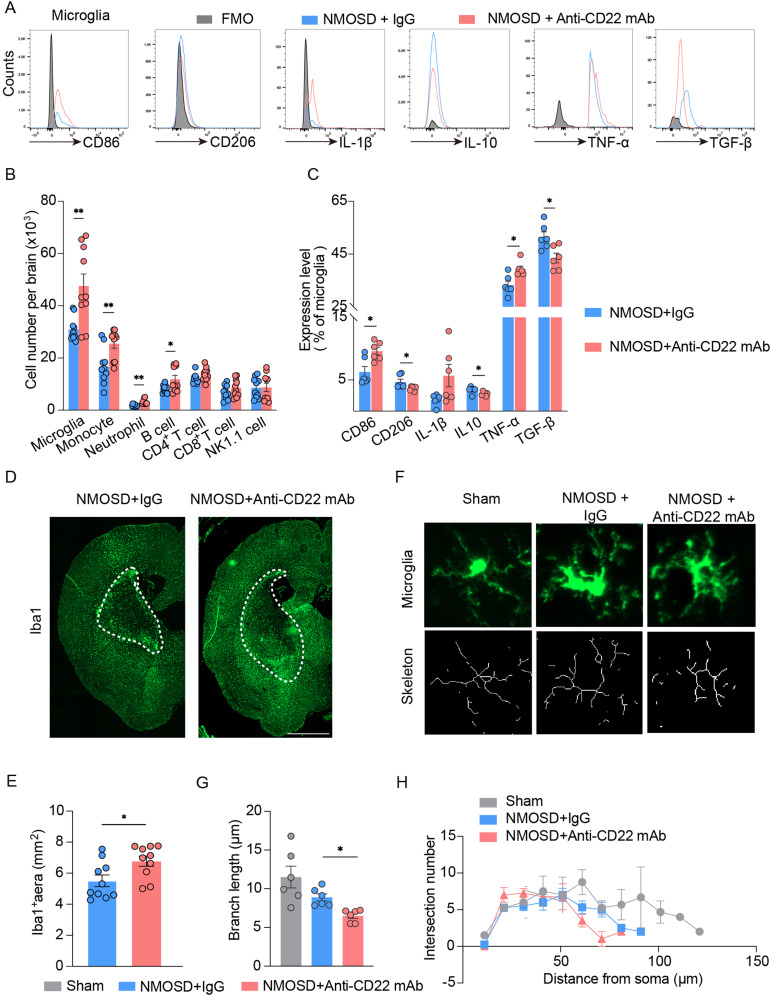
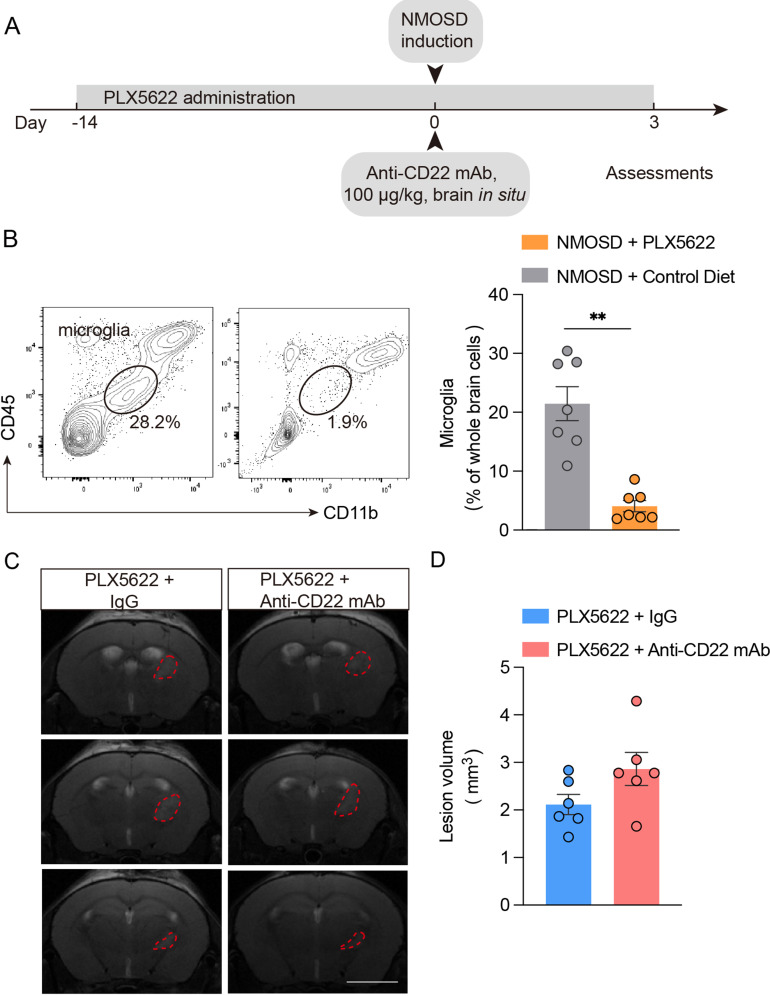
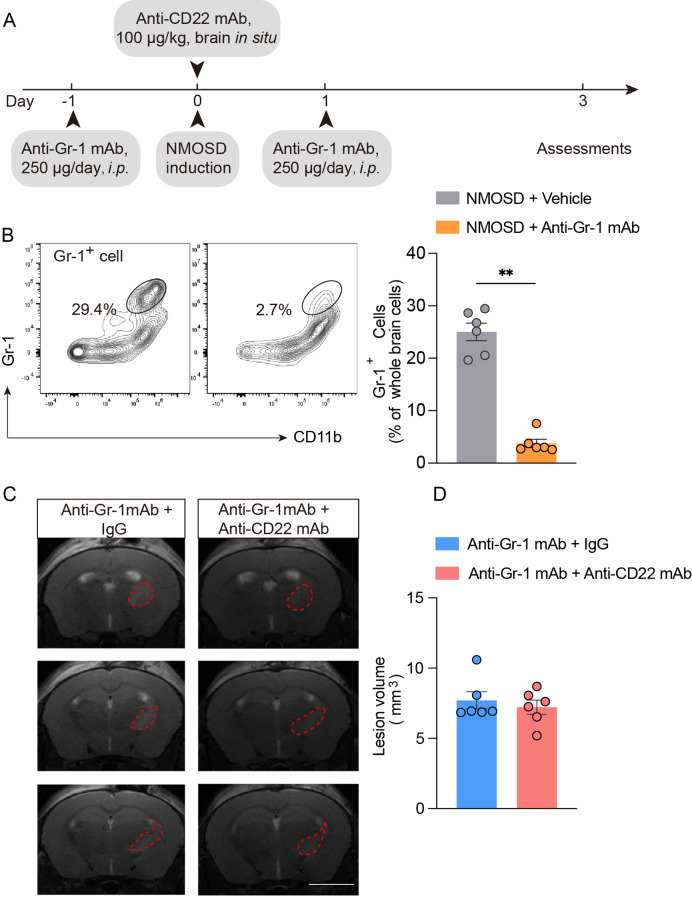
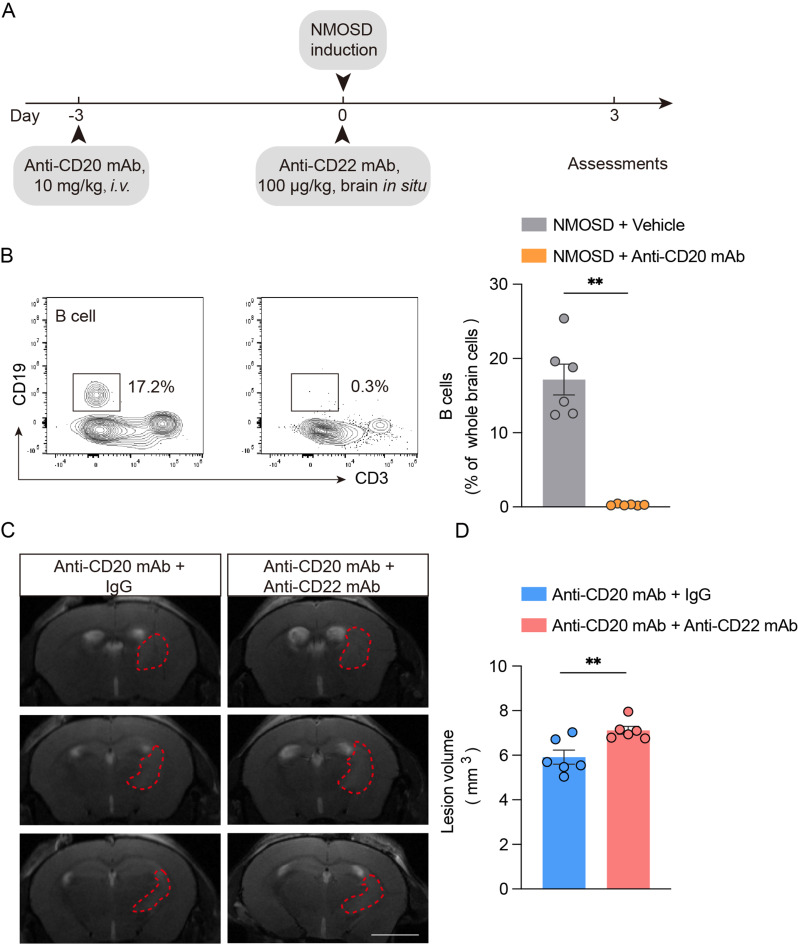
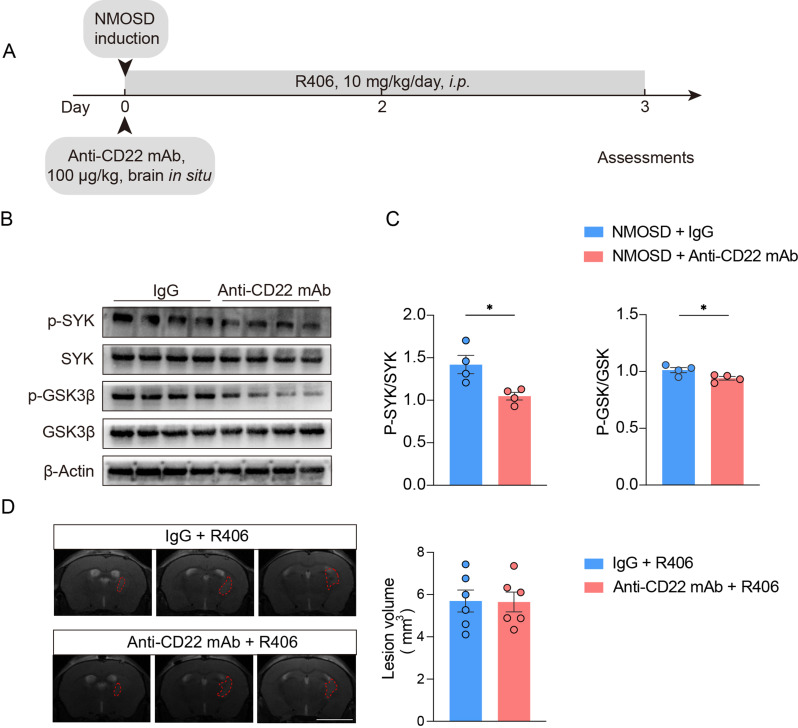
Results: Single-cell sequencing and flow cytometry analysis revealed that CD22 was expressed in B cells, neutrophils, monocytes and microglia-derived exosomes in human peripheral blood from NMOSD patients and controls (n = 5 per group). In a mouse model of NMOSD, CD22 was expressed in B cells, neutrophils, monocytes and microglia (n = 8 per group). In NMOSD mice, CD22 blockade significantly increased the number of CNS lesions, astrocyte loss and demyelination, accompanied by increased inflammatory activity and phagocytosis in microglia. Furthermore, the detrimental effects of CD22 blockade were significantly alleviated in NMOSD mice subjected to depletion of microglia or Gr-1+ myeloid cells, suggesting the involvement of microglia and peripheral Gr-1+ myeloid cells. Additionally, CD22 blockade also led to significantly reduced phosphorylation of SYK and GSK3β in NMOSD. Notably, the detrimental effects of CD22 blockade were greatly diminished in NMOSD mice receiving the phosphorylated SYK inhibitor R406.

Conclusions: Our findings revealed a previously unrecognized role of CD22 as a key molecular switch that governs the detrimental effects of microglia and Gr-1+ myeloid cells in NMOSD, which paves the way for the future design of immune therapies for NMOSD.

Keywords: CD22; Demyelination; Microglia; Neuroinflammation; Neuromyelitis optica spectrum disorder.


Conflict of interest statement

Declarations. Ethics approval and consent to participate: All animal procedures were approved by the Animal Experiments Ethical Committee of Tianjin Medical University and carried out in accordance with the Revised Guide for the Care and Use of Laboratory Animals. Written informed consent for blood donation was obtained from all control subjects and NMOSD patients, in line with the local ethical committee guidelines, and the studies were conducted under Research Ethics Committee approval (IRB2022-YX-084-01). Consent for publication: No applicable. Competing interests: The authors declare no competing interests.

Figures

Fig. 1
Fig. 1
Expression profile of CD22 in circulating immune cell subsets from patients with NMOSD and controls. A Single-cell sequencing analysis of immune cells from human peripheral blood samples from patients with NMOSD and healthy controls (total: 90,381 cells from 5 NMOSD patients and 5 controls; control: 43,985 cells; NMOSD: 46,396 cells). B, C CD22 expression profiles of B cells B and B-cell subsets C from patients with NMOSD and healthy controls; n = 5 per group. D CD22 expression profiles across various immune cell subsets in patients with NMOSD and healthy controls at the individual patient level; n = 5 per group. E Gating strategy for human circulating immune cell subsets, including neutrophils (CD45+CD3CD16+), monocytes (CD45+CD16CD14+), B cells (CD45+CD3CD19+), CD4+ T cells (CD45+CD3CD4+), CD8+ T cells (CD45+CD3CD8+) and NK cells (CD45+CD3CD56+). F Summarized bar graph showing CD22 expression in monocytes, neutrophils, B cells, CD4+ T cells, CD8+ T cells and NK cells; n = 6 per group. G Visualization of circulating exosomes from patients with NMOSD and controls. H Flow cytometry gating strategy and bar graph showing microglia-derived exosomes (CD22+TMEM119+); n = 8 per group. The data are presented as the mean ± SEM. **p < 0.01
Fig. 2
Fig. 2
CD22 expression profile in microglia and leukocytes from NMOSD mice. A Flow cytometry gating strategy for microglia (CD45+CD11bint), monocytes (CD45highCD11b+Ly6C+), neutrophils (CD45highCD11b+Ly6G+), B cells (CD45highCD3CD19+), CD4+ T cells (CD45highCD3+CD4+), CD8+ T cells (CD45highCD3+CD8+) and NK cells (CD45highCD3NK1.1+). B Histograms showing CD22-expressing cell subsets in sham and NMOSD mice. C, D Bar graphs showing the percentage of each cell type expressing CD22 in brain and spleen tissues from NMOSD mice; n = 8 per group. The data are presented as the mean ± SEM. *p < 0.05, **p < 0.01
Fig. 3
Fig. 3
CD22 blockade exacerbates NMOSD pathology in mice. A T2WI scans revealed demyelinating lesions in the indicated groups of NMOSD mice. The lesion areas are marked with red lines. Scale bar: 2 mm. B Bar graphs depicting the volume of demyelinating lesions in the indicated groups of NMOSD mice; n = 10 per group. C Immunostaining of the indicated markers (GFAP, AQP4, or MBP) in brain tissue sections from NMOSD mice receiving the anti-CD22 mAb or IgG control on day 3 after NMOSD induction. The white lines indicate areas with loss of AQP4, GFAP or MBP. Scale bar: 3,000 μm (left), 100 μm (right). D Bar graphs illustrating demyelination in NMOSD mice receiving anti-CD22 mAb or IgG control; n = 10 per group. The data are expressed as the mean ± SEM. ** p < 0.01
Fig. 4
Fig. 4
CD22 blockade augments the inflammatory activity of microglia in NMOSD mice. A Flow cytometry gating strategy for inflammatory markers (CD86, IL-1β and TNF-α) and immune regulatory markers (CD206, IL-10 and TGF-β) in microglia. B Bar graph showing the effects of CD22 blockade on the counts of microglia, brain-infiltrating monocytes, neutrophils, B cells, CD4+ T cells and CD8+ T cells in NMOSD mice; n = 10 per group. C Flow cytometry results showing the effects of CD22 blockade on the expression of inflammatory markers (CD86, IL-1β and TNF-α) and immunoregulatory markers (CD206, IL-10 and TGF-β) in microglia from NMOSD mice; n = 6 per group. D Immunostaining showing Iba1+ cells in the indicated groups. The white lines delineate the areas with an accumulation of Iba1+ cells. Scale bar: 100 μm. E Bar graph showing that CD22 blockade enhanced the accumulation of Iba1+ cells. n = 10 per group. F, G Skeletal analysis showing that the lengths of microglial processes were reduced on day 3 in mice treated with the anti-CD22 mAb; n = 6 per group. H Sholl analysis summarizing the results of microglial processes in NMOSD mice receiving the anti-CD22 mAb or IgG control. The data are presented as the mean ± SEM. *p < 0.05, **p < 0.01
Fig. 5
Fig. 5
Microglia contribute to exacerbated NMOSD pathology in mice receiving anti-CD22 mAb. A Flow chart depicting drug administration and the indicated assessment. On day 14 after microglial depletion via PLX5622, wild-type mice received intrastriatal injections of anti-CD22 mAb after NMOSD induction. B Assessment of microglia following PLX5622 administration; n = 7 per group. C T2WI scans showing brain lesions in the indicated groups of NMOSD mice. Red lines outline lesion areas. Scale bar: 2 mm. D Bar graph showing lesion volume in the indicated groups of NMOSD mice; n = 6 per group. The data are presented as the mean ± SEM. **p < 0.01
Fig. 6
Fig. 6
Gr-1+ myeloid cells contribute to exacerbating NMOSD pathology in mice receiving anti-CD22 mAb. A Flow chart depicting the drug administration and experimental procedures. Mice received anti-Gr-1 mAb before and one day after NMOSD induction. B Assessment of Gr-1+ myeloid cells in mice receiving anti-Gr-1 mAb or IgG control; n = 6 per group. C T2WI scans showing brain lesions in the indicated groups of NMOSD mice. Red lines mark the lesion areas. D Bar graph depicting lesion volume in the indicated groups of NMOSD mice; n = 6 per group. The data are presented as the mean ± SEM. **p < 0.01
Fig. 7
Fig. 7
CD22 blockade exacerbated NMOSD pathology in mice receiving anti-CD20 mAb. A Flow chart depicting the experimental procedures. The mice received anti-CD20 mAb three days prior to NMOSD induction. B Assessment of B cells in mice receiving anti-CD20 mAb; n = 6 per group. C T2WI scans showing brain lesions in the indicated groups of NMOSD mice. Red lines mark the lesion areas. D Bar graph showing lesion volume in the indicated groups of NMOSD mice; n = 6 per group. The data are presented as the mean ± SEM. **p < 0.01
Fig. 8
Fig. 8
The detrimental effects of CD22 blockade on NMOSD pathology involve SYK-GSK3β signaling. A Flow chart depicting the experimental procedures. The mice received R406 starting from the onset of modeling until they were sacrificed. B, C Assessment of the phosphorylation levels of SYK and GSK3β in the indicated groups of NMOSD mice; n = 4 per group. D T2WI scans showing brain lesions in the indicated groups of NMOSD mice. Bar graph showing lesion volume in the indicated groups of NMOSD mice. Red lines mark the lesion areas; n = 6 per group. The data are presented as the mean ± SEM. *p < 0.05

References

    1. Patterson SL, Goglin SE. Neuromyelitis Optica. Rheum Dis Clin North Am. 2017;43:579–91. - PubMed
    1. Yang CS, Yang L, Li T, Zhang DQ, Jin WN, Li MS, Su N, Zhangning N, Liu Q, Shao ZH, et al. Responsiveness to reduced dosage of rituximab in Chinese patients with neuromyelitis optica. Neurology. 2013;81:710–3. - PMC - PubMed
    1. Rosenthal JF, Hoffman BM, Tyor WR. CNS inflammatory demyelinating disorders: MS, NMOSD and MOG antibody associated disease. J Investig Med. 2020;68:321–30. - PubMed
    1. Afzali AM, Nirschl L, Sie C, Pfaller M, Ulianov O, Hassler T, Federle C, Petrozziello E, Kalluri SR, Chen HH, et al. B cells orchestrate tolerance to the neuromyelitis optica autoantigen AQP4. Nature. 2024;627:407–15. - PMC - PubMed
    1. Tian DC, Li Z, Yuan M, Zhang C, Gu H, Wang Y, Shi FD. Incidence of neuromyelitis optica spectrum disorder (NMOSD) in China: a national population-based study. Lancet Reg Health West Pac. 2020;2:100021. - PMC - PubMed

Substances

LinkOut - more resources