

Alzheimer's disease-specific transcriptomic and epigenomic changes in the tryptophan catabolic pathway
- PMID: 39616392
- PMCID: PMC11607912
- DOI: 10.1186/s13195-024-01623-4
Alzheimer's disease-specific transcriptomic and epigenomic changes in the tryptophan catabolic pathway
Abstract
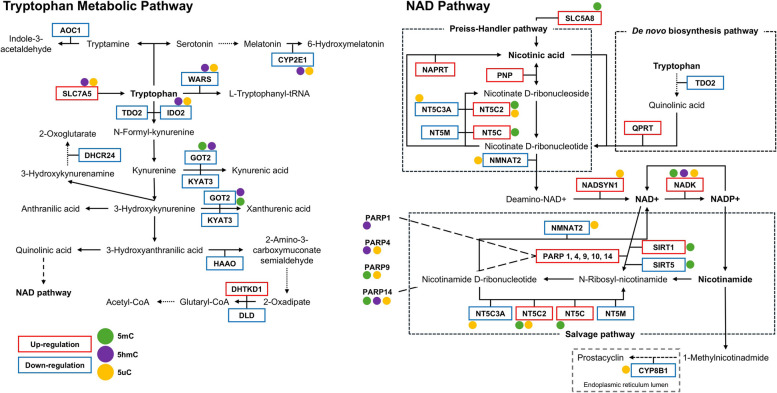
Background: Neurodegenerative disorders, including Alzheimer's disease (AD), have been linked to alterations in tryptophan (TRP) metabolism. However, no studies to date have systematically explored changes in the TRP pathway at both transcriptional and epigenetic levels. This study aimed to investigate transcriptomic, DNA methylomic (5mC) and hydroxymethylomic (5hmC) changes within genes involved in the TRP and nicotinamide adenine dinucleotide (NAD) pathways in AD, using three independent cohorts.
Methods: DNA derived from post-mortem middle temporal gyrus (MTG) tissue from AD patients (n = 45) and age-matched controls (n = 35) was analyzed, along with DNA derived from blood samples from two independent cohorts: the German Study on Ageing, Cognition, and Dementia in Primary Care Patients (AgeCoDe) cohort (n = 96) and the Dutch BioBank Alzheimer Center Limburg (BBACL) cohort (n = 262). Molecular profiling, including assessing mRNA expression and DNA (hydroxy)methylation levels, was conducted using HumanHT-12 v4 Expression BeadChip and HM 450 K BeadChip arrays, respectively. Functional interactions between genes and identification of common phenotype-specific positive and negative elementary circuits were conducted using computational modeling, i.e. gene regulatory network (GRN) and network perturbational analysis. DNA methylation of IDO2 (cg11251498) was analyzed using pyrosequencing.
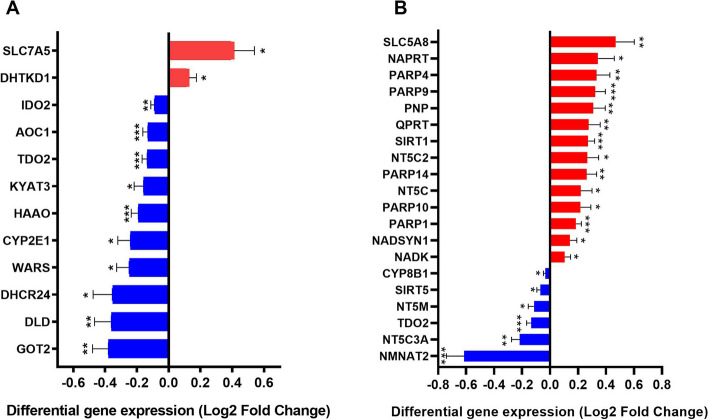
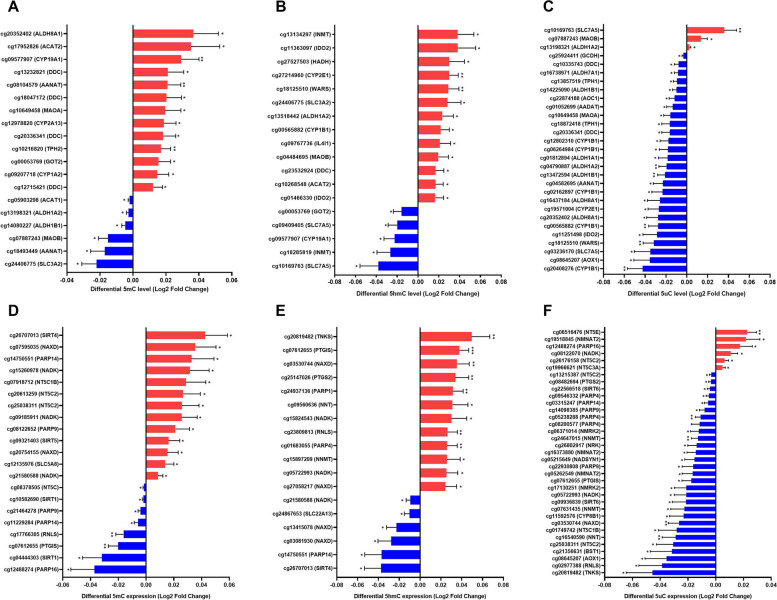
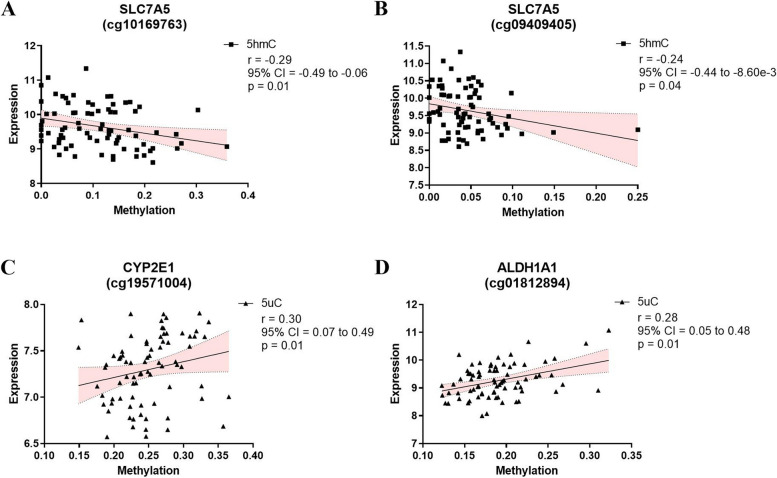
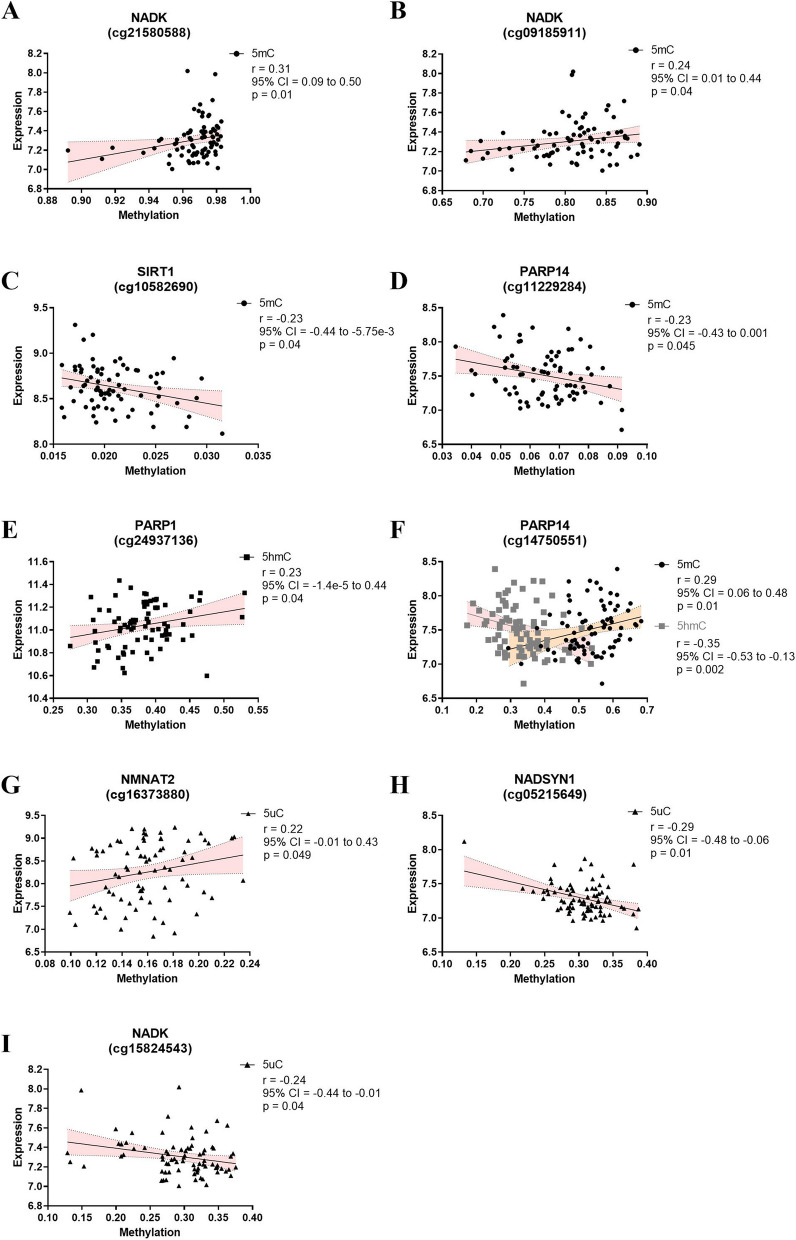
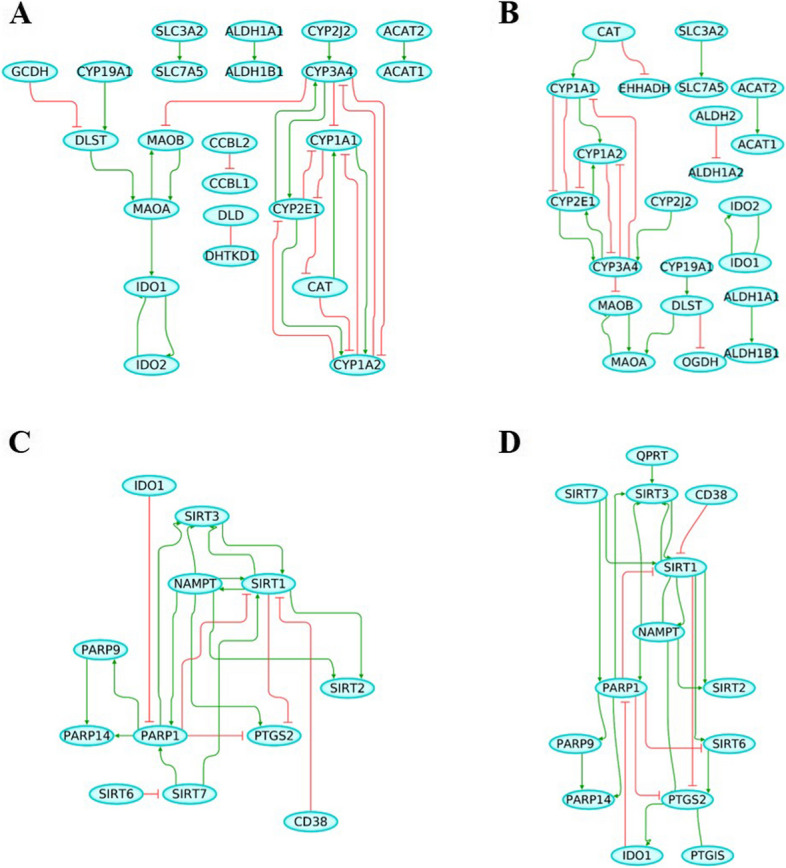
Results: Twelve TRP- and twenty NAD-associated genes were found to be differentially expressed in the MTG of AD patients. Gene sets associated in the kynurenine pathway, the most common TRP pathway, and NAD pathway, showed enrichment at the mRNA expression level. Downstream analyses integrating data on gene expression, DNA (hydroxy)methylation, and AD pathology, as well as GRN and network perturbation analyses, identified IDO2, an immune regulatory gene, as a key candidate in AD. Notably, one CpG site in IDO2 (cg11251498) exhibited significant methylation differences between AD converters and non-converters in the AgeCoDe cohort.
Conclusion: These findings reveal substantial transcriptional and epigenetic alterations in TRP- and NAD-pathway-associated genes in AD, highlighting IDO2 as a key candidate gene for further investigation. These genes and their encoded proteins hold potential as novel biomarkers and therapeutic targets for AD.
Keywords: Alzheimer’s disease (AD); Blood; Brain; Epigenetics; Indoleamine 2,3-dioxygenase (IDO); Tryptophan (TRP).
© 2024. The Author(s).
Conflict of interest statement
Declarations. Ethics approval and consent to participate: Donors of the BBDP signed an Institutional Review Board-approved informed consent form, including specific consent to the use of donated tissue for future research [16, 17]. The AgeCoDe study protocol was approved by the local ethics committees at the University of Bonn (Bonn, Germany), the University of Hamburg (Hamburg, Germany), the University of Duesseldorf (Duesseldorf, Germany), the University of Heidelberg/Mannheim (Mannheim, Germany), the University of Leipzig (Leipzig, Germany), and the Technical University of Munich (Munich, Germany). Lastly, the BBACL study protocol was approved by local ethics committees (METC 15-4-100) at the MUMC+ (Maastricht, the Netherlands). All participants gave their written informed consent. Consent for publication: Not applicable. Competing interests: The authors declare no competing interests.
Figures
References
-
- Prince M, Bryce R, Albanese E, Wimo A, Ribeiro W, Ferri CP. The global prevalence of dementia: a systematic review and metaanalysis. Alzheimers Dement. 2013;9(1):63-e752. - PubMed
-
- WHO. Global status report on the public health response to dementia: World Health Organization; 2021. Available from: https://www.who.int/publications/i/item/9789240033245.
-
- Maddison DC, Giorgini F. The kynurenine pathway and neurodegenerative disease. Semin Cell Dev Biol. 2015;40:134–41. - PubMed
MeSH terms
Substances
Grants and funding
LinkOut - more resources
Full Text Sources
Medical
Molecular Biology Databases
Research Materials
Miscellaneous
