. 2025 Jan;121(1):e17180.
doi: 10.1111/tpj.17180. Epub 2024 Dec 1.

Characterization of radiations-induced genomic structural variations in Arabidopsis thaliana

Affiliations

Characterization of radiations-induced genomic structural variations in Arabidopsis thaliana

Salimata Ousmane Sall et al. Plant J. 2025 Jan.

Abstract

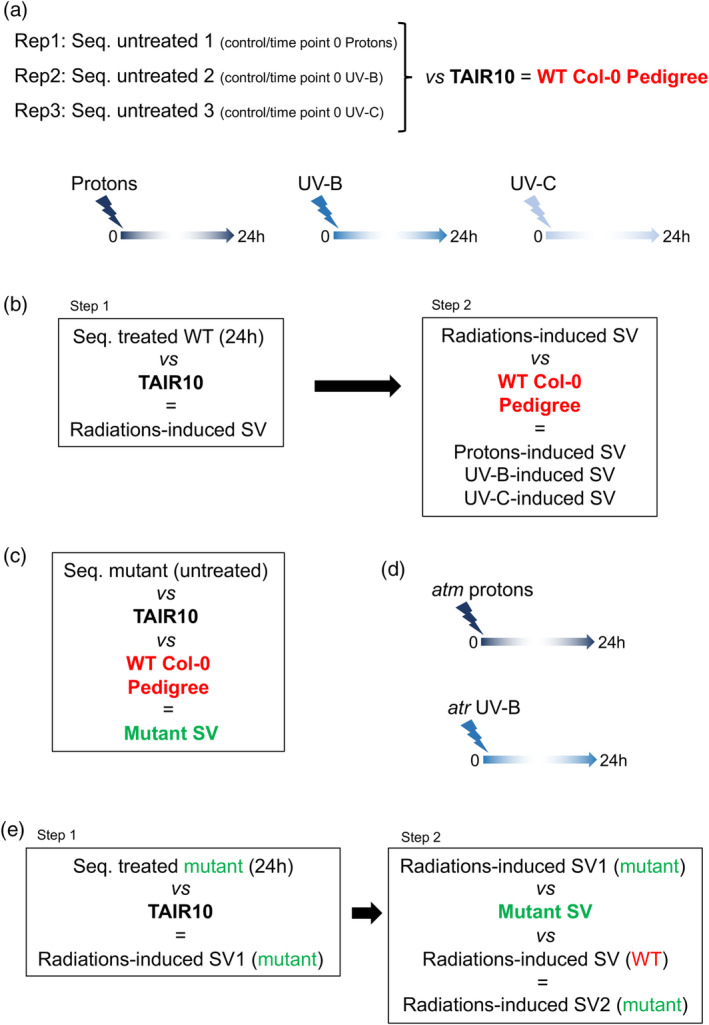
DNA, is assaulted by endogenous and exogenous agents that lead to the formation of damage. In order to maintain genome integrity DNA repair pathways must be efficiently activated to prevent mutations and deleterious chromosomal rearrangements. Conversely, genome rearrangement is also necessary to allow genetic diversity and evolution. The antagonist interaction between maintenance of genome integrity and rearrangements determines genome shape and organization. Therefore, it is of great interest to understand how the whole linear genome structure behaves upon formation and repair of DNA damage. For this, we used long reads sequencing technology to identify and to characterize genomic structural variations (SV) of wild-type Arabidopsis thaliana somatic cells exposed either to UV-B, to UV-C or to protons irradiations. We found that genomic regions located in heterochromatin are more prone to form SVs than those located in euchromatin, highlighting that genome stability differs along the chromosome. This holds true in Arabidopsis plants deficient for the expression of master regulators of the DNA damage response (DDR), ATM (Ataxia-telangiectasia-mutated) and ATR (Ataxia-telangiectasia-mutated and Rad3-related), suggesting that independent and alternative surveillance processes exist to maintain integrity in genic regions. Finally, the analysis of the radiations-induced deleted regions allowed determining that exposure to UV-B, UV-C and protons induced the microhomology-mediated end joining mechanism (MMEJ) and that both ATM and ATR repress this repair pathway.

Keywords: DSB repair; genome flexibility; genome stability; genotoxic stress; ionizing radiations; non‐ionizing radiations; structural variants.


Conflict of interest statement

We declare no competing financial interests.

Figures

Figure 1
Figure 1
Experimental design. (a) WT, Col‐0, Arabidopsis plants were irradiated with either protons, UV‐B or UV‐C. Then, 24 h upon each treatment, plant material was harvested to determine radiations‐induced SV using long reads sequencing. Each untreated control (time point 0) of the 3 different types of irradiations, have been used to characterize the pedigree of our collection of WT (Col‐0) Arabidopsis seeds. The comparison of the genomic sequences (seq.) with the TAIR10 reference genome allows defining the SVs of the plants originating from our collection of WT (Col‐0) Arabidopsis seeds. The total number of SV defines our pedigree and is thus used as reference for further experiments. (b) Schematic representation of the approach designed to characterize UV‐B‐, UV‐C‐ and protons‐induced SV in WT plants. Step 1: long reads sequences (seq.) of treated plants are compared to the TAIR10 reference genome to identify radiations‐induced SV. Step 2: SVs of our pedigree are subtracted to radiations‐induced SV to determine the UV‐B‐, UV‐C‐ and protons‐induced SVs. (c) Schematic representation of the approach designed to characterize SV in DDR deficient plants. Long reads sequences (seq.) of untreated atm and atr plants are compared to the TAIR10 reference genome to identify SV in mutant plants. (d) atm and atr, plants were irradiated with protons and UV‐B, respectively. Then, 24 h upon each treatment, plant material was harvested to determine radiations‐induced SV using long reads sequencing. (e) Same as (b) for atr UV‐B‐ and atm protons‐treated plants.
Figure 2
Figure 2
Characterization of the structural variations in WT Arabidopsis plants. (a) Histogram representing the distribution of the different types of genomic SV identified in each of the three independent biological replicates of WT (Col‐0) Arabidopsis plants. DEL, deletion; DUP, duplication; INS, insertion; INV, inversion; INVDUP, inversion duplication. n = total number of SV. Exact P values are shown (Chi‐squared test). (b) Box plots representing the size of the INDELs identified in each of the three independent biological replicates. Exact P values are shown (Mann Whitney Wilcoxon test). (c) Venn diagram representing the overlap of SV between the 3 independent biological replicates. (d) Histogram representing the distribution of the genetic elements (IR, intergenic regions; PCG, protein coding genes; TE, transposable elements) exhibiting SV in each of the three independent biological replicates. The distribution of the genetic elements in the Arabidopsis thaliana genome is shown. Exact P values are shown, *P < 0.01 versus A. thaliana genome (Chi‐squared test). n = total number of genetic elements containing SV. (e) Histogram showing the distribution of the genomic SV (DEL, deletion; DUP, duplication; INS, insertion; INV, inversion; INVDUP, inversion duplication) identified in the genetic elements of the 3 biological replicates (IR, intergenic regions; PCG, protein coding genes; TE, transposable elements). Exact P values are shown (Chi‐squared test). (f) Box plots representing the INDELs sizes identified in the genetic elements (IR, intergenic regions; PCG, protein coding genes; TE, transposable elements). In boxplots, the central line and bounds of the box represent the median and the 25th and 75th quartiles, respectively. The whiskers represent 1.5× interquartile range of the lower or upper quartiles. Exact P values are shown (Mann Whitney Wilcoxon test).
Figure 3
Figure 3
Genomic location and epigenomic features of the structural variations identified in WT Arabidopsis plants. (a) Circos representation of genomic SV (DEL, deletion; DUP, duplication; INS, insertion; INV, inversion; INVDUP, inversion duplication) identified in each independent biological replicate. Black rectangles represent the centromeres. (b) Histogram representing the distribution of the chromatin states (CS) overlapping with the SV identified in each independent biological replicates. Chi‐squared test *P < 0.01 compared to the CS distribution in the Arabidopsis epigenome (Sequeira‐Mendes et al., 2014). CH, constitutive heterochromatin; FH, facultative heterochromatin. n = total number of CS containing SV.
Figure 4
Figure 4
Characterization of the radiation‐induced genomic structural variations in WT Arabidopsis plants. (a) Histogram representing the distribution of the genomic SV identified in untreated WT Arabidopsis plants (relative to the TAIR 10 reference genome) and in plants treated with either UV‐B, UV‐C or protons. DEL, deletion; DUP, duplication; INS, insertion; INV, inversion; INVDUP, inversion duplication. n = total number of SV. Exact P values are shown (Chi‐squared test). na, non‐applicable. (b) Box plots representing the INDELs sizes identified in WT Arabidopsis plants treated with either UV‐B, UV‐C or protons. In boxplots, the central line and bounds of the box represent the median and the 25th and 75th quartiles, respectively. The whiskers represent 1.5× interquartile range of the lower or upper quartiles. Exact P values are shown (Mann‐Whitney Wilcoxon test). (c) Histogram representing the distribution of the genetic elements (IR, intergenic regions; PCG, protein coding genes; TE, transposable elements) exhibiting SV upon exposure to either UV‐B, UV‐C, or protons. Exact P values are shown (Chi‐squared test). n = total number of genetic elements containing SV.
Figure 5
Figure 5
Genomic locations and epigenomic features of genomic structural variations identified in WT Arabidopsis plants irradiated with either UV‐B, UV‐C or protons. (a) Circos representation of genomic SV (DEL, deletion; DUP, duplication; INS, insertion; INV, inversion; INVDUP, inversion duplication) identified upon exposure of WT Arabidopsis plants to either UV‐B, UV‐C or protons. Black rectangles represent the centromeres. (b) Histogram representing the distribution of the chromatin states (CS) overlapping with the SV identified upon exposure to either UV‐B, UV‐C or protons. Chi‐squared test *P < 0.01 compared to the CS distribution in the Arabidopsis epigenome (Sequeira‐Mendes et al., 2014). n = total number of CS containing SV.
Figure 6
Figure 6
Characterization of the radiation‐induced genomic structural variations in atm, atr and atm atr Arabidopsis plants. (a) Histogram representing the distribution of the genomic SV identified in untreated WT Arabidopsis plants (relative to the TAIR 10 reference genome), atm, atr, and atm atr Arabidopsis plants. DEL, deletion; DUP, duplication; INS, insertion; INV, inversion; INVDUP, inversion duplication. n = total number of SV. Exact P values are shown (Chi‐squared test). (b) Box plots representing the INDELs sizes identified in atm, atr, and atm atr Arabidopsis plants. No significant differences have been found between genotypes (Mann‐Whitney Wilcoxon test). In boxplots, the central line and bounds of the box represent the median and the 25th and 75th quartiles, respectively. The whiskers represent 1.5× interquartile range of the lower or upper quartiles. (c) Histogram representing the distribution of the genetic elements (IR, intergenic regions; PCG, protein coding genes; TE, transposable elements) exhibiting SV in atm, atr, and atm atr Arabidopsis plants. Exact P values are shown (Chi‐squared test). n = total number of genetic elements containing SV.
Figure 7
Figure 7
Characterization of the radiation‐induced genomic structural variations in atr and atm Arabidopsis plants. (a) Histogram representing the distribution of the genomic SV identified in atr, UV‐B‐treated atr, atm and protons‐treated atm Arabidopsis plants. DEL, deletion; DUP, duplication; INS, insertion; INV, inversion; INVDUP, inversion duplication. n = total number of SV. Exact P values are shown (Chi‐squared test). (b) Box plots representing the size of the INDELs identified in in atr, UV‐B‐treated atr, atm and protons‐treated atm Arabidopsis plants. No significant differences have been found between untreated and treated plants (Mann‐Whitney Wilcoxon test). In boxplots, the central line and bounds of the box represent the median and the 25th and 75th quartiles, respectively. The whiskers represent 1.5× interquartile range of the lower or upper quartiles. (c) Histogram representing the distribution of the genetic elements (IR, intergenic regions; PCG, protein coding genes; TE, transposable elements) exhibiting SV in atr, UV‐B‐treated atr, atm, and protons‐treated atm Arabidopsis plants. Exact P values are shown (Chi‐squared test). n = total number of genetic elements containing SV.
Figure 8
Figure 8
Characterization of end‐joining repair mechanisms. (a) Histogram representing the distribution of the NHEJ or MMEJ sequences signatures identified in the flanking regions of deletion in UV‐B‐, UV‐C‐, and protons‐treated WT Arabidopsis plants. n = total number of deletions. MMEJ, microhomology‐mediated end joining; NHEJ, non‐homologous end‐joining; Undetermined, low sequence quality in one of the flanking regions. (b) Bubble chart representing microhomologies lengths and their frequencies within MMEJ events identified upon UV‐B, UV‐C and protons irradiation of WT Arabidopsis plants. n = total number of MMEJ events. The size of the bubble corresponds to the percentage of MMEJ events for each microhomology length. Size (in bp) of the microhomology is indicated in each bubble. (c) Same as (a) for atm, atr, and atm atr plants. (d) Same as (b) for atr, UV‐B irradiated atr, atm, and protons‐irradiated atm plants. (e) Same as (a) for atm, atr, atm atr, UV‐B irradiated atr, and protons‐irradiated atm plants.

Similar articles

References

    1. Ata, H. , Ekstrom, T.L. , Martínez‐Gálvez, G. , Mann, C.M. , Dvornikov, A.V. , Schaefbauer, K.J. et al. (2018) Robust activation of microhomology‐mediated end joining for precision gene editing applications. PLoS Genetics, 9, e1007652. Available from: 10.1371/journal.pgen.1007652 - DOI - PMC - PubMed
    1. Avramova, Z.V. (2002) Heterochromatin in animals and plants. Similarities and differences. Plant Physiology, 1, 40–49. Available from: 10.1104/pp.010981 - DOI - PMC - PubMed
    1. Baduel, P. , Leduque, B. , Ignace, A. , Gy, I. , Gil, J., Jr. , Loudet, O. et al. (2021) Genetic and environmental modulation of transposition shapes the evolutionary potential of Arabidopsis thaliana . Genome Biology, 1, 138. Available from: 10.1186/s13059-021-02348-5 - DOI - PMC - PubMed
    1. Ben‐Tov, D. , Mafessoni, F. , Cucuy, A. , Honig, A. , Melamed‐Bessudo, C. & Levy, A.A. (2024) Uncovering the dynamics of precise repair at CRISPR/Cas9‐induced double‐strand breaks. Nature Communications, 1, 5096. Available from: 10.1038/s41467-024-49410-x - DOI - PMC - PubMed
    1. Bergis‐Ser, C. , Reji, M. , Latrasse, D. , Bergounioux, C. , Benhamed, M. & Raynaud, C. (2024) Chromatin dynamics and RNA metabolism are double‐edged swords for the maintenance of plant genome integrity. Nature Plants, 6, 857–873. Available from: 10.1038/s41477-024-01678-z - DOI - PubMed

MeSH terms