. 2024 Dec;14(12):e70112.
doi: 10.1002/ctm2.70112.

Spatial transcriptomics deciphers the immunosuppressive microenvironment in colorectal cancer with tumour thrombus

Affiliations

Spatial transcriptomics deciphers the immunosuppressive microenvironment in colorectal cancer with tumour thrombus

Heming Ge et al. Clin Transl Med. 2024 Dec.
No abstract available


Conflict of interest statement

The authors declare no conflict of interest.

Figures

FIGURE 1
FIGURE 1
Overview of study design and spatial transcriptomics (ST) spots annotation. (A) Schematic representation of this study design. Tumour thrombus and non‐tumour thrombus tissues from colorectal cancer (CRC) patients were used for spatial transcriptomics RNA sequencing. (B) The proportion of patients with tumour thrombus across different stages of CRC. (C) Survival curve for CRC patients with and without tumour thrombus. (D–F) UMAP plots of malignant spots identified by CNA analysis (D), deconvolution analysis (E), and the combination of CNA analysis and deconvolution results (F). (G) ST spots annotation based on CNA analysis and deconvolution in carcinoma regions. (H) Proportion of different cell type spots within the carcinoma regions of TT and NTT samples. TT, tumour thrombus; NTT, non‐tumour thrombus; SMC, smooth muscle cells.
FIGURE 2
FIGURE 2
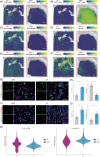
Spatial distribution of various cell types in TT and NTT samples. Spatial plots of CD8+ T cells (A), CD4+ T cells (B), macrophages (C), B cells (D), endothelial cells (E) and fibroblasts (F) in TT1 and NTT1 samples. (G) Immunofluorescence for CD8+ and CD4+ T cells on TT and NTT samples. Scale bar 25 µm. (H) Percentage of CD8+ and CD4+ T cells among total cells between TT and NTT groups. (I) Immunofluorescence for macrophages (CD68+) and M2 macrophages (CD68+CD206+) on TT and NTT samples. Scale bar 50 µm. (J) Percentage of macrophages and M2 macrophages among total cells between TT and NTT groups. (K) Differences in the TIDE dysfunction and exclusion scores were observed between TT and NTT samples. In TT samples, the lower exclusion score indicated that immune cells successfully infiltrated the tumour. However, the higher dysfunction score in TT samples suggested that, despite this infiltration, the immune cells had their functions suppressed, preventing them from effectively killing tumour cells. TT, tumour thrombus; NTT, non‐tumour thrombus; SMC, smooth muscle cells.
FIGURE 3
FIGURE 3
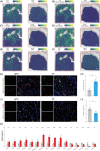
Immunosuppressive landscape of colorectal cancer (CRC) tumour thrombus. Spatial plots of regulatory T cells (Tregs) (A), M2 macrophages (B), monocytic myeloid‐derived suppressor cells (M‐MDSCs) (C), polymorphonuclear MDSCs (PMN‐MDSCs) (D), tolerogenic dendritic cells (tDCs) (E) and conventional dendritic cells (cDCs) (F) in TT1 and NTT1 samples. (G) Immunofluorescence for Tregs (CD4+FOXP3+) on TT and NTT samples. Scale bar 50 µm. (H) Percentage of Tregs among total cells between TT and NTT groups. (I) Immunofluorescence for cDCs (CD86+CD11c+) on TT and NTT samples. Scale bar 50 µm. (J) Percentage of cDCs among total cells between TT and NTT groups. (K) qPCR analysis of key immune checkpoint genes, immunosuppressive genes, and antigen‐presenting molecules in TT and NTT samples. TT, tumour thrombus; NTT, non‐tumour thrombus.
FIGURE 4
FIGURE 4
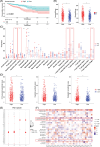
Construction of the tumour thrombus gene signature and pan‐cancer analysis. (A) Survival curve of high and low tumour thrombus score groups in TCGA‐CRC patients. (B) Comparison of immune and stromal scores between high and low tumour thrombus score groups. The high‐score group exhibited significantly higher proportions of immune and stromal cells compared to the low‐score group. (C) The proportions of 22 immune‐related cells between the tumour thrombus score groups by the CIBERSORT method. (D) Correlation analysis between tumour thrombus scores and chemotherapeutic drug resistance. (E) Pan‐cancer outcomes (OS, DSS, DFS and PFS) for tumour thrombus scores derived from 31 common cancer types from TCGA. (F) The relationship between tumour thrombus scores and immune‐related cell infiltration across 31 common cancer types from TCGA. OS, overall survival; DSS, disease specific survival; DFS, disease free survival; PFS, progression free survival; ACC, adrenocortical carcinoma; BLCA, bladder urothelial carcinoma; BRCA, breast invasive carcinoma; CESC, cervical squamous cell carcinoma and endocervical adenocarcinoma; CHOL, cholangiocarcinoma; DLBC, diffuse large B‐cell lymphoma; ESCA, esophageal carcinoma; GBM, glioblastoma multiforme; HNSC, head and neck squamous cell carcinoma; KICH, kidney chromophobe; KIRC, kidney renal clear cell carcinoma; KIRP, kidney renal papillary cell carcinoma; LAML, acute myeloid leukemia; LGG, brain lower grade glioma; LIHC, liver hepatocellular carcinoma; LUAD, lung adenocarcinoma; LUSC, lung squamous cell carcinoma; MESO, mesothelioma; OV, ovarian serous cystadenocarcinoma; PAAD, pancreatic adenocarcinoma; PCPG, pheochromocytoma and paraganglioma; PRAD, prostate adenocarcinoma; SARC, sarcoma; SKCM, skin cutaneous melanoma; STAD, stomach adenocarcinoma; TGCT, testicular germ cell tumors; THCA, thyroid carcinoma; THYM, thymoma; UCEC, uterine corpus endometrial carcinoma; UCS, uterine carcinosarcoma; UVM, uveal melanoma. *p < .05, **p < .01, ***p < .001.

References

    1. Argiles G, Tabernero J, Labianca R, et al. Localised colon cancer: ESMO Clinical Practice Guidelines for diagnosis, treatment and follow‐up. Ann Oncol. 2020;31(10):1291‐1305. doi:10.1016/j.annonc.2020.06.022 - DOI - PubMed
    1. Park SS, Lee YK, Choi YW, et al. Cellular senescence is associated with the spatial evolution toward a higher metastatic phenotype in colorectal cancer. Cell Rep. 2024;43(3):113912. doi:10.1016/j.celrep.2024.113912 - DOI - PubMed
    1. Patel AP, Tirosh I, Trombetta JJ, et al. Single‐cell RNA‐seq highlights intratumoral heterogeneity in primary glioblastoma. Science. 2014;344(6190):1396‐1401. doi:10.1126/science.1254257 - DOI - PMC - PubMed
    1. Lee HO, Hong Y, Etlioglu HE, et al. Lineage‐dependent gene expression programs influence the immune landscape of colorectal cancer. Nat Genet. 2020;52(6):594‐603. doi:10.1038/s41588-020-0636-z - DOI - PubMed
    1. Jiang P, Gu S, Pan D, et al. Signatures of T cell dysfunction and exclusion predict cancer immunotherapy response. Nat Med. 2018;24(10):1550‐1558. doi:10.1038/s41591-018-0136-1 - DOI - PMC - PubMed

LinkOut - more resources