. 2024 Dec 2;9(1):338.
doi: 10.1038/s41392-024-02033-6.

BRAF inhibitors enhance erythropoiesis and treat anemia through paradoxical activation of MAPK signaling

Affiliations

BRAF inhibitors enhance erythropoiesis and treat anemia through paradoxical activation of MAPK signaling

Shunkang Wu et al. Signal Transduct Target Ther. .

Abstract

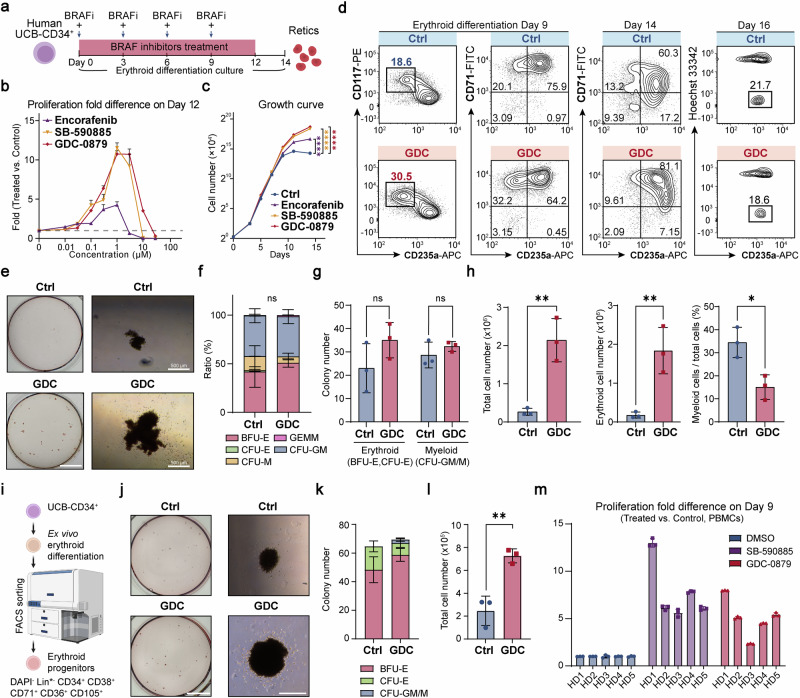
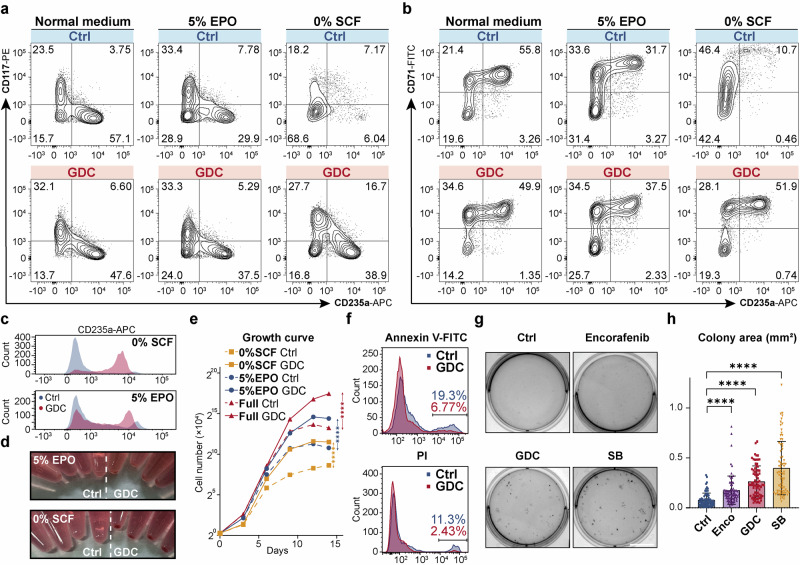
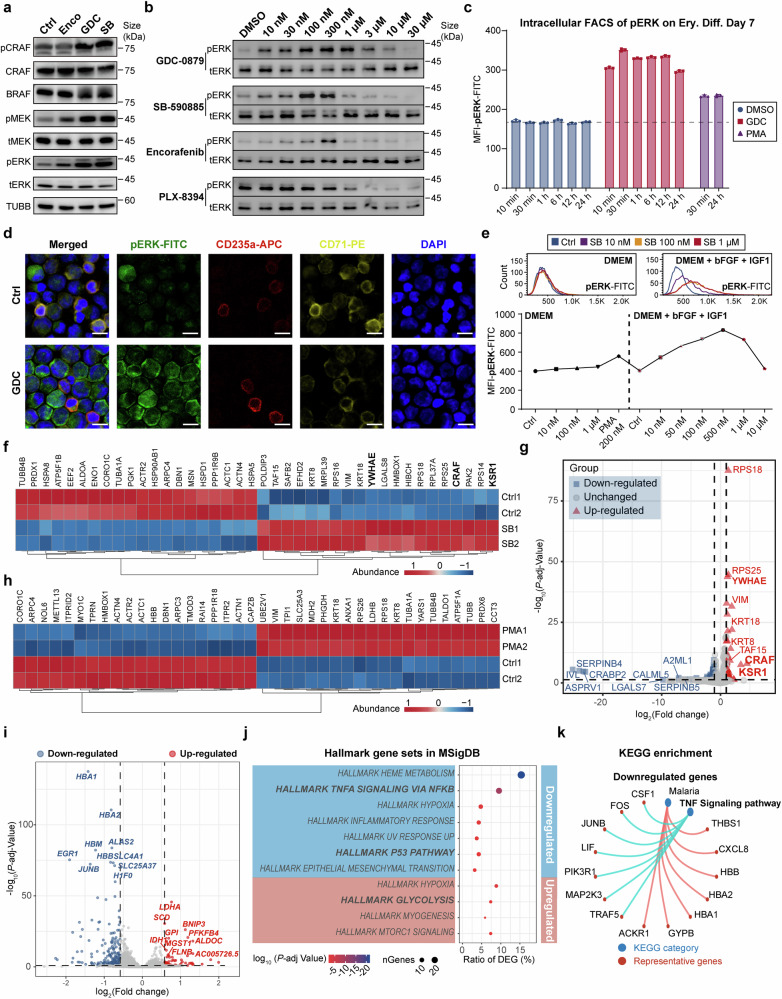
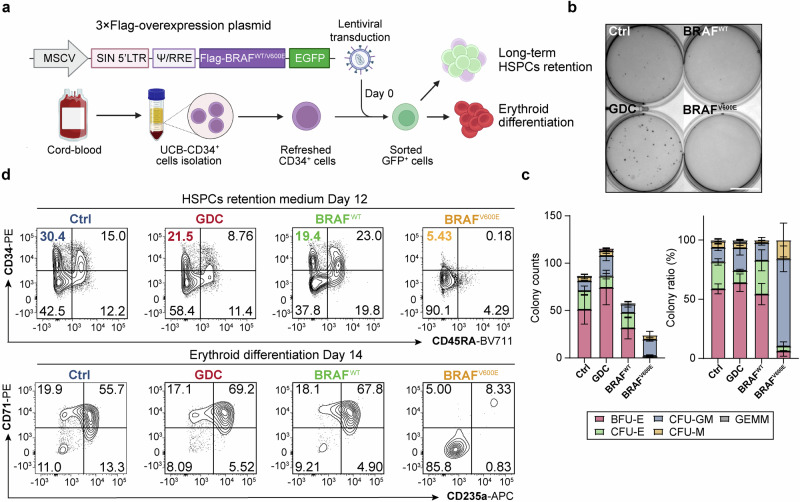
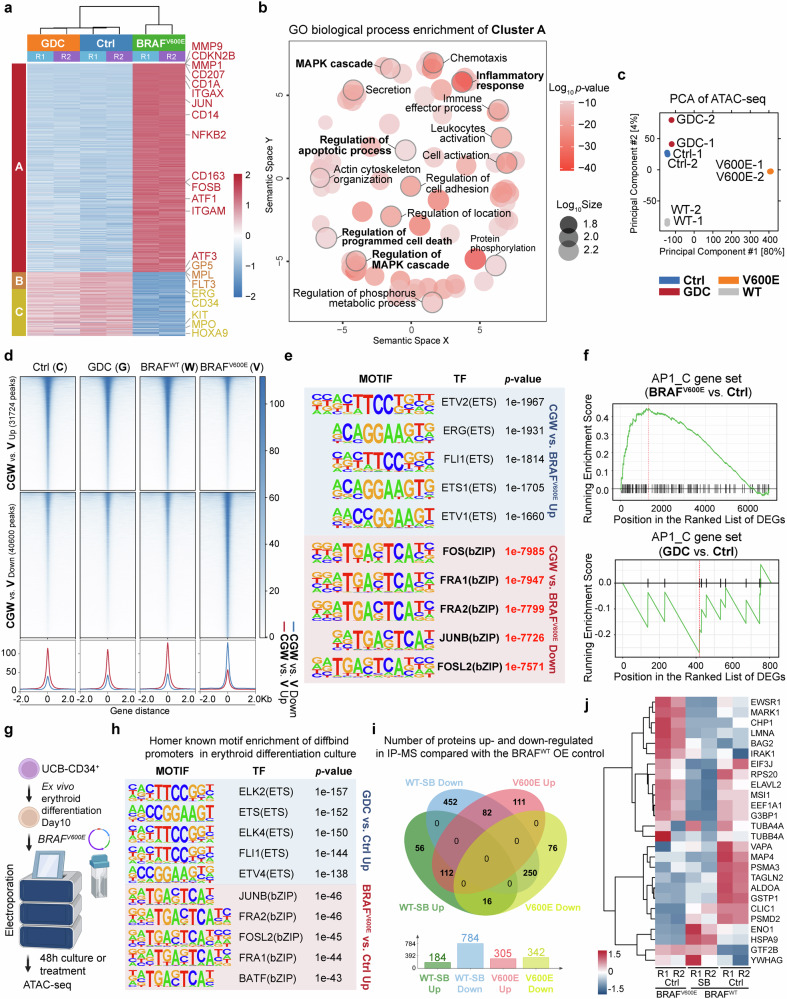
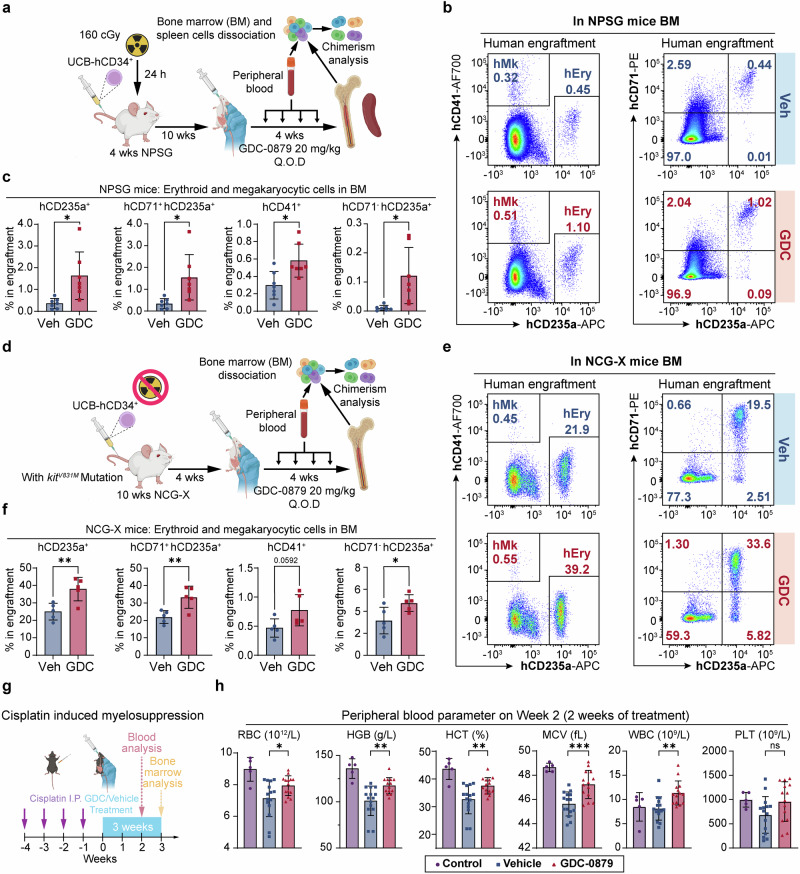
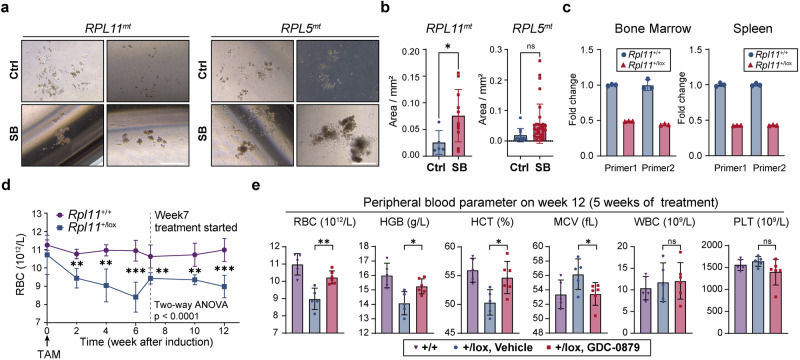
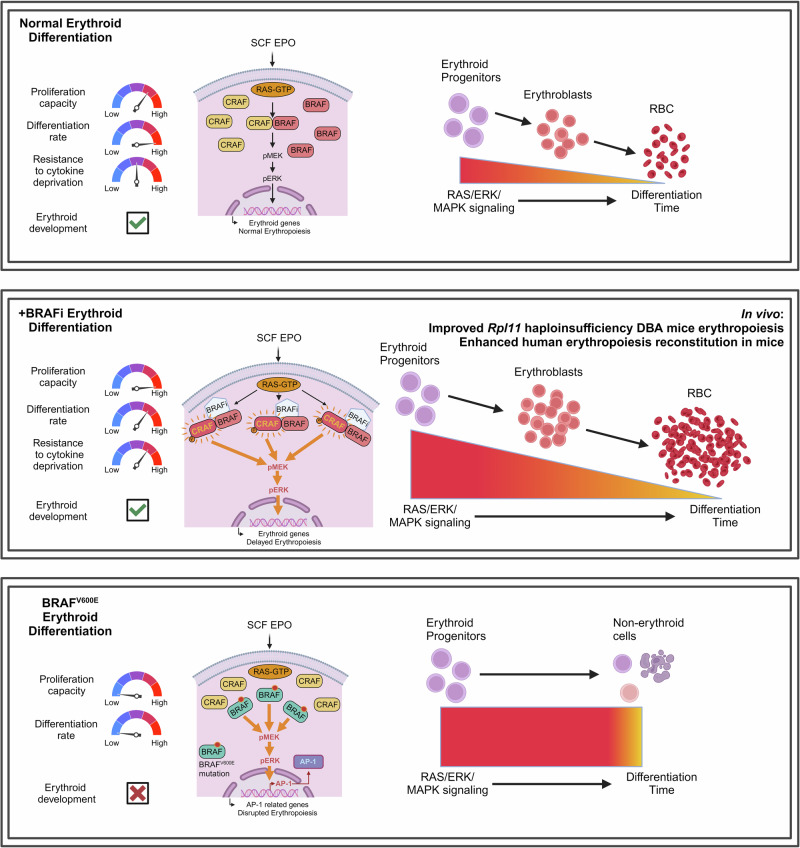
Erythropoiesis is a crucial process in hematopoiesis, yet it remains highly susceptible to disruption by various diseases, which significantly contribute to the global challenges of anemia and blood shortages. Current treatments like erythropoietin (EPO) or glucocorticoids often fall short, especially for hereditary anemias such as Diamond-Blackfan anemia (DBA). To uncover new erythropoiesis-stimulating agents, we devised a screening system using primary human hematopoietic stem and progenitor cells (HSPCs). We discovered that BRAF inhibitors (BRAFi), commonly used to treat BRAFV600E melanoma, can unexpectedly and effectively promote progenitor cell proliferation by temporarily delaying erythroid differentiation. Notably, these inhibitors exhibited pronounced efficacy even under cytokine-restricted conditions and in patient samples of DBA. Mechanistically, although these BRAFi inhibit the MAPK cascade in BRAFV600E mutant cells, they paradoxically act as amplifiers in wild-type BRAF cells, potently enhancing the cascade. Furthermore, we found that while the oncogenic BRAFV600E mutation disrupts hematopoiesis and erythropoiesis through AP-1 hyperactivation, BRAFi minimally impact HSPC self-renewal and differentiation. In vivo studies have shown that BRAFi can enhance human hematopoiesis and erythropoiesis in severe immunodeficient mouse models and alleviate anemia in the Rpl11 haploinsufficiency DBA model, as well as other relevant anemia models. This discovery underscores the role of the MAPK pathway in hematopoiesis and positions BRAFi as a promising therapeutic option for improving hematopoietic reconstitution and treating anemias, including DBA.


Conflict of interest statement

Competing interests: The authors declare no competing interests. Schematic figures were generated with BioRender ( https://app.biorender.com/ ).

Figures

Fig. 1
Fig. 1
BRAF inhibitors promoted the self-renewal of primary erythroid progenitors in vitro. a Drug treatment workflow in UCB-CD34+-derived in vitro erythroid differentiation culture system. “+” indicates BRAFi treatment in conjunction with a change of medium. b The drug dose-response assay for UCB-CD34+-derived erythroid culture was conducted, with total cell numbers counted on Day 12. The graph illustrates the fold difference in proliferation between the GDC-treated and control (DMSO) groups on Day 12. The dashed line indicates the fold change for the control group. c The growth curve of UCB-CD34+-derived erythroid culture over 14 days in vitro, starting from 1.2 × 104 cells on Day 0. The asterisks represent statistical differences obtained through two-way ANOVA test in cell number between the treatment groups and the control (DMSO) group. d Representative flow cytometry analysis of UCB-CD34+-derived erythroid cells in the control group (DMSO) and the GDC-0879-treated group on differentiation Day 9 (Left), Day 14 (Middle) and Day 16 (treated from Day 0–9) (Right). CD117 (c-kit), receptor for stem cell factor; CD71, transferrin receptor; CD235a (Glycophorin A), erythroid marker. CD235a+Hoechst- cells are regarded as enucleated reticulocytes. e Representative images of colony forming assay (CFA) of 300 UCB-hCD34+ cells seeded in Methocult H4435 and cultured for 14 days. (Left) Whole-plate view; (Right) BFU-E colony. Scale bar = 10 mm (Left), 500 μm (Right). f, g Colony number and ratio statics of panel (e). There was no significant difference between the two groups in the proportion of either colony in panel (f). h Quantification of total cell numbers, erythroid cell numbers and the myeloid lineage ratio of cells washed from Methocult medium on Day 14 in the CFA of panel (e). Erythroid cells are identified as CD235a+, and myeloid cells as CD11b+. i UCB-CD34+ cells were differentiated for 5 days, after which erythroid progenitor cells were sorted and seeded in Methocult medium. (Bottom) Strategy for sorting erythroid progenitor cells. Lin* includes CD2, CD3, CD14, CD16, CD19, CD56, CD235a, CD45RA, CD123, CD7, CD10, CD90, CD135, and CD41a. j Representative images of colony forming assay of 100 erythroid progenitor cells seeded in Methocult H4435 and cultured for 14 days. (Left) Whole-plate view; (Right) BFU-E colony. Scale bar = 10 mm (Left), 500 μm (Right). k, l Colony number and quantification of cell number of cells washed from Methocult medium on Day 14 in the CFA of panel (j). m Fold change in cell number of PBMCs from 5 healthy donors (HDs) cultured in an erythroid differentiation system on Day 9. Unless otherwise noted, all experiments used control (DMSO), SB-590885 at 1 μM, GDC-0879 at 2 μM, and Encorafenib at 0.5 μM. BFU-E burst forming unit-erythroid, CFU-E colony forming unit-erythroid, CFU-M colony forming unit-monocyte, CFU-GM colony forming unit-granulocyte macrophage, GEMM Granulocytic-erythrocytic-megakaryocytic-macrophage. Error bars represent the mean ± SD from three biological replicates. A two-tailed unpaired Student’s t-test was performed for the statistical comparison between two groups (ns, P> 0.05; *P < 0.05; **P < 0.01; ***P < 0.001; ****P < 0.0001)
Fig. 2
Fig. 2
BRAF inhibitors attenuated ineffective erythropoiesis under cytokine-restricted conditions. a, b Flow cytometry analysis of UCB-CD34+-derived erythroid cells in the control group and GDC-0879-treated group on differentiation Day 9 under normal and specified conditions (5% EPO [0.15 IU/mL EPO]; 0% SCF [0 ng/mL SCF]), using cell surface markers CD117, CD235a, and CD71, CD235a. Concentrations of other cytokines were kept unchanged as usual. c Histograms showing the differences in CD235a levels between GDC-treated and control erythroid cells under different cytokine-restricted conditions on Day 14. d Cell pellets of UCB-CD34+ derived erythroid cells cultured under different cytokine-restricted conditions on Day 14, with each group containing equivalent cell numbers in this image. e Growth curves of UCB-CD34+-derived erythroid cells, starting from 1.2 × 104 cells, treated with 2 μM GDC-0879 under the indicated conditions from Day 0 to Day 14. The asterisks indicate statistical differences in cell number between the treatment groups and the control group, as determined by a two-way ANOVA under the specified culture conditions. n = 3. f Flow cytometry analysis of UCB-CD34+-derived erythroid cells treated with DMSO or 2 μM GDC-0879 for 5 days and then subjected to cytokine deprivation (EPO, SCF and IL3) for 48 h, showing Annexin V-FITC (top) and PI (bottom) staining. g Whole-plate view of CFA with 200 UCB-CD34+ cells seeded in EPO-only Methocult H4430 and incubated under BRAFi (Encorafenib, GDC, or SB)-treated or control conditions for 14 days. Scale bar = 10 mm. h Statistical analysis of the area of 75 individual erythroid colonies in panel (g) on Day 14. Unless otherwise noted, all experiments used control (DMSO), SB-590885 at 1 μM, GDC-0879 at 2 μM, and Encorafenib at 0.5 μM. Error bars represent the mean ± SD. A two-tailed unpaired Student’s t-test was performed for the statistical comparison between two groups (****P < 0.0001)
Fig. 3
Fig. 3
BRAF inhibitor-induced amplification of the ERK/MAPK cascade in erythroid progenitor cells was dependent on CRAF and the active extracellular signaling. a Immunoblotting of MAPK signaling cascade proteins in UCB-CD34+-derived erythroblasts cultured under normal conditions and treated on Day 9 with Encorafenib (0.5 μM), GDC-0879 (2 μM), or SB-590885 (0.5 μM) for 30 min. b Levels of phosphorylated and total ERK proteins in UCB-CD34+-derived erythroblasts on Day 9, cultured under normal conditions and treated with different BRAF inhibitors for 30 min. c Median fluorescence intensity (MFI) statistics of intracellular flow cytometry of phosphorylated-ERK-FITC of 7-day differentiated erythroid cells from UCB-CD34+ treated with 2 μM GDC or 200 nM PMA for different time period. The dashed line indicates the fluorescence intensity of the negative control. n = 3. d Immunofluorescence staining of phosphorylated-ERK-FITC, erythroid markers CD235a-APC and CD71-PE, and DAPI of 7-day differentiated erythroid cells from UCB-CD34+ treated for 30 min. Scale bar = 10 μm. e Representative intracellular flow cytometry histograms and MFI statistics of phosphorylated-ERK-FITC in 293 T cells under different culture system treated in different chemicals and concentration for 30 min. DMEM: DMEM with 10% FBS; bFGF (basic fibroblast growth factor), 50 ng/mL; IGF1 (insulin-like growth factor 1), 50 ng/mL. n = 3. f Heatmap of the top 20 proteins that were most significantly upregulated and downregulated respectively by 3 × Flag-BRAF interaction proteins in the control group (DMSO) and the 30-minute 1 μM SB-treated group, identified through flag-affinity immunoprecipitation-mass spectrometry (IP-MS) of 3 × Flag-BRAF in BRAF-overexpressing K562 cells. The components of the RAF protein dimer complex are bolded. cutoff, p < 0.05. g Volcano plot of 3 × Flag-BRAF interacting proteins in IP-MS of SB-treated and control groups in K562 cells. cutoff: p-adj < 0.05, foldchange > 2. The components of the RAF protein dimer complex are bolded. h Heatmap of the top 20 proteins that were most significantly upregulated and downregulated respectively by 3 × Flag-BRAF interaction proteins in the control group (DMSO) and the 30-minute 200 nM PMA-treated group, identified through Flag-affinity IP-MS of 3 × Flag-BRAF in BRAF-overexpressing K562 cells. cutoff, p < 0.01. i Volcano plot of the differentially expressed genes (DEGs) between CD71+ erythroid progenitor cells treated with 2 μM GDC for 72 h and control (DMSO) groups. DEGs were defined with a cutoff fold change > 1.5, FDR (false discovery rate) < 0.1. j The Molecular Signatures Database (MSigDB) hallmark gene sets enrichment analysis for DEGs between CD71+ erythroid progenitor cells treated with 2 μM GDC for 72 h and the control group. k Representative KEGG enrichment analysis of downregulated DEGs in the GDC-treated group compared to the control group. Error bars represent the mean ± SD
Fig. 4
Fig. 4
BRAFV600E, rather than BRAF inhibitors, disrupted hematopoiesis and erythropoiesis. a Schematic diagram of lentiviral transduction and culture strategy of primary human UCB-CD34+ HSPCs. b Representative images of 300 HSPCs pre-cultured for 2 days in erythroid differentiation medium before seeded into Methocult H4435. c Corresponding colony counts and lineage ratios calculated on Day 14 of panel (b). Scale bar = 10 mm. d Flow cytometry analysis of HSPC surface markers on Day 12 in HSPC retention medium (top), and erythroid cell surface markers on Day 14 in erythroid differentiation medium (bottom), following lentiviral transduction or drug treatment. The control (Ctrl) and GDC groups were transduced with MSCV-GFP empty vector and treated with DMSO or 2 μM GDC-0879, respectively
Fig. 5
Fig. 5
BRAFV600E, rather than BRAF inhibitors, disrupted hematopoiesis and erythropoiesis via hyperactivating AP-1 family transcription factors. a K-means clustering heatmap of the top 2000 most variable genes in UCB-CD34+ cells across 3 groups on Day 6 of treatment/transduction in HSPCs retention medium. b Semantic plot of the GO terms enriched in gene cluster A from panel (a), generated using online tool GENE ONTOLOGY (GO) TOOLS and REVIGO (http://revigo.irb.hr/) to illustrate the similarity among non-redundant GO terms. Bubble color represents the log10(p-value), and bubble size reflects the geneset size of the GO term in the Gene Ontology Biological Process (GOBP) database. Representative GOBP terms are in bold font, with the bubbles of the corresponding processes outlined in light grey. c Principal component analysis (PCA) of ATAC-seq data on UCB-CD34+ cells on Day 6 of treatment or lentiviral transduction in HSPCs retention medium. WT, BRAFWT; V600E, BRAFV600E. d Differential chromatin accessibility peaks in the UCB-CD34+ ATAC-seq analysis, comparing the Ctrl (DMSO), GDC and BRAFWT (CGW) group’s common region to the BRAFV600E (V) group. The value 0 represents the peak center in ATAC-seq. e Known motif enrichment analysis of differential ATAC-seq peaks in genome from the CGW group and the BRAFV600E group using HOMER software. The table displays top transcription-factor-binding motifs enriched in the ATAC-seq data of the CGW group (Top, blue shade) and the BRAFV600E group (Bottom, red shade). f Gene Set Enrichment Analysis (GSEA) analysis of the AP-1 family gene set (AP1_C) in DEGs comparing BRAFV600E vs. control groups and GDC vs. control groups. g Schematic diagram of the experimental workflow for electroporation BRAFV600E and ATAC-seq of 10-Day erythroid differentiated UCB-CD34+ cells. h Known motif enrichment analysis of differentially binding (diffbind) ATAC-seq peaks of promoter region between the GDC group and the BRAFV600E group cells compared with control group in panel (g) using HOMER software. The table displays top enriched transcription-factor-binding motifs in the ATAC-seq data of the GDC group (Top, blue shade) and the BRAFV600E group compared with control group (Bottom, red shade). i Number of proteins up- and down-regulated in Flag-affinity IP-MS in BRAFWT overexpressing cells treated with 1 μM SB for 30 min, or in BRAFV600E overexpressing 293 T, compared to the BRAFWT overexpressing group. Protein cutoff foldchange > 1.5. j Heatmap showing the abundance of AP-1-associated proteins (GSEA gene set AP1_C) interacting with Flag-BRAFWT (with or without BRAFi) or Flag-BRAFV600E in IP-MS. For ATAC-seq and RNA-seq, both the control and GDC groups were transfected with MSCV-GFP empty vector and treated with DMSO or 2 μM GDC-0879, respectively
Fig. 6
Fig. 6
BRAF inhibitors promoted erythroid and megakaryocytic engraftment in human hematopoietic reconstitution, and alleviated anemia in vivo. a Schematic diagram of the human hematopoietic reconstitution model in irradiated NPSG mice. Q.O.D., every other day. b Representative flow cytometry analysis of the proportion of erythroid cells and megakaryocytes in human engraftment and erythroid differentiation in the bone marrow of NPSG mice 14 weeks after transplantation. c Statistics on the proportion of erythroid cells and megakaryocytes in human engraftment in NPSG mice bone marrow 14 weeks after transplantation. n = 7 in each group in NPSG model. Each dot represents one mouse. d Schematic diagram of the human hematopoietic reconstitution model in irradiated-free NCG-X mice (e). Representative flow cytometry analysis of the proportion of erythroid cells and megakaryocytes in human engraftment and erythroid differentiation in the bone marrow of NCG-X mice 8 weeks after transplantation. f Statistics on the proportion of erythroid cells and megakaryocytes in human engraftment in the bone marrow of NCG-X mice 8 weeks after transplantation. n = 5 in each group in NCG-X mice model. Each dot represents one mouse. g Schematic diagram of GDC administration in the cisplatin-induced myelosuppression model. Purple arrows indicate cisplatin induction; blue shaded box indicates duration of treatments (vehicle or GDC). Blood cell parameters were measured in Week 2 and bone marrow cell composition was analyzed in Week 3 through flow cytometry. Each dot represents one mouse. h Red blood cell parameters were measured from mouse peripheral blood after 2 weeks of treatment. For the control group, n = 5; for the vehicle group, n = 15; for the GDC group, n = 14. Each dot represents one mouse. Error bars represent the mean ± SD. A two-tailed unpaired Student’s t-test was performed for the statistical comparison between two groups (ns, P > 0.05; *P < 0.05; **P < 0.01; ***P < 0.001)
Fig. 7
Fig. 7
BRAF inhibitors improved erythroid proliferation in cells from DBA patients in vitro and alleviated anemia in Rpl11 haploinsufficiency mice in vivo. a Representative images of erythroid colonies derived from 105 PBMCs of DBA patients with RPL5 or RPL11 mutations, seeded in Methocult H4435 for 14 days. b Quantification of erythroid colony area from DBA patients’ PBMCs, as shown in panel (a) on Day 14. c Rpl11 mRNA levels measured by qRT-PCR in bone marrow and spleen using 2 individual primer pairs in Rpl11+/lox (21 weeks after TAM induction) and Rpl11+/+ mice. Gapdh mRNA levels were used as internal control. Each dot represents a technical replicate, n = 3. d Red blood cell (RBC) count for Rpl11+/+ and Rpl11+/lox (the +/lox vehicle group in panel (e)) mice after the initiation of TAM induction at week 0. The dashed line indicates that the Rpl11+/lox group was administered either vehicle or GDC started from week 7. The asterisks represent the results of the t-test between the two groups at each time point. The p-value from the two-way ANOVA for the comparison between the two groups is also shown in panel (d). e RBC count, hemoglobin (HGB), hematocrit (HCT), mean corpuscular volume (MCV), white blood cell (WBC) and platelet (PLT) count were measured after 5 weeks of GDC administration in the Rpl11 haploinsufficiency DBA mouse model (n = 5 or 6). Each dot represents one mouse. Error bars represent the mean ± SD. A two-tailed unpaired Student’s t-test was performed for the statistical comparison between two groups (ns, P > 0.05; *P < 0.05; **P < 0.01; ***P < 0.001; ****P < 0.0001)
Fig. 8
Fig. 8
Graphic summary. (Top Panel: Normal Erythroid Differentiation) SCF and EPO activate the RAS/ERK/MAPK pathway, supporting and balanced erythroid progenitor proliferation, differentiation, and normal RBC production. (Middle Panel: BRAFi-Enhanced Erythroid Differentiation) BRAF inhibitors (BRAFi) paradoxically amplify RAS/ERK/MAPK signaling, promoting erythroid progenitor proliferation and temporarily delaying differentiation, leading to increased RBC production. (Bottom Panel: BRAFV600E-Mediated Erythroid Disruption) The constitutive activation of BRAF (BRAFV600E mutation) disrupts erythroid differentiation, leading to abnormal cell fate decisions and impaired erythropoiesis due to excessive MAPK signaling and hyperactivation of AP-1. Graphic summary was generated with BioRender (https://app.biorender.com/)

References

    1. Dzierzak, E. & Philipsen, S. Erythropoiesis: development and differentiation. Csh Perspect. Med.3, a011601 (2013). - PMC - PubMed
    1. Hattangadi, S. M., Wong, P., Zhang, L., Flygare, J. & Lodish, H. F. From stem cell to red cell: regulation of erythropoiesis at multiple levels by multiple proteins, RNAs, and chromatin modifications. Blood118, 6258–6268, (2011). - PMC - PubMed
    1. Palis, J. Primitive and definitive erythropoiesis in mammals. Front. Physiol.5, 3 (2014). - PMC - PubMed
    1. Lee, H. Y. et al. PPAR-alpha and glucocorticoid receptor synergize to promote erythroid progenitor self-renewal. Nature522, 474–477 (2015). - PMC - PubMed
    1. Gao, X. et al. TGF-beta inhibitors stimulate red blood cell production by enhancing self-renewal of BFU-E erythroid progenitors. Blood128, 2637–2641 (2016). - PMC - PubMed

Publication types

MeSH terms

Substances