. 2024 Dec;56(12):2659-2672.
doi: 10.1038/s12276-024-01356-2. Epub 2024 Dec 2.

A stearate-rich diet and oleate restriction directly inhibit tumor growth via the unfolded protein response

Affiliations

A stearate-rich diet and oleate restriction directly inhibit tumor growth via the unfolded protein response

Jumpei Ogura et al. Exp Mol Med. 2024 Dec.

Abstract

Fatty acids are known to have significant effects on the properties of cancer cells. Therefore, these compounds have been incorporated into therapeutic strategies. However, few studies have examined the effects of individual fatty acids and their interactions in depth. This study analyzed the effects of various fatty acids on cancer cells and revealed that stearic acid, an abundant saturated fatty acid, had a stronger inhibitory effect on cell growth than did palmitic acid, which is also an abundant saturated fatty acid, by inducing DNA damage and apoptosis through the unfolded protein response (UPR) pathway. Intriguingly, the negative effects of stearate were reduced by the presence of oleate, a different type of abundant fatty acid. We combined a stearate-rich diet with the inhibition of stearoyl-CoA desaturase-1 to explore the impact of diet on tumor growth. This intervention significantly reduced tumor growth in both ovarian cancer models and patient-derived xenografts (PDXs), including those with chemotherapy resistance, notably by increasing stearate levels while reducing oleate levels within the tumors. Conversely, the negative effects of a stearate-rich diet were mitigated by an oleate-rich diet. This study revealed that dietary stearate can directly inhibit tumor growth through mechanisms involving DNA damage and apoptosis mediated by the UPR pathway. These results suggest that dietary interventions, which increase stearic acid levels while decreasing oleic acid levels, may be promising therapeutic strategies for cancer treatment. These results could lead to the development of new cancer treatment strategies.


Conflict of interest statement

Competing interests: E.N. has received research funding from Sumitomo Pharma Co., Ltd. The other authors declare that they have no competing interests.

Figures
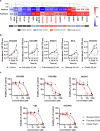
Fig. 1
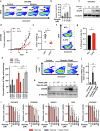
Fig. 1. Different antiproliferative effects of stearate and palmitate on various cancer cell lines.
a Clustering analysis of the results of the proliferation assay. Data from MTT proliferation assays of samples, including lung, breast, ovarian, and colon cancer cell lines, were subjected to k-means clustering analysis based on absorbance. The cells were cultured for 72 h and treated with 50 µM stearate or palmitate, followed by measurement using an MTT assay. The results were normalized to those of the fatty acid-free control. The ovarian cancer cell lines are highlighted in red (n = 6). b MTT assay of ovarian cancer cell lines. Ovarian cancer cell lines (OVCAR5, OVCAR8, SKOV3, ES-2, and OVCAR3) were treated with 50 µM free fatty acids (palmitate, palmitoleate, stearate, or oleate) for 72 h and then subjected to an MTT assay. Proliferation was assessed every 24 h. Data are presented as the means ± SEMs (n = 4; *p < 0.05, Mann–Whitney test). c Dose‒response curves for various fatty acids in different ovarian cancer cell lines. Representative dose‒response curves for stearate, palmitate, and oleate are shown based on quadruplicate data.
Fig. 2
Fig. 2. Stearate induces apoptosis and DNA damage in ovarian cancer cells in vitro and in vivo, whereas oleate mitigates stearate-induced cytotoxicity.
a, b Flow cytometry image of stearate-induced apoptosis with Annexin V/PI staining and bar graphs. The apoptosis of OVCAR5 ovarian cancer cells treated with various stearate concentrations was analyzed using Annexin V/PI staining. Bar graphs (b) depict the percentage of Annexin V-positive cells compared with that in untreated controls, as determined using flow cytometry (a). The data are presented as the means ± SEMs (n = 4; *p < 0.05, Wilcoxon test). c Analysis of γH2AX expression using western blotting. The OVCAR5 cell line was treated with the indicated stearate concentrations for 24 h, and γH2AX expression was determined. α-Tubulin served as the loading control. d–g Xenograft mouse models harboring OVCAR5. Tumor growth curves (d) and tumor weights at collection (e). Data are presented as the means ± SEMs (n = 6; *p < 0.05, **p < 0.01, Mann–Whitney test). Apoptosis assay of tumor tissue using flow cytometry (f) and histograms (g) presenting the percentages of apoptotic cells (n = 4; *p < 0.05 and **p < 0.01, Mann–Whitney test). h Fatty acid levels in OVCAR5 xenografts assessed via LC‒MS. Fatty acid concentrations were quantified in tumors from mice fed the NFD, S-HFD, or O-HFD (identical to those in Fig. S9a, d–f). i, j Flow cytometry analysis of stearate-induced apoptosis with Annexin V/PI staining (i). The bar graph (j) shows the ratio of Annexin V-positive cells to control cells. Means ± SEMs (n = 6, **p < 0.01, ns; not significant, Wilcoxon matched-pairs test). k Analysis of γH2AX expression using western blotting. OVCAR5 cells were cultured for 24 h with the indicated concentrations of oleate and stearate, and γH2AX expression was analyzed. α-Tubulin served as a loading control. l Viability of various cell lines exposed to varying concentrations of stearate and oleate. The cells were treated with the indicated concentrations of stearate and coincubated with 50 µM oleate for 72 h. Cell viability, relative to that of the control cells, was assessed using an MTT assay (n = 4; *p < 0.05, Mann–Whitney test).
Fig. 3
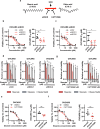
Fig. 3. The inhibition of unsaturation increases stearate toxicity, and exogenous oleate mitigates it.
a Proposed functional mechanism of SCD in stearate metabolism. shRNA-mediated knockdown and CAY10566 were used to inhibit SCD, the enzyme that converts stearate to oleate. b IC50 values of stearate in shSCD-treated OVCAR5 cells. SCD knockdown lowered the IC50 (n = 6; *p < 0.05 and **p < 0.01, Mann–Whitney test). c Analogous IC50 findings in shSCD-treated OVCAR8 cells (n = 6; *p < 0.05 and **p < 0.01, Mann–Whitney test). d Effects of oleate on the viability of stearate-treated shSCD-transfected OVCAR5 cells. The cells were treated with the indicated concentrations of stearate and coincubated with 50 µM oleate for 72 h; viability was measured via an MTT assay (n = 6; *p < 0.05 and **p < 0.01, Mann–Whitney test). IC50 values of stearate in OVCAR5 (e) and OVCAR8 (f) cells treated with 1 μM CAY10566 or the DMSO control (n = 6; **p < 0.01, Mann–Whitney test). g Cell viability in response to treatment with stearate and oleate in the presence of 1 μM CAY10566. The cells were treated with the indicated concentrations of stearate and coincubated with 50 µM oleate for 72 h; viability was assessed after 72 h via an MTT assay (n = 6; *p < 0.05, Mann–Whitney test).
Fig. 4
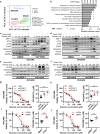
Fig. 4. Stearate induces cytotoxicity via ER stress and CHOP activation.
a RNA-Seq of OVCAR5 cells subjected to various treatments. The cells were treated and cultured for 24 h before RNA-seq. Principal component analysis revealed distinct gene expression profiles without treatment-based separation. b Top 10 functionally enriched terms. The biological processes induced by stearate compared with those induced by DMSO are shown. Representative western blot analysis of proteins involved in the unfolded protein response (UPR), apoptosis, and DNA damage in OVCAR5 (c) and OVCAR8 (d) cells treated with the indicated concentrations of stearate and oleate. GAPDH was used as an internal control. Representative western blot analysis of protein expression following the knockdown of CHOP (shCHOP) in OVCAR5 (e) and OVCAR8 (f) cells. α-Tubulin was used as an internal control. IC50 values of stearate in shCHOP-transfected OVCAR5 (g) and OVCAR8 (h) cells (n = 6; *p < 0.05 and **p < 0.01, Mann–Whitney test). IC50 values of stearate in OVCAR5 (i) and OVCAR8 (j) cells treated with 5 μM 4-PBA or the DMSO control (n = 6; **p < 0.01, Mann–Whitney test).
Fig. 5
Fig. 5. Differential cellular response to palmitate and stearate.
RNA-seq followed by principal component analysis of OVCAR5 cells (a) and OVCAR8 cells (b). The cells were cultured for 24 h under different conditions (control, 50 µM palmitate or 50 µM stearate) before RNA extraction. c, d Analysis of GO terms. The top 10 functionally enriched pathways in the OVCAR5 cells (c) and OVCAR8 cells (d) are shown. Pathways related to the UPR are circled in red, and pathways associated with incorrectly folded proteins are circled in red dotted lines. Representative images of western blot analyses of OVCAR5 cells (e) and OVCAR8 cells (f). The cells were cultured for 24 h with various concentrations of palmitate or stearate in the presence or absence of oleate, as shown. The levels of CHOP, γH2AX and cleaved caspase3 were analyzed. α-Tubulin was used as a loading control.
Fig. 6
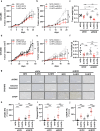
Fig. 6. The inhibition of unsaturation along with dietary supplementation with stearate hinders tumor growth, which is reversed by the addition of oleate.
Tumor growth in mice following subcutaneous injection of control (shCtr) (a) or SCD-knockdown (shSCD) (b) OVCAR5 cells. The mice were divided into three dietary groups, namely, the normal-fat diet (NFD), O-HFD, and S-HFD groups, and received the intervention from 3 days before injection until the end of the study (n = 6). The data are presented as the means ± SEMs. *p < 0.05, **p < 0.01, and ns stands for not significant; the Mann–Whitney test was applied between shCtr samples and the Wilcoxon matched-pairs signed rank test was applied between shCtr and shSCD-1 pairs. c Weights of the tumors at the end of the experimental period. d–f Validation of the results using OVCAR8 cells (n = 6). The data are presented as the means ± SEMs. *p < 0.05, **p < 0.01, and ns stands for not significant; the Mann–Whitney test was applied between shCtr samples and the Wilcoxon matched-pairs signed rank test was applied between shCtr and shSCD-1 pairs. g Representative images of immunohistochemical staining of tumor tissues derived from shCtr-OVCAR5 cells or shSCD-1-OVCAR5 cells depicting the levels of cleaved caspase-3, γH2AX, and CHOP. h–j Quantitative analysis of cleaved caspase-3, γH2AX, and CHOP levels in tissue. (n = 30; ***p < 0.001, ns: not significant, Mann–Whitney test).
Fig. 7
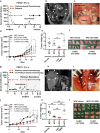
Fig. 7. Supplementation with stearate, along with the inhibition of unsaturation, have significant antiproliferative effects on ovarian cancer patient-derived xenograft (PDX) models.
a Longitudinal assessment of serum CA-125 levels during therapeutic intervention in a patient with high-grade serous ovarian carcinoma (source of PDX82). b Magnetic resonance imaging (MRI) of a 38-year-old woman (source of PDX82). The sagittal T2-weighted MR image highlights the tumor mass; the white arrow indicates the tumor. c Diagnostic laparoscopy reveals the frozen pelvis phenomenon due to significant tumor occupation in the pelvic cavity. d PDX82 proliferation in a mouse model under various nutritional and CAY10566 treatment conditions (n = 4; *p < 0.05, Mann–Whitney test). e End-point tumor mass in mice harboring PDX82 (n = 4; *p < 0.05, **p < 0.01, Mann–Whitney test). f PDX82 tumor specimens. Representative images from each condition are shown. g Longitudinal assessment of serum CA-125 levels during therapeutic intervention in a patient with high-grade serous ovarian carcinoma (source of PDX72). h MRI of a platinum-resistant tumor in a 43-year-old woman (source of PDX72); the coronal T2-weighted MR image highlights the tumor mass, and the white arrow indicates the tumor. i Intraoperative abdominal image captured during hepatic metastatic tumor resection. j PDX72 tumor proliferation in a mouse model under various nutritional and CAY10566 treatment conditions (n = 6; *p < 0.05 and **p < 0.01, Mann–Whitney test). k End-point tumor mass in the PDX72 model (n = 6; **p < 0.01, Mann–Whitney test). l PDX72 tumor specimens; images from each experimental group are shown.

References

    1. Lauby-Secretan, B. et al. Body fatness and cancer-viewpoint of the IARC working group. N. Engl. J. Med.375, 794–798 (2016). - PMC - PubMed
    1. Yang, J. et al. High-fat diet promotes colorectal tumorigenesis through modulating gut microbiota and metabolites. Gastroenterology162, 135–149.e2 (2022). - PubMed
    1. Beyaz, S. et al. High-fat diet enhances stemness and tumorigenicity of intestinal progenitors. Nature531, 53–58 (2016). - PMC - PubMed
    1. Labbé, D. P. et al. High-fat diet fuels prostate cancer progression by rewiring the metabolome and amplifying the MYC program. Nat. Commun.10, 4358 (2019). - PMC - PubMed
    1. Wieder, N. et al. FALCON systematically interrogates free fatty acid biology and identifies a novel mediator of lipotoxicity. Cell Metab.35, 887–905.e11 (2023). - PMC - PubMed

MeSH terms