. 2024 Dec 2;25(1):301.
doi: 10.1186/s13059-024-03438-w.

Functional screening reveals genetic dependencies and diverging cell cycle control in atypical teratoid rhabdoid tumors

Affiliations

Functional screening reveals genetic dependencies and diverging cell cycle control in atypical teratoid rhabdoid tumors

Daniel J Merk et al. Genome Biol. .

Abstract

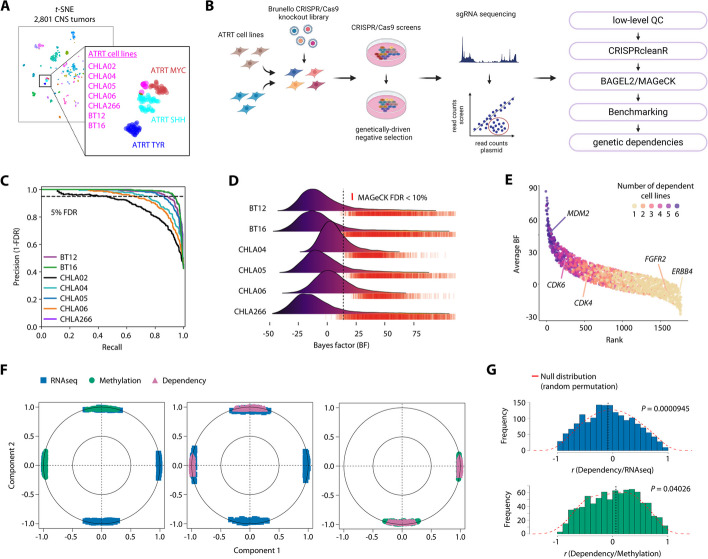
Background: Atypical teratoid rhabdoid tumors (ATRT) are incurable high-grade pediatric brain tumors. Despite intensive research efforts, the prognosis for ATRT patients under currently established treatment protocols is poor. While novel therapeutic strategies are urgently needed, the generation of molecular-driven treatment concepts is a challenge mainly due to the absence of actionable genetic alterations.

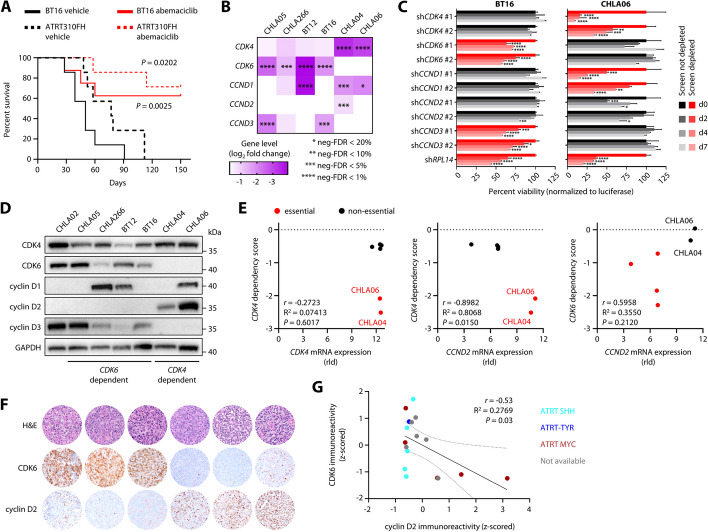
Results: We here use a functional genomics approach to identify genetic dependencies in ATRT, validate selected hits using a functionally instructed small molecule drug library, and observe preferential activity in ATRT cells without subgroup-specific selectivity. CDK4/6 inhibitors are among the most potent drugs and display anti-tumor efficacy due to mutual exclusive dependency on CDK4 or CDK6. Chemogenetic interactor screens reveal a broad spectrum of G1 phase cell cycle regulators that differentially enable cell cycle progression and modulate response to CDK4/6 inhibition in ATRT cells. In this regard, we find that the ubiquitin ligase substrate receptor AMBRA1 acts as a context-specific inhibitor of cell cycle progression by regulating key components of mitosis including aurora kinases.

Conclusions: Our data provide a comprehensive resource of genetic and chemical dependencies in ATRTs, which will inform further preclinical evaluation of novel targeted therapies for this tumor entity. Furthermore, this study reveals a unique mechanism of cell cycle inhibition as the basis for tumor suppressive functions of AMBRA1.

Keywords: AMBRA1; CDK4/6 inhibitors; CRISPR-Cas9; Functional screening; Genetic dependencies; Rhabdoid tumors; Tumor suppressor.


Conflict of interest statement

Declarations. Ethical approval and consent to participate: All animal experiments were approved by the Regierungspräsidium Tübingen (N 09/20 G and N 11/20 M). All experiments were conducted in accordance with the animal law. Animals were closely monitored. For reporting, we followed the ARRIVE guidelines (version 2.0). Consent for publication: Not applicable. Competing interests: GT has served on advisory boards (Bayer, Boehringer Ingelheim, CureVac, Miltenyi Biomedicine, Novocure), as a consultant (Bayer, Boehringer Ingelheim, CureVac), as steering committee member in non-interventional trials (Bayer, Novocure), as a speaker (Novocure, Servier), and financial compensation for all these activities was provided as institutional funding to the University Hospital Tübingen. FP has been affiliated with the Broad Institute while contributing to this study, but is now working at Merck Research Laboratories, Cambridge, USA. This new affiliation does not constitute any financial interest or any other engulfment associated with this study.

Figures

Fig. 1
Fig. 1
CRISPR-Cas9 knockout screens reveal genetic dependencies of ATRT. A t-SNE dimensionality reduction of global DNA methylation profiles from seven human ATRT cell lines (indicated in red) and a reference cohort of 2801 primary CNS tumors. B Overview of experimental approach using CRISPR-Cas9 knockout screens to identify genetic dependencies in ATRT cells. C Precision-recall-curve analyses for seven ATRT cell lines based on distribution of known essential and non-essential genes. Dashed line denotes 5% false discovery rate (FDR). D Ridgeline plot illustrating the distribution of gene Bayes factors for six ATRT cell lines calculated using BAGEL2. Vertical dashed line illustrates the lowest Bayes factor across cell lines at FDR < 10%. Rugs indicate genes with an FDR < 10% for depletion (neg. FDR) as determined by MAGeCK-RRA. E Illustration of the number of dependent ATRT cell lines for all context-specific essential fitness genes. F Correlation circle plots illustrating results from pairwise sPLS analyses integrating gene expression, gene promoter methylation and gene dependency. Shown are correlations of the top 100 variables with the first two components. In between the original variables, acute angles (< 90°) indicate positive correlations, while obtuse angels (> 90°) indicate negative correlations. G Bar graphs showing the density distributions of correlation coefficients for dependency and gene expression or dependency and gene promoter methylation of context-specific essential genes. Red dashed line illustrates the null distribution as generated by random permutation. Statistics are derived from robust rank aggregation (MAGeCK RRA) or 10-fold cross-validation (BAGEL2) (C, D), and a Wilcoxon rank sum test (G)
Fig. 2
Fig. 2
Functionally-instructed chemical dependencies in ATRT. A Graphical summary for the generation of a functionally-instructed drug library and drug screen analysis details. Venn diagram showing categorization of context-specific essential genes into druggable categories as determined by the Drug Gene Interaction database highlighting selected drug classes. B Unsupervised hierarchical clustering (1 minus Pearson correlation, average linkage) of z-scored GRiAOC values derived from a three-dose drug screen (0.01 μM, 0.1 μM, 1 μM for 72 hours) in 19 different human cancer cell lines. ATRT tumor cell lines are indicated in red. Broadly cytotoxic compounds are shown in orange, drugs previously shown to act in an ATRT subgroup-dependent manner are shown in blue. C Kernel density estimation and statistical comparison of z-scored GRiAOC values from functionally-instructed drugs grouped by ATRT and non-ATRT cell lines. D Graph illustrating the log2 fold change in GRiAOC and the corresponding q value of ATRT cell lines as compared to non-ATRT control cell lines. Selected drug classes are color coded. E Heat maps illustrating the Jaccard indices (top) and the corresponding significance (bottom) of pairwise intersections of context-specific essential genes. The order of the heat map was determined by unsupervised hierarchical clustering (1 minus Pearson correlation, average linkage) of the samples based on their Jaccard indices. F 15 point GRi dose response curve analyses for selected small molecules in ATRT-SHH (CHLA02, CHLA04, CHLA05) and ATRT-TYR/MYC (BT12, BT16, CHLA06, CHLA266) cell lines. Mean GRi50 values for ATRT-SHH and ATRT-TYR/MYC subgroup cell lines are shown
Fig. 3
Fig. 3
CDK4 and CDK6 are distinct predictors for CDK4/6 inhibitor sensitivity in ATRT. A Kaplan-Meier survival analyses of intracranial transplantation tumor mouse models (BT16 and ATRT310FH) treated daily with 75 mg/kg abemaciclib or vehicle (n = 7 for each condition and model), monitored for 150 days after tumor cell transplantation. B Heat map illustrating gene level log2 fold changes and corresponding FDR statistics for CDK4, CDK6, and all D-type cyclins in ATRT CRISPR knockout screens. C Bar graphs showing the effect of shRNA-mediated knockdown of CDK4, CDK6, CCND1, CCND2, and CCND3 in BT16 and CHLA06 cells (n = 3 independent experiments, *P < 0.05, **P < 0.01, ***P < 0.001, ****P < 0.0001). Control shRNAs target the pan-essential gene RPL14 or the luciferase gene for normalization. D Western blot analyses showing the protein expression levels of CDK4, CDK6, and D-type cyclins in the indicated ATRT cell lines. Note that profiles for CDK4 or CDK6 dependency were not available for CHLA02 cells. E Correlation analyses to illustrate CDK4 or CDK6 dependency prediction by CCND2 and CDK6 mRNA expression. Dependency for the gene on the y axis is indicated by red color. F Representative H&E stains and immunohistochemistry for CDK6 and cyclin D2 in tumor tissue from 6 ATRT patients (each column corresponds to one patient). G Correlation analysis of immunoreactivity for CDK6 and cyclin D2 in all analyzed ATRT patient tissues (n = 17). Dashed lines indicate the 95% confidence interval. Data are shown as mean ± SEM (C). Statistics are derived from a Log-rank test (A), robust rank aggregation (B), two-way ANOVA with Dunnett correction (C), and t tests (E, G)
Fig. 4
Fig. 4
G1 phase cyclins are diverging regulators of response to CDK4/6 blockade and cell cycle progression in ATRT cells. A Scatter and rank plots for screening data from CRISPR-dCas9-VP64 chemogenetic screens. BT16 (left) and CHLA06 cells (right) were treated with the CDK4/6 inhibitors (abemaciclib or palbociclib) or DMSO, and MAGeCK MLE was used to model common differences in CDK4/6 inhibitor treated screens as compared to either the DMSO control or the plasmid DNA reference (pDNA). B GRi dose response curve analyses for ATRT cells overexpressing G1 phase cyclins and comparison of GRiAOC values. Statistically significant differences in GRiAOC values are highlighted. C Analyses of clonogenic survival of ATRT cell lines under increasing concentrations of abemaciclib (200 nM to 800 nM). See Additional file 1: Fig. S8E for statistics. D Scatter plot illustrating common and differential gene expression changes in BT16 and CHLA06 cells upon CDK4/6 blockade. Common suppression of S and G2/M phase-associated genes as a result of G1 phase arrest is indicated in orange/yellow. Genes with differential gene expression changes in both cell lines as determined by likelihood ratio test (LRT) are highlighted in magenta. E Volcano plot associating the absolute difference in gene expression changes between BT16 and CHLA06 cells and its corresponding LRT P value for all annotated cyclins. Data are shown as mean ± SD (B). Statistics are derived from maximum likelihood estimation (A), one-way ANOVA with Dunnett correction (B), and a likelihood ratio test (D, E)
Fig. 5
Fig. 5
AMBRA1 is a context-dependent tumor suppressor. A Scatter and rank plots for screening data from CRISPR-Cas9 knockout drug screens. MAGeCK MLE was used to identify common screen hits in BT16 (left) and CHLA06 cells (right) that were treated with CDK4/6 inhibitors (abemaciclib or palbociclib) and DMSO by comparing drug screens to either the DMSO control or the plasmid DNA reference (pDNA). B Effect of loss of AMBRA1 on the proliferation of ATRT cells as measured by log2 fold change in cell number over 8 days for AMBRA1 knockout cells compared to control cells. C Alluvial plots illustrating changes in cell cycle distribution of ATRT cells upon loss of AMBRA1. See Additional file 1: Fig. S9G for statistics. D Effect of AMBRA1 knockout in 1150 human cancer cell lines from DepMap. Boxes illustrate primary diseases in which the knockout effect of AMBRA1 significantly differed from all other cell lines. HNSCC: Head and Neck Squamous Cell Carcinoma. E The top 100 pre-computed genetic associations for AMBRA1 in DepMap. Selected genes that show a skewed gene effect distribution across human cancer cell lines are indicated. F Correlation of AMBRA1 and BRAF gene knockout effects in DepMap, highlighting melanoma and rhabdoid cancer cell lines. Data are shown as mean ± SD (B). Statistics are derived from maximum likelihood estimation (A), and t tests (B, D)
Fig. 6
Fig. 6
AMBRA1 tumor suppressor activity is associated with regulation of G2/M phase mediators. A Volcano plots showing changes in protein levels for 39 cell cycle-associated regulators in ATRT cells upon loss of AMBRA1 as assessed by DigiWest. Left, common changes in protein levels across four ATRT cell lines upon AMBRA1 knockout. Right, context-specific changes in protein levels in AMBRA1 responder (CHLA06 and CHLA266) as compared to AMBRA1 non-responder ATRT cell lines (BT12 and BT16) upon loss of AMBRA1. B Western blot analyses for control and sgAMBRA1 CHLA06 cells with or without overexpression of AURKA (AURKA OE). Note AURKA and CDK1 overexpression driven by loss of AMBRA1 alone. C Effect of gain of AURKA on the proliferation of ATRT cells on control and sgAMBRA1 background. D Effect of gain of AURKA on cell cycle phase distributions of control and sgAMBRA1 ATRT cells. Data are shown as mean ± SD (B). Statistics are derived from and Welch’s t tests (A), and from paired t tests (C)
Fig. 7
Fig. 7
AMBRA1 regulates ubiquitin-dependent degradation of aurora kinases in a context-dependent manner. A Complex structure prediction using AlphaFold2_mmseqs2 for AMBRA1WD40 with DDB1, cyclin D1, AURKA or AURKB. Top, cartoon illustration of predicted heteromeric protein complexes. Interchain AlphaFold2 contacts (< 8 Å) are shown as straight lines colored by predicted alignment error (PAE). AMBRA1 residues implicated in DDB1 binding are highlighted in green. Predicted template modeling scores (pTM) are indicated. Bottom, pairwise PAE scores for all protein complexes. B Heat map showing log2 fold changes of label-free quantification values from FLAG affinity purification and mass spectrometry detection in AMBRA-FLAG versus FLAG expressing ATRT cells. Cells were investigated with and without treatment of the CRL inhibitor MLN4924. C Co-immunoprecipitation analyses followed by western blot for selected potential AMBRA1 interactors and substrates. Previously identified interactors and substrates of AMBRA1 (CUL4A, DDB1, and cyclin D1) were included as controls. D Top: Immunoassays of cyclin D1, cyclin D3, AURKA, and AURKB for BT12 and CHLA06 cells, both in wildtype and AMBRA1-knockout conditions. Cells were treated with DMSO, 0.4 μM Baf-A1, or 1 μM MLN4924 for 4 h (cyclin D) or 12 h (aurora kinases). Increase in LC3B-II levels was used as a validation of autophagy inhibition. Bottom: Quantification of protein expression levels relative the corresponding DMSO control conditions. E Left: Immunoassays from His pull-down experiments for BT12 and CHLA266 cells, both in wildtype and AMBRA1-knockout conditions, transfected either with 6xHis-empty or 6xHis-tagged ubiquitin 48 h prior to pull-down. Right: Quantification of AURKA and AURKB ubiquitylation relative to total protein levels. F Model of context-dependent, CRL4AMBRA1-associated blockade of cell cycle regulators via degradation by the ubiquitin-proteasome system. Data are shown as mean ± SD (D, E). Statistics are derived from two-way ANOVA tests with Dunnett’s (D) or Sidak’s correction (E). *P < 0.05, **P < 0.01,***P < 0.001, ****P < 0.0001
Fig. 8
Fig. 8
Inhibition of AURKA is synthetic lethal upon oncogenic loss of AMBRA1. A Dose response analyses for the AURKA inhibitor LY3295668 in AMBRA1 proficient and knockout ATRT cells. B Duration of mitosis in BT12 and CHLA06 cells, both AMBRA1 proficient and knockout cells, treated with 200 nM LY3295668. C Drug synergies as determined by the Bliss model for the combination of the CDK4/6 inhibitor abemaciclib and the AURKA inhibitor LY3295668 in AMBRA1 proficient and knockout ATRT cells. Data are shown as mean ± SD (B, D). Statistics are derived from paired t test (B), and two-way ANOVA test for interaction (E)

References

    1. Ostrom QT, Cioffi G, Gittleman H, Patil N, Waite K, Kruchko C, Barnholtz-Sloan JS. CBTRUS statistical report: primary brain and other central nervous system tumors diagnosed in the United States in 2012–2016. Neuro Oncol. 2019;21:v1–100. - PMC - PubMed
    1. Hilden JM, Meerbaum S, Burger P, Finlay J, Janss A, Scheithauer BW, Walter AW, Rorke LB, Biegel JA. Central nervous system atypical teratoid/rhabdoid tumor: results of therapy in children enrolled in a registry. J Clin Oncol. 2004;22:2877–84. - PubMed
    1. Woehrer A, Slavc I, Waldhoer T, Heinzl H, Zielonke N, Czech T, Benesch M, Hainfellner JA, Haberler C. Austrian Brain Tumor R: Incidence of atypical teratoid/rhabdoid tumors in children: a population-based study by the Austrian Brain Tumor Registry, 1996–2006. Cancer. 2010;116:5725–32. - PubMed
    1. Makuria AT, Rushing EJ, McGrail KM, Hartmann DP, Azumi N, Ozdemirli M. Atypical teratoid rhabdoid tumor (AT/RT) in adults: review of four cases. J Neurooncol. 2008;88:321–30. - PubMed
    1. Biegel JA, Tan L, Zhang F, Wainwright L, Russo P, Rorke LB. Alterations of the hSNF5/INI1 gene in central nervous system atypical teratoid/rhabdoid tumors and renal and extrarenal rhabdoid tumors. Clin Cancer Res. 2002;8:3461–7. - PubMed

MeSH terms

Supplementary concepts