

Modeling functional connectivity changes during an auditory language task using line graph neural networks
- PMID: 39619151
- PMCID: PMC11604466
- DOI: 10.3389/fncom.2024.1471229
Modeling functional connectivity changes during an auditory language task using line graph neural networks
Abstract
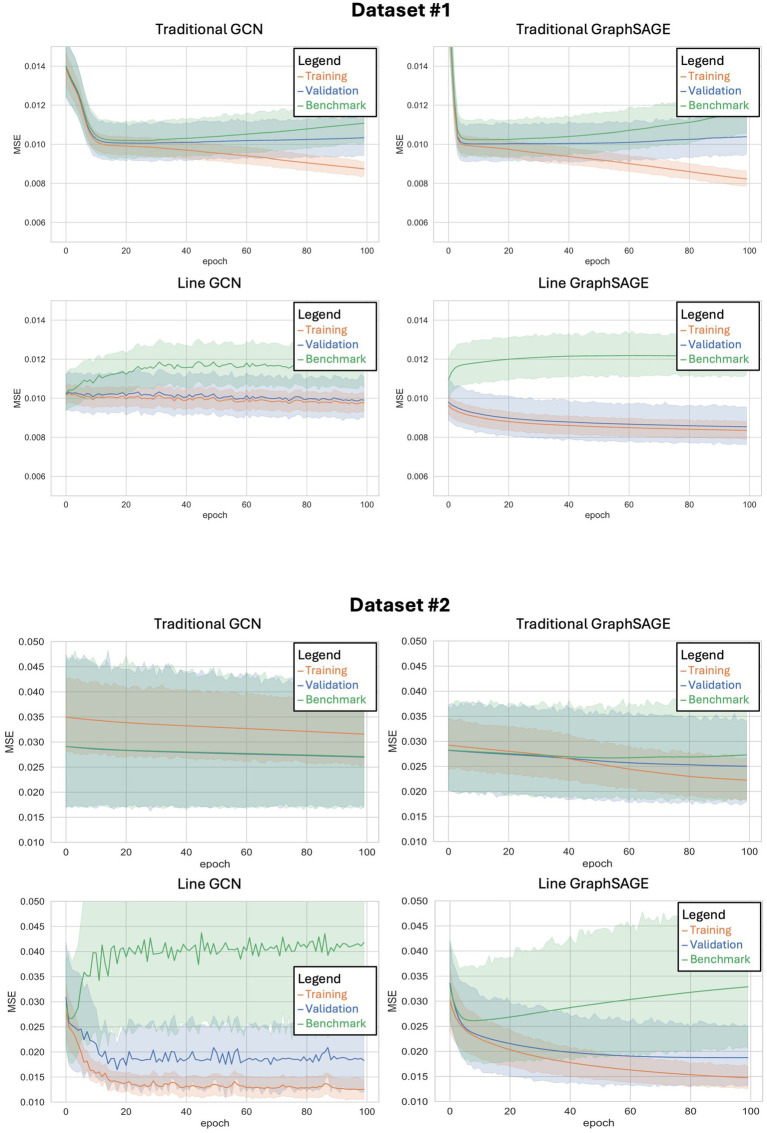
Functional connectivity (FC) refers to the activation correlation between different brain regions. FC networks as typically represented as graphs with brain regions of interest (ROIs) as nodes and functional correlation as edges. Graph neural networks (GNNs) are machine learning architectures used to analyze FC graphs. However, traditional GNNs are limited in their ability to characterize FC edge attributes because they typically emphasize the importance of ROI node-based brain activation data. Line GNNs convert the edges of the original graph to nodes in the transformed graph, thereby emphasizing the FC between brain regions. We hypothesize that line GNNs will outperform traditional GNNs in FC applications. We investigated the performance of two common GNN architectures (GraphSAGE and GCN) trained on line and traditional graphs predicting task-associated FC changes across two datasets. The first dataset was from the Human Connectome Project (HCP) with 205 participants, the second was a dataset with 12 participants. The HCP dataset detailed FC changes in participants during a story-listening task, while the second dataset included the FC changes in a different auditory language task. Our findings from the HCP dataset indicated that line GNNs achieved lower mean squared error compared to traditional GNNs, with the line GraphSAGE model outperforming the traditional GraphSAGE by 18% (p < 0.0001). When applying the same models to the second dataset, both line GNNs also showed statistically significant improvements over their traditional counterparts with little to no overfitting. We believe this shows that line GNN models demonstrate promising utility in FC studies.
Keywords: functional MRI; functional connectivity; graph neural network; graph theory; line graph; machine learning.
Copyright © 2024 Acker, Liang, Sinaii, Wingert, Kurosu, Rajan, Inati, Theodore and Biassou.
Conflict of interest statement
The authors declare that the research was conducted in the absence of any commercial or financial relationships that could be construed as a potential conflict of interest.
Figures

References
LinkOut - more resources
Full Text Sources
Miscellaneous