. 2024 Nov 28;8(12):e70001.
doi: 10.1002/hem3.70001. eCollection 2024 Dec.

Dual specific STAT3/5 degraders effectively block acute myeloid leukemia and natural killer/T cell lymphoma

Affiliations

Dual specific STAT3/5 degraders effectively block acute myeloid leukemia and natural killer/T cell lymphoma

Daniel Pölöske et al. Hemasphere. .

Abstract

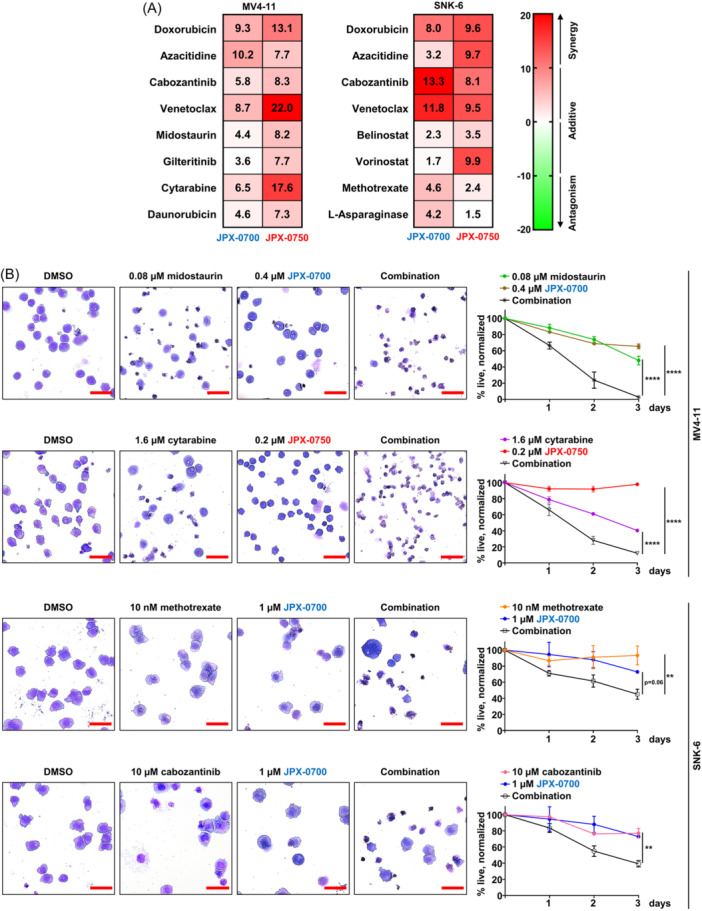
The transcription factors STAT3, STAT5A, and STAT5B steer hematopoiesis and immunity, but their enhanced expression and activation promote acute myeloid leukemia (AML) or natural killer/T cell lymphoma (NKCL). Current therapeutic strategies focus on blocking upstream tyrosine kinases to inhibit STAT3/5, but these kinase blockers are not selective against STAT3/5 activation and frequent resistance causes relapse, emphasizing the need for targeted drugs. We evaluated the efficacy of JPX-0700 and JPX-0750 as dual STAT3/5 binding inhibitors promoting protein degradation. JPX-0700/-0750 decreased the mRNA and protein levels of STAT3/5 targets involved in cancer survival, metabolism, and cell cycle progression, exhibiting nanomolar to low micromolar efficacy. They induced cell death and growth arrest in both AML/NKCL cell lines and primary AML patient blasts. We found that both AML/NKCL cells hijack STAT3/5 signaling through either upstream activating mutations in kinases, activating mutations in STAT3, mutational loss of negative STAT regulators, or genetic gains in anti-apoptotic, pro-proliferative, or epigenetic-modifying STAT3/5 targets. This emphasizes a vicious cycle for proliferation and survival through STAT3/5. Both JPX-0700/-0750 treatment reduced leukemic cell growth in human AML or NKCL xenograft mouse models significantly, being well tolerated by mice. Synergistic cell death was induced upon combinatorial use with approved chemotherapeutics in AML/NKCL cells.


Conflict of interest statement

The authors declare no conflict of interest.

Figures

Figure 1
Figure 1
AML and NKCL cell lines are sensitive toward the STAT3/5 inhibitors JPX‐0700/−0750. (A) Bar graphs show the IC50 values calculated from drug response analysis with JPX‐0700 or JPX‐0750 using CellTiter‐Blue viability assay upon 72 h, or (#) with CellTiter‐Glo assay after 48 h of treatment. The bar graphs represent the mean ± SEM (N = 3). +: FLT3‐ITD+ cell lines. (B) Protein extracts from cell lines derived from either AML, CML, or various subtypes of NKCL and TCL malignancies were immunoblotted for total and phospho‐Tyr (705)‐STAT3 and total and phospho‐Tyr (694/699)‐STAT5A/B. ACTIN served as loading control (N = 2, representative blots are shown). (C) aCGH analysis shows frequent chromosomal mutations of genes involved in STAT3/5 signaling in NKCL, TCL, and AML cell lines. Chromosomal gains are marked in dark gray and losses in light gray. X: gain‐of‐function mutation, †: loss‐of‐function mutation, *: Chr17q gain. aCGH, array comparative genome hybridization; ALCL, anaplastic large cell lymphoma; AML, acute myeloid leukemia; ANKL, aggressive NK cell leukemia; CML, chronic myeloid leukemia; ENKL, extra‐nodal NK/T cell lymphoma, nasal type; NHDF, normal human dermal fibroblasts; NK‐LGL, NK large granular lymphocytic leukemia; PBMC, peripheral blood mononuclear cell.
Figure 2
Figure 2
Small molecule STAT3/5 inhibitors induce cell death and cell cycle arrest in MV4‐11 and SNK‐6 cell lines. (A) MV4‐11‐AML and SNK‐6‐ENKL cells were treated with different concentrations of JPX‐0700, JPX‐0750, or dimethyl sulfoxide (DMSO) in a dose‐dependent manner for 24 h. Apoptotic cells were detected by Annexin‐V/Propidium iodide staining. One representative flow cytometry plot, out of three independent experiments is shown (N = 3). (B) Bar graphs show the frequency distribution of “necrotic,” “late apoptotic,” “early apoptotic,” and “live” cells from (A). The bar graphs represent the mean ± SEM (N = 3). (C) Cell cycle analysis of MV4‐11 and SNK‐6 cells after 24 h treatment with JPX‐0700, JPX‐0750, or DMSO. One representative flow cytometry plot, out of three independent experiments is shown (N = 3). Bar graphs represent the mean ± SEM. Statistical analysis compares the percentages of cells in the different cell cycle phases. *p < 0.05, **p < 0.01, ***p < 0.001, and ****p < 0.0001 by two‐way analysis of variance with Dunnett's multiple comparisons test.
Figure 3
Figure 3
JPX‐0700/−0750 reduces downstream STAT3/5 targets, thereby arresting acute myeloid leukemia and natural killer/T cell lymphoma cell proliferation. (A) MV4‐11 cells were treated for 24 h with 1 µM JPX‐0700 or JPX‐0750 and were subjected to QuantSeq analysis. The volcano plot shows significantly upregulated (dark blue or dark red) or downregulated (light blue or light red) genes (p adj < 0.05, N = 3). Dimethyl sulfoxide (DMSO)‐treated cells were used as control. (B) Gene set enrichment analysis (GSEA) shows up‐ or downregulated pathways after inhibitor treatment. (C) SNK‐6 and NK‐YS cells were treated for 24 h with DMSO or JPX‐0700/−0750 and the mRNA levels of IL2RA, PIM1, CCND2, MYC, and CDC25A were measured with quantitative reverse‐transcription polymerase chain reaction. Statistical analysis shows the mRNA levels of target genes, normalized to respective GAPDH levels and DMSO‐treated cells (N = 3). Bar graphs represent the mean ± SEM. *p < 0.05, **p < 0.01, ***p < 0.001, and ****p < 0.0001 by one‐way ANOVA with Dunnett's multiple comparisons test. (D) Inhibitor treatment was carried out with increased dose escalation for 24 h in MV4‐11 and SNK‐6 cell lines. Cells were immunoblotted for total and phospho‐Tyr (705)‐STAT3 and total and phospho‐Tyr (694/699)‐STAT5A/B. STAT3/5 target gene products c‐MYC and PIM1, as well as proteins regulating the cell cycle, such as CYCLIN D2 and D3, and CDK6, were probed by Western blotting. HSC70 served as loading control. The numbers below the blots represent the mean intensity of protein bands after quantification by densitometry and normalization to DMSO controls (N = 2, representative blots are shown). NES, normalized enrichment score; p adj, adjusted p value.
Figure 4
Figure 4
STAT3/5 inhibitors significantly reduce acute myeloid leukemia (AML) and natural killer/T cell lymphoma (NKCL) tumor growth in xenografted NSGS mice. (A) Summary of AML and NKCL xenograft generation. 1 × 106 MV4‐11 or 3 × 106 SNK‐6 cells were subcutaneously injected into NSGS mice. The SNK‐6 xenograft experiment was conducted twice (N = 2) and the MV4‐11 xenograft once (N = 1). After 8 days (MV4‐11), or approximately 7 weeks (SNK‐6) postinjection, daily intraperitoneal injections of 5 mg/kg JPX‐0700 (14 days, SNK‐6 xenograft) or JPX‐0750 (12 days, MV4‐11 xenograft) were administered to mice. (B) Volumes and weights of SNK‐6 and (C) MV4‐11 xenografted tumors (representative experiments are shown). The graphs show the mean ± SEM. *p < 0.05, **p < 0.01, and ***p < 0.001, by two‐way analysis of variance with Sidak's multiple comparisons test (tumor volumes) or by one‐tailed t‐test (tumor weights). (D) Photographs of SNK‐6 and (E) MV4‐11 xenografted tumors analyzed in (B, C). Individual images were resized and then combined into a single composite image, indicated by the dotted lines. (F) SNK‐6 and (G) MV4‐11 tumors exhibited decreased cell proliferation and viability as shown by reduced staining of Ki‐67 and cleaved Caspase‐3 in immunohistochemistry analysis after treatment with STAT3/5 inhibitors at the endpoint. Black bars are equivalent to 200 µm and red bars to 20 μm (representative pictures from one animal per treatment group are shown). Data represent the mean ± SEM. *p < 0.05, **p < 0.01, and ***p < 0.001 by one‐tailed t‐test.
Figure 5
Figure 5
The STAT3/5 inhibitors exhibit synergy with standard‐of‐care antineoplastic drugs in acute myeloid leukemia/natural killer/T cell lymphoma cell lines. (A) Synergy analysis of the indicated two‐drug combinations in MV4‐11 and SNK‐6 cells after 72 h treatment. The zero interaction potency (ZIP) model was applied to quantify the degree of synergy. The most synergistic area (MSA) was calculated, which represents the most effective 3 × 3 dose window. An MSA score between −10 and 10 indicates that two drugs are additive, while a score above 10 indicates a synergistic effect (N = 3, averages of three biological replicates are shown). (B) MV4‐11 and SNK‐6 cells were subjected to drug treatments, either individually or in combination, for a total duration of 72 h. Cell viability was assessed at 24, 48, and 72 h following treatment. Cytospins were prepared after 72 h from cells and stained with Wright‐Giemsa solution (N = 2, representative cytospins are shown). Red bars represent 20 μm. Graphs represent the mean ± SEM. *p < 0.05, **p < 0.01, ***p < 0.001, and ****p < 0.0001 by two‐way analysis of variance with Dunnett's multiple comparisons test.
Figure 6
Figure 6
STAT3/5 inhibitors inhibit primary AML blast growth and exhibit synergies with standardly used chemotherapeutic drugs. (A) AML patient characteristics, including sex, age, mutations, disease staging, and 48‐hour IC50 values of JPX‐0700 and JPX‐0750 are shown. Healthy bone marrow cells were used as control. (B) Statistical analysis of IC50 values. Data represent the mean ± SEM. *p < 0.05, **p < 0.01, ***p < 0.001, and ****p < 0.001 by one‐tailed t‐test. (C) Synergy analysis of drug combinations with JPX‐0750 in AML blasts after 48 h treatment. Numbers represent the most synergistic area (MSA), calculated with the ZIP model. ASXL1, ASXL Transcriptional Regulator 1; CALR, Calreticulin; CBFB‐MYH11, Core‐Binding Factor Subunit Β‐Myosin Heavy Chain 11‐fusion; CEBPA, CCAAT Enhancer Binding Protein Alpha; DNMT3A, DNA Methyltransferase 3Α; FLT3‐TKD, FLT3 tyrosine kinase domain mutation; FLT3‐ITD, FLT3 internal tandem duplication; GATA2, GATA Binding Protein 2; IDH1/2, Isocitrate Dehydrogenase 1/2; n.d., no data; NPM1, Nucleophosmin 1; RUNX1, RUNX Family Transcription Factor 1; SMC3, Structural Maintenance of Chromosomes 3; TET2, Tet Methylcytosine Dioxygenase 2; U2AF1, U2 Small Nuclear RNA Auxiliary Factor 1; WT1, WT1 Transcription Factor.

References

    1. Gerstung M, Jolly C, Leshchiner I, et al. The evolutionary history of 2,658 cancers. Nature. 2020;578(7793):122‐128. 10.1038/s41586-019-1907-7 - DOI - PMC - PubMed
    1. Erdogan F, Radu TB, Orlova A, et al. JAK‐STAT core cancer pathway: an integrative cancer interactome analysis. J Cell Mol Med. 2022;26(7):2049‐2062. 10.1111/jcmm.17228 - DOI - PMC - PubMed
    1. Orlova A, Wagner C, de Araujo ED, et al. Direct targeting options for STAT3 and STAT5 in cancer. Cancers. 2019;11(12):1930. - PMC - PubMed
    1. Schepers H, van Gosliga D, Wierenga ATJ, Eggen BJL, Schuringa JJ, Vellenga E. STAT5 is required for long‐term maintenance of normal and leukemic human stem/progenitor cells. Blood. 2007;110(8):2880‐2888. 10.1182/blood-2006-08-039073 - DOI - PubMed
    1. Sorger H, Dey S, Vieyra‐Garcia PA, et al. Blocking STAT3/5 through direct or upstream kinase targeting in leukemic cutaneous T‐cell lymphoma. EMBO Mol Med. 2022;14(12):e15200. 10.15252/emmm.202115200 - DOI - PMC - PubMed