. 2024 Nov 12;7(1):288-309.
doi: 10.1039/d4na00738g. eCollection 2024 Dec 17.

Exploring semiconductor potential: novel boron-based Ti3AlC2 and Ti4AlN3 MAX phase composites with tunable band gaps

Affiliations

Exploring semiconductor potential: novel boron-based Ti3AlC2 and Ti4AlN3 MAX phase composites with tunable band gaps

Md Shahinoor Alam et al. Nanoscale Adv. .

Abstract

This research focuses on synthesizing chemically and thermally stable novel in situ Ti4AlN3 and Ti3AlC2 MAX phase reinforced boron-based composites using hot pressed and inert sintering processes, enabling a sizeable and wider bandgap for semiconductor applications. The study found that the MAX phase is formed from 0.2% to 2.9% in fabricated samples with increasing sintering temperatures from 950 °C to 1325 °C. As the sintering temperature increases, the percentage of crystallinity in Ti4AlN3 MAX phase reinforced boron-based composites increases from 69.14% to 89.88%, while in Ti3AlC2 MAX phase reinforced boron-based composites, it increases from 71.02% to 77.86%. And the energy bandgap shows a declining trend from 2.33 eV to 1.78 eV for Ti4AlB2N sample composites and 2.60 eV to 2.40 for Ti4AlB2C sample composites. The UV-vis test for boron-based Ti4AlN3 and Ti3AlC2 MAX phase composites shows an absorbance rate ranging from 0.065 a.u. to 0.63 a.u. and 0.008 to 2.4 a.u. respectively with increasing sintering temperature. Tuning these bandgap variations for Ti4AlN3 and Ti3AlC2 MAX phase reinforced boron-based composites with sintering temperature allows for customization of the material's optical absorption and emission spectra, which is important for semiconductor properties and for electronic and optoelectronic devices.


Conflict of interest statement

The authors declare that this research paper does not have any financial and personal relationships with other people or organizations.

Figures

Fig. 1
Fig. 1. Synthesis process of green samples.
Fig. 2
Fig. 2. Vacuum drying and inert gas sintering process.
Fig. 3
Fig. 3. Schematic flow diagram of the overall synthesis process and experimental.
Fig. 4
Fig. 4. Main graphics analysing the view of XRD patterns of Ti4AlB2N samples sintered at different temperatures: (a) sample sintered at 950 °C, (b) sample sintered at 1050 °C, (c) sample sintered at 1150 °C, (d) sample sintered at 1250 °C and (e) sample sintered at 1325 °C.
Fig. 5
Fig. 5. Main graphics analysing the view of XRD patterns of Ti4AlB2C samples sintered at different temperatures: (a) sample sintered at 950 °C, (b) sample sintered at 1050 °C, (c) sample sintered at 1150 °C, (d) sample sintered at 1250 °C and (e) sample sintered at 1325 °C.
Fig. 6
Fig. 6. X-ray diffraction pattern and crystal structure (P63/mmc) of (a) Ti4AlN3 and (b) Ti3AlC2 MAX phases.
Fig. 7
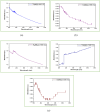
Fig. 7. Relation of % of crystallinity and crystallite size with energy bandgaps of fabricated boron based in situ MAX phase reinforced composites. (a) Ti4AlB2N (in situ Ti4AlN3 MAX phase reinforced composite) and (b) Ti4AlB2C (in situ Ti3AlC2 MAX phase reinforced composites).
Fig. 8
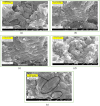
Fig. 8. FESEM images of the Ti4AlB2N composite (a) sample sintered at 950 °C, (b) sample sintered at 1050 °C, (c) sample sintered at 1150 °C, (d) sample sintered at 1250 °C and (e) sample sintered at 1325 °C.
Fig. 9
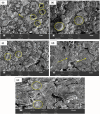
Fig. 9. FESEM images of the Ti3AlB2C composite (a) sample sintered at 950 °C, (b) sample sintered at 1050 °C, (c) sample sintered at 1150 °C, (d) sample sintered at 1250 °C and (e) sample sintered at 1325 °C.
Fig. 10
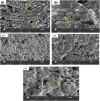
Fig. 10. SEM images of Ti4AlB2N composites at different sintering temperatures: (a) 950 °C, the arrow and circle indicate voids and cracking of the composite surface; (b) 1050 °C, the circle indicates grain boundary development; (c) 1150 °C, the marks indicate the development of grain growth and agglomeration of particles; (d) 1250 °C, the marks show a denser packing structure; and (e) 1325 °C, the corresponding marks indicate a highly dense and well-sintered composite with minimal porosity and large, well-bonded grains with few MAX phase layers.
Fig. 11
Fig. 11. The SEM images of Ti3AlB2C composites at varying sintering temperatures. (a) 950 °C, the corresponding marks indicate voids and loosely bonded particles on the composite surface; (b) 1050 °C, the circle indicates that grain boundaries are developed; (c) 1150 °C, the consistent symbols indicate grain growth and agglomeration of particles; (d) 1250 °C, the arrow shows a denser packing structure growth on the surfaces; and (e) 1325 °C, the corresponding marks specify a highly dense and well-sintered composite with minimal porosity and well-bonded grains with amorphous boron.
Fig. 12
Fig. 12. UV analysis of Ti4AlB2N (absorbance vs. wavelength): (a) sample sintered at 950 °C, (b) sample sintered at 1050 °C, (c) sample sintered at 1150 °C, (d) sample sintered at 1250 °C and (e) sample sintered at 1325 °C.
Fig. 13
Fig. 13. UV analysis of Ti4AlB2C (absorbance vs. wavelength): (a) sample sintered at 950 °C, (b) sample sintered at 1050 °C, (c) sample sintered at 1150 °C, (d) sample sintered at 1250 °C and (e) sample sintered at 1325 °C.
Fig. 14
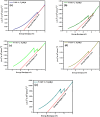
Fig. 14. Tauc plot for energy band gaps of Ti4AlB2N at different sintering temperatures: (a) sample sintered at 950 °C, (b) sample sintered at 1050 °C, (c) sample sintered at 1150 °C, (d) sample sintered at 1250 °C and (e) sample sintered at 1325 °C.
Fig. 15
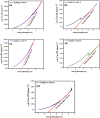
Fig. 15. Tauc plot for energy band gaps of Ti4AlB2C at different sintering temperatures: (a) sample sintered at 950 °C, (b) sample sintered at 1050 °C, (c) sample sintered at 1150 °C, (d) sample sintered at 1250 °C and (e) sample sintered at 1325 °C.

References

    1. Petrus M. Wozniak J. Cygan T. Pawlak W. Olszyna A. Novel alumina matrix composites reinforced with MAX phases – microstructure analysis and mechanical properties. Materials. 2022;15(19):6909. doi: 10.3390/ma15196909. - DOI - PMC - PubMed
    1. Asl M. S. Nayebi B. Akhlaghi M. Ahmadi Z. Tayebifard S. A. Salahi E. et al., A novel ZrB2-based composite manufactured with Ti3AlC2 additive. Ceram. Int. 2021;47(1):817–827.
    1. Tien L. C. and Ho C. H., 4-Synthesis, optical characterization, and environmental applications of β-Ga2O3 nanowires, in Metal Oxides, Gallium Oxide, ed. Pearton S., Ren F. and Mastro M., Elsevier, 2019, pp. 67–90, 10.1016/B978-0-12-814521-0.00004-X - DOI
    1. Yuvaraja S. Khandelwal V. Tang X. Li X. Wide bandgap semiconductor-based integrated circuits. Chip. 2023;2:100072. doi: 10.1016/j.chip.2023.100072. - DOI
    1. Avinashi S. K. Mishra R. K. Singh R. Shweta R. Fatima Z. et al., Fabrication methods, structural, surface morphology and biomedical applications of MXene: a review. ACS Appl. Mater. Interfaces. 2024;16(36):47003–47049. doi: 10.1021/acsami.4c07894. - DOI - PubMed