Review
. 2024 Oct 30;10(22):e39957.
doi: 10.1016/j.heliyon.2024.e39957. eCollection 2024 Nov 30.

JUN and ATF3 in Gout: Ferroptosis-related potential diagnostic biomarkers

Affiliations
Review

JUN and ATF3 in Gout: Ferroptosis-related potential diagnostic biomarkers

Yang Li et al. Heliyon. .

Abstract

Objective: Gout is a prevalent form of chronic inflammatory arthritis, and its etiology remains incompletely understood. Ferroptosis is a form of cell death that relies on iron. As of now, the relationship between ferroptosis and gout is not entirely clear. Hence, the primary objective of this study is to employ bioinformatics methods for the analysis and identification of potential genes associated with ferroptosis in the context of gout.

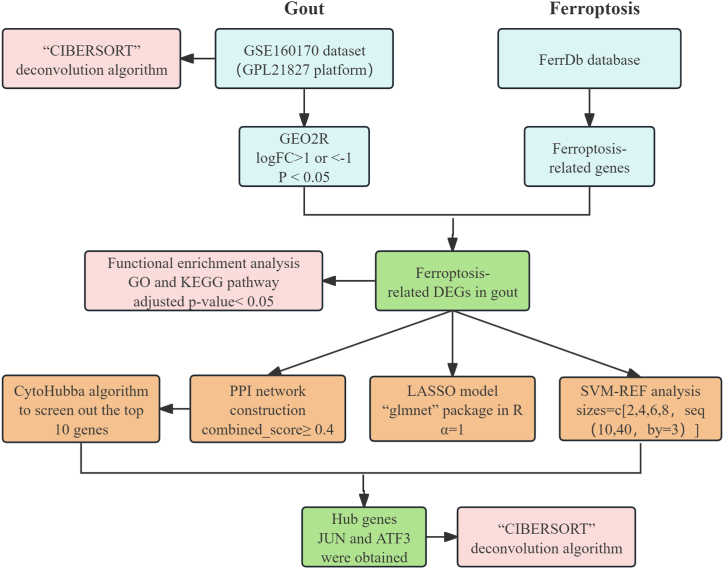
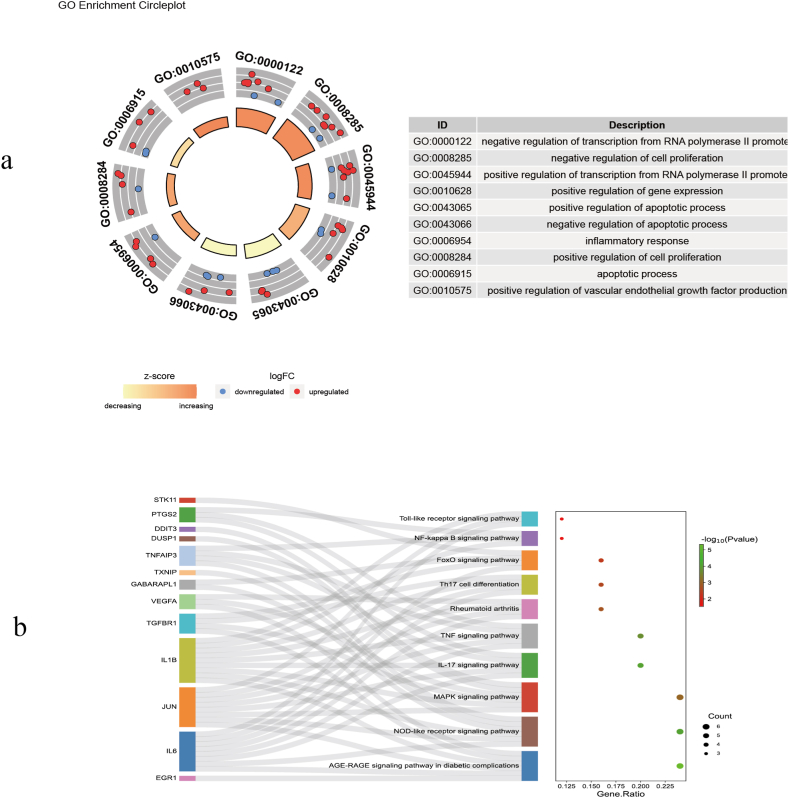
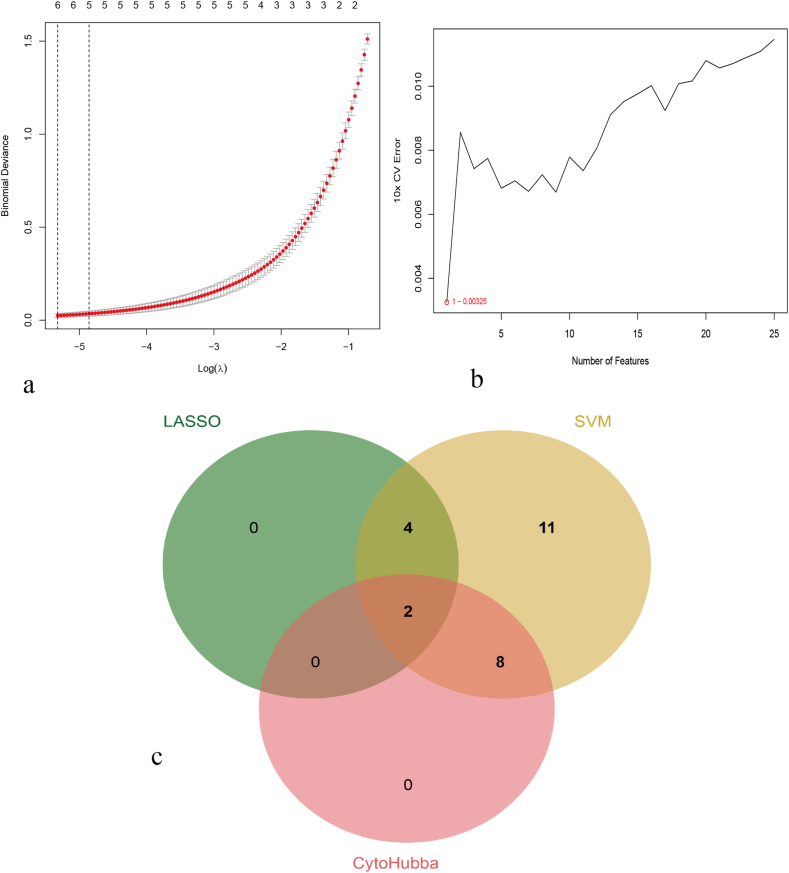
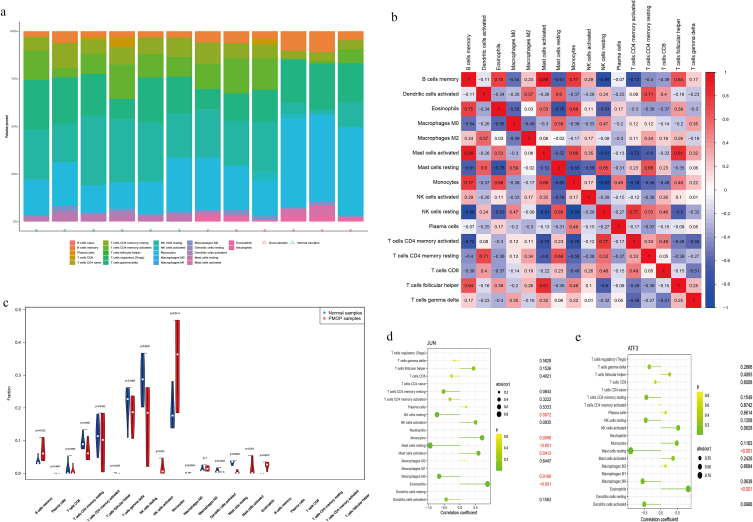
Methods: Utilizing both bioinformatics analysis and machine learning algorithms to systematically identify biomarkers for gout. The gout-related dataset (GSE160170) was acquired from the Gene Expression Omnibus (GEO) database. Ferroptosis-related genes were extracted from the FerrDb database. subsequently, we identified DEGs associated with ferroptosis in the context of gout. Following that, we performed Gene Ontology (GO) and Kyoto Encyclopedia of Genes and Genomes (KEGG) pathway enrichment analyses on the DEGs. Subsequently, SVM-RFE analysis and the LASSO regression model were employed for biomarker screening. Additionally, CIBERSORT software was utilized to assess the composition of twenty-two immune cells in gout, and correlation analyses between hub genes and immune cells were conducted.

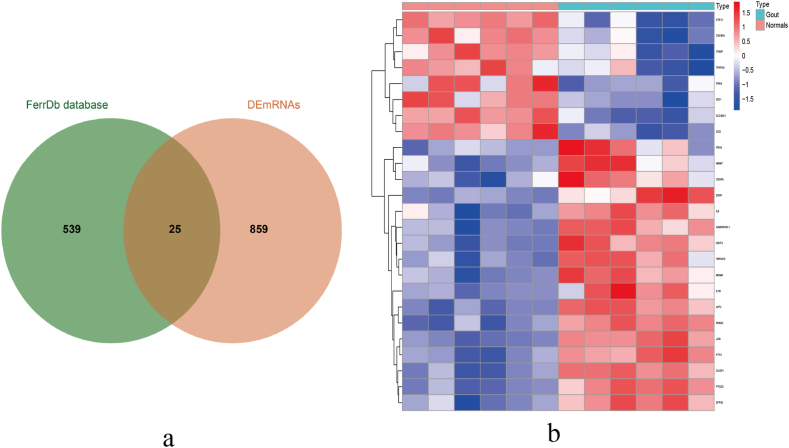
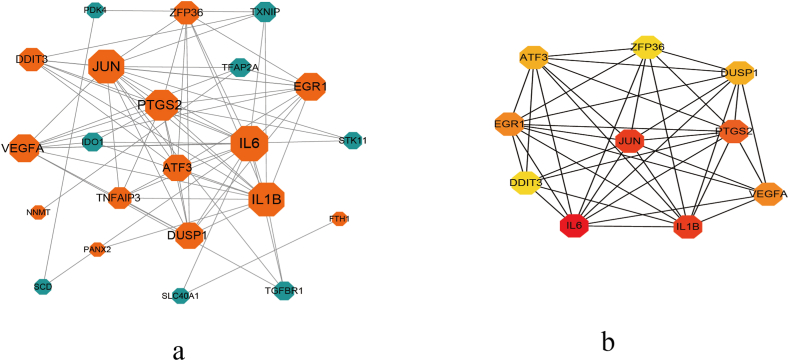
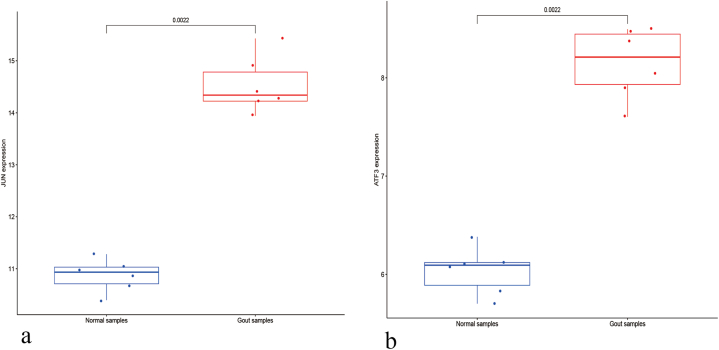
Results: This study screened a total of twenty-five DEGs related to Ferroptosis in healthy population and gout patient. The KEGG analysis indicates that these DEGs are predominantly enriched in: the AGE-RAGE signaling pathway, nod like receptor signaling pathway, MAPK signaling pathway, IL-17 signaling pathway, etc. The intersection of the top 10 genes identified through PPI network, SVM-RFE analysis, and LASSO regression model resulted in two hub genes, namely JUN and ATF3. Analysis of immunocyte infiltration revealed that JUN exhibited associations with various immune cells, including NK cells resting, Monocytes, Mast cells resting, etc. ATF3, on the other hand, showed associations with immune cells Mast cells resting and Eosinophels.

Conclusions: The outcomes of our study pinpointed JUN and ATF3, genes associated with ferroptosis, as promising biomarkers for both diagnosing and treating gout, providing additional evidence to support the important role of ferroptosis in gout and providing potential therapeutic methods for clinical targeted ferroptosis prevention and treatment of gout.

Keywords: Bioinformatics; Biomarkers; Ferroptosis; Gout; Machine learning.


Conflict of interest statement

The authors declare that there is no conflict of interest regarding the publication of this paper.

Figures

Fig. 1
Fig. 1
The detailed workflow of the analysis process.
Fig. 2
Fig. 2
DEGs in Gout. a. The acquisition of 25 DEGs related to ferroptosis in gout. The green section represents the FerrDb database. The red part represents the differential genes in the GSE160170 dataset. The middle part represents 25 DEGs related to ferroptosis in gout. b. Heat map of 25 ferroptosis-related DEGs in gout. (For interpretation of the references to colour in this figure legend, the reader is referred to the Web version of this article.)
Fig. 3
Fig. 3
Enrichment Analysis. a. The circle diagram shows that the first 10 biological processes of 25 ferroptosis-related DEGs in gout. b. The Sankey plot showing the relationship between DEGs enriched on significant KEGG pathways.
Fig. 4
Fig. 4
PPI network. a. The PPI network was comprised of 22 nodes and 71 edges. Each node represents a protein, while each edge represents one protein–protein association. The larger the degree value, the larger the shape size. Red represents an increase, while green represents a decrease. b. The top 10 genes with the highest Degree value. (For interpretation of the references to colour in this figure legend, the reader is referred to the Web version of this article.)
Fig. 5
Fig. 5
Determination of Diagnosis Markers. a. LASSO algorithm for screening potential biomarkers. b. SVM-RFE algorithm for screening potential biomarkers. c. Venn diagram of three diagnostic biomarker shared by LASSO algorithm, SVM-RFE algorithm, and PPI network interaction.
Fig. 6
Fig. 6
The expression of JUN and ATF3 in gout. a. The expression of JUN is significantly up-regulated in gout samples b. The expression of ATF3 is significantly up-regulated in gout samples.
Fig. 7
Fig. 7
Immunocyte infiltration between healthy and gout samples and its correlation with JUN and ATF3. a and b. The composition of 22 immune cells identified by the CIBERSORT algorithm. c. the differences in immune cell structure between healthy and gout samples d. the correlation between JUN and immune cell infiltration in healthy and gout samples. e. the correlation between ATF3 and immune cell infiltration in healthy and gout samples.

Similar articles

Cited by

References

    1. Dalbeth N., Gosling A.L., Gaffo A., Abhishek A. Gout. Lancet. 2021;397(10287):1843–1855. doi: 10.1016/S0140-6736(21)00569-9. - DOI - PubMed
    1. Dehlin M., Jacobsson L., Roddy E. Global epidemiology of gout: prevalence, incidence, treatment patterns and risk factors. Nat. Rev. Rheumatol. 2020;16(7):380–390. doi: 10.1038/s41584-020-0441-1. - DOI - PubMed
    1. Li Y., Han X., Tong J., et al. Analysis of metabolites in gout: a systematic review and meta-analysis. Nutrients. 2023;15(14) doi: 10.3390/nu15143143. - DOI - PMC - PubMed
    1. T.J. Major, R.K. Topless, N. Dalbeth, T.R. Merriman, Evaluation of the diet wide contribution to serum urate levels: meta-analysis of population based cohorts, BMJ. 3632018) k3951, 10.1136/bmj.k3951. - DOI - PMC - PubMed
    1. J. Zhao, K. Wei, P. Jiang, et al., Inflammatory response to regulated cell death in gout and its functional implications, Front. Immunol. 132022) 888306, 10.3389/fimmu.2022.888306. - DOI - PMC - PubMed

LinkOut - more resources