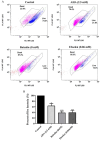
The effect of three urease inhibitors on H. pylori viability, urease activity and urease gene expression
- PMID: 39619692
- PMCID: PMC11604635
- DOI: 10.3389/fmicb.2024.1464484
The effect of three urease inhibitors on H. pylori viability, urease activity and urease gene expression
Abstract
Background: Treatment of Helicobacter pylori (H. pylori) infections is challenged by antibiotic resistance. The urease enzyme contributes to H. pylori colonization in the gastric acidic environment by producing a neutral microenvironment. We hypothesized that urease inhibition could affect H. pylori viability. This work aimed to assess the effects of acetohydroxamic acid (AHA), ebselen and baicalin on urease activity, bacterial viability and urease genes expression in H. pylori isolates.
Methods: Forty-nine H. pylori clinical isolates were collected. Urease activity was assessed using the phenol red method. The urease inhibition assay assessed inhibitors' effects on urease activity. Flow cytometry assessed the effect of inhibitors on bacterial viability. Real time PCR was used to compare urease genes expression levels following urease inhibition.
Results: Urease activity levels differed between isolates. Acetohydroxamic acid inhibited urease activity at a concentration of 2.5 mM. Although baicalin inhibited urease activity at lower concentrations, major effects were seen at 8 mM. Ebselen's major inhibition was demonstrated at 0.06 mM. Baicalin (8 mM) significantly reduced ATP production compared to untreated isolates. Baicalin, ebselen and acetohydroxamic acid significantly reduced H. pylori viability. Increased urease genes expression was detected after exposure to all urease inhibitors.
Discussion: In conclusion, higher concentrations of baicalin were needed to inhibit urease activity, compared to acetohydroxamic acid and ebselen. Baicalin, ebselen and acetohydroxamic acid reduced H. pylori viability. Therefore, these inhibitors should be further investigated as alternative treatments for H. pylori infection.
Keywords: Helicobacter pylori; bacterial viability; urease activity; urease genes; urease inhibitors.
Copyright © 2024 Shaalan, Azrad and Peretz.
Conflict of interest statement
The authors declare that the research was conducted in the absence of any commercial or financial relationships that could be construed as a potential conflict of interest.
Figures


Similar articles
-
Biological evaluation and molecular docking of baicalin and scutellarin as Helicobacter pylori urease inhibitors.J Ethnopharmacol. 2015 Mar 13;162:69-78. doi: 10.1016/j.jep.2014.12.041. Epub 2014 Dec 31. J Ethnopharmacol. 2015. PMID: 25557028
-
Marked reduction of Helicobacter pylori-induced gastritis by urease inhibitors, acetohydroxamic acid and flurofamide, in Mongolian gerbils.Biochem Biophys Res Commun. 2001 Jul 20;285(3):728-33. doi: 10.1006/bbrc.2001.5229. Biochem Biophys Res Commun. 2001. PMID: 11453654
-
High-throughput tandem-microwell assay for ammonia repositions FDA-Approved drugs to inhibit Helicobacter pylori urease.FASEB J. 2021 Nov;35(11):e21967. doi: 10.1096/fj.202100465RR. FASEB J. 2021. PMID: 34613630
-
Insights into the Design of Inhibitors of the Urease Enzyme - A Major Target for the Treatment of Helicobacter pylori Infections.Curr Med Chem. 2020;27(23):3967-3982. doi: 10.2174/0929867326666190301143549. Curr Med Chem. 2020. PMID: 30827224 Review.
-
Helicobacter pylori urease for diagnosis of Helicobacter pylori infection: A mini review.J Adv Res. 2018 Jan 31;13:51-57. doi: 10.1016/j.jare.2018.01.006. eCollection 2018 Sep. J Adv Res. 2018. PMID: 30094082 Free PMC article. Review.
Cited by
-
Environmental yeasts differentially impact the development and oviposition behavior of the Asian tiger mosquito Aedes albopictus.Microbiome. 2025 Apr 16;13(1):99. doi: 10.1186/s40168-025-02099-6. Microbiome. 2025. PMID: 40241175 Free PMC article.
-
Anti-urease therapy: a targeted approach to mitigating antibiotic resistance in Helicobacter pylori while preserving the gut microflora.Gut Pathog. 2025 May 28;17(1):37. doi: 10.1186/s13099-025-00708-1. Gut Pathog. 2025. PMID: 40437630 Free PMC article. Review.
-
Targeting Urease: A Promising Adjuvant Strategy for Effective Eradication.ACS Omega. 2025 Jul 4;10(27):28643-28669. doi: 10.1021/acsomega.5c02725. eCollection 2025 Jul 15. ACS Omega. 2025. PMID: 40687008 Free PMC article. Review.
References
LinkOut - more resources
Full Text Sources

