. 2024 Nov 15:15:1438004.
doi: 10.3389/fimmu.2024.1438004. eCollection 2024.

Single cell RNA-sequencing of feline peripheral immune cells with V(D)J repertoire and cross species analysis of T lymphocytes

Affiliations

Single cell RNA-sequencing of feline peripheral immune cells with V(D)J repertoire and cross species analysis of T lymphocytes

Raneesh Ramarapu et al. Front Immunol. .

Abstract

Introduction: The domestic cat (Felis catus) is a valued companion animal and a model for virally induced cancers and immunodeficiencies. However, species-specific limitations such as a scarcity of immune cell markers constrain our ability to resolve immune cell subsets at sufficient detail. The goal of this study was to characterize circulating feline T cells and other leukocytes based on their transcriptomic landscape and T-cell receptor repertoire using single cell RNA-sequencing.

Methods: Peripheral blood from 4 healthy cats was enriched for T cells by flow cytometry cell sorting using a mouse anti-feline CD5 monoclonal antibody. Libraries for whole transcriptome, αβ T cell receptor transcripts and γδ T cell receptor transcripts were constructed using the 10x Genomics Chromium Next GEM Single Cell 5' reagent kit and the Chromium Single Cell V(D)J Enrichment Kit with custom reverse primers for the feline orthologs.

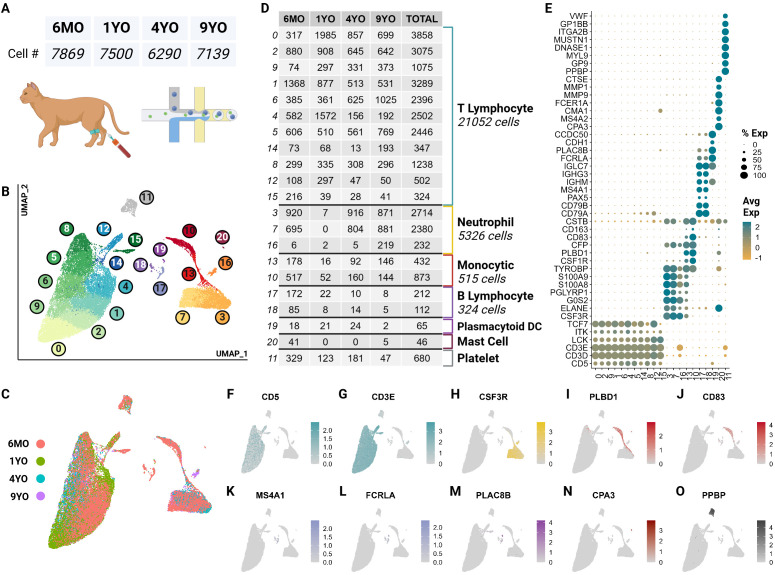
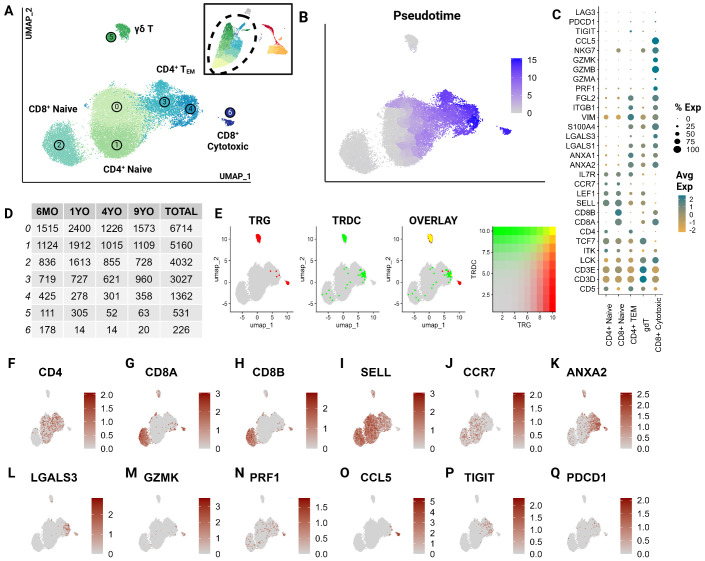
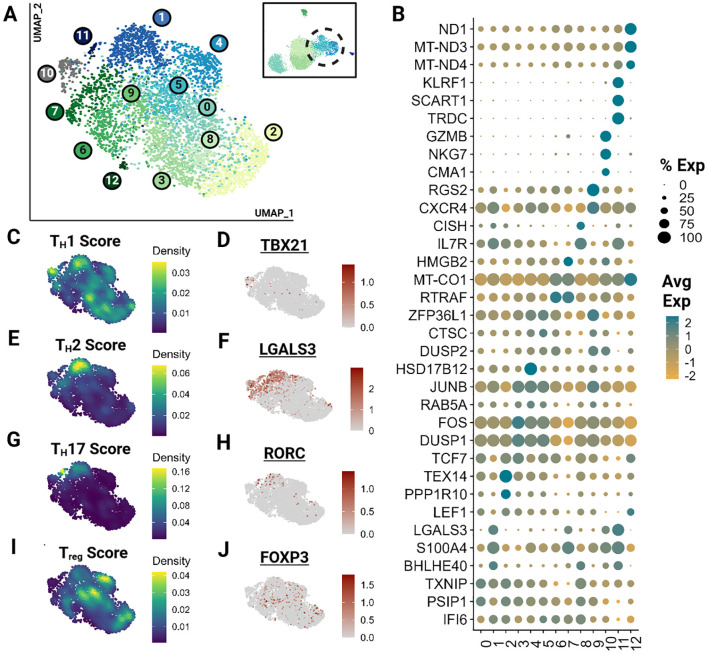
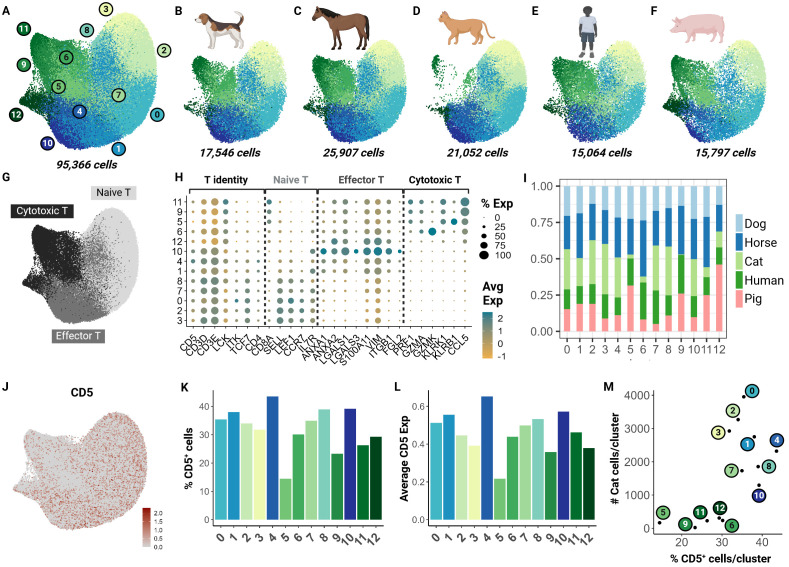
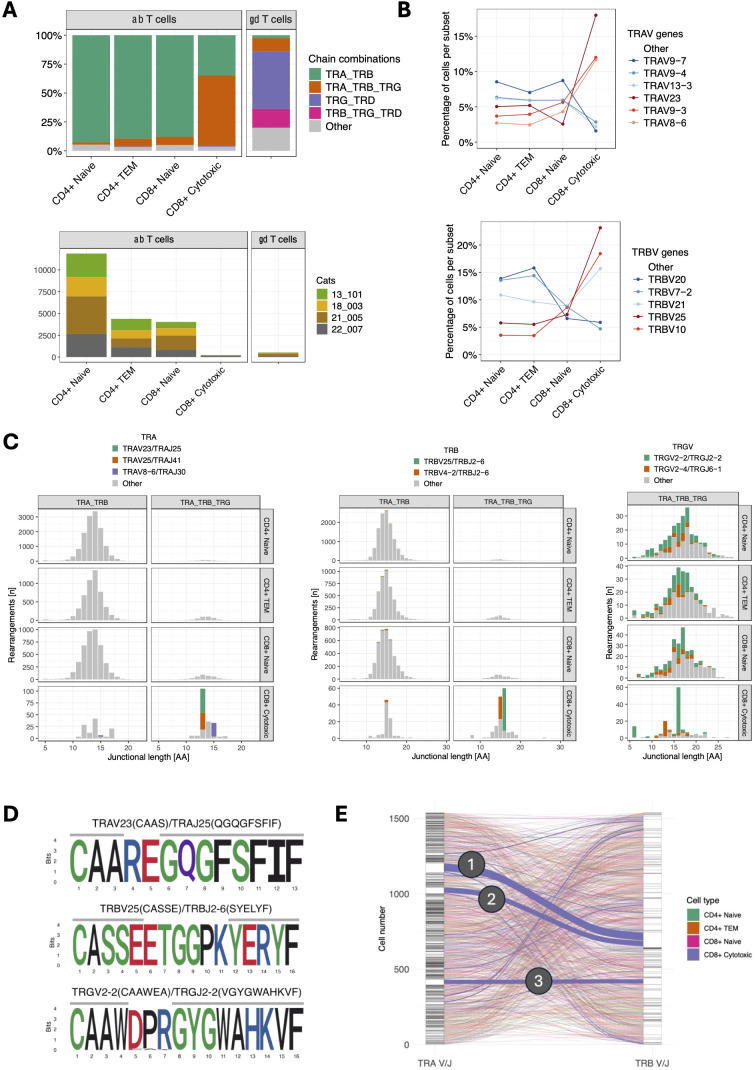
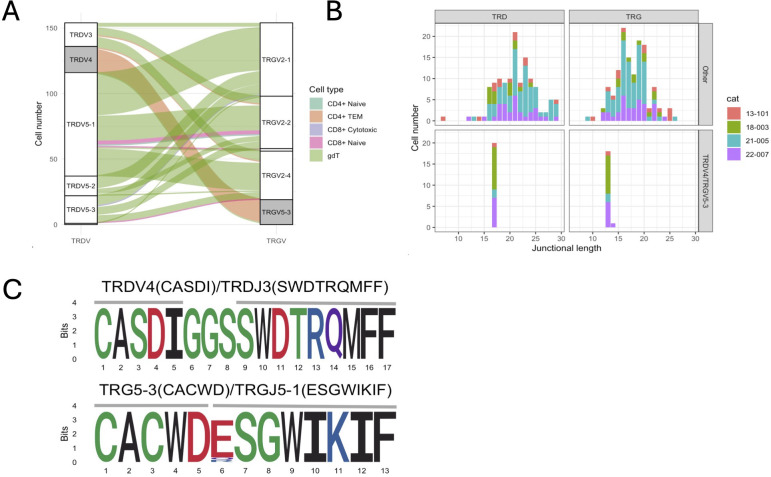
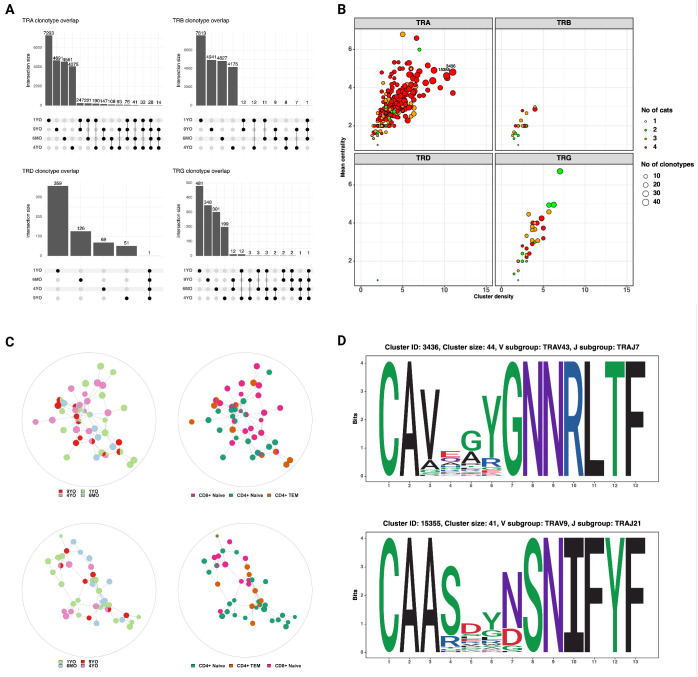
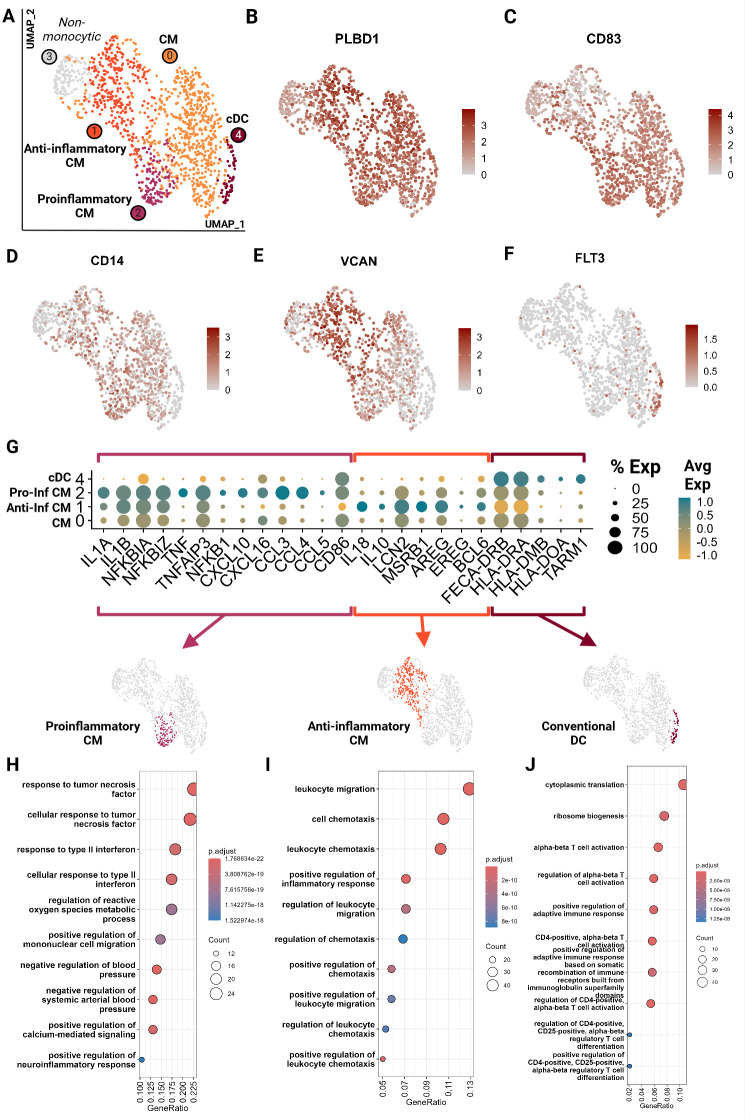
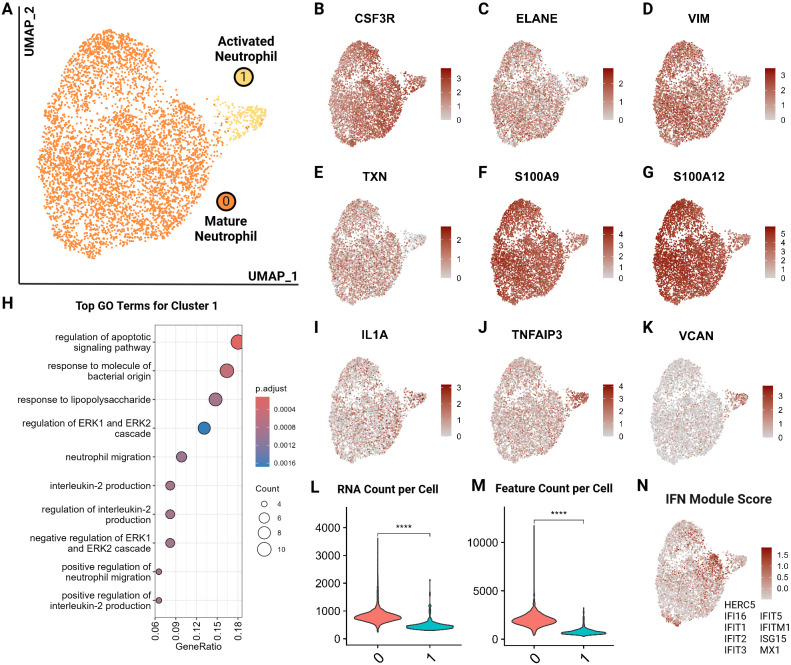
Results: Unsupervised clustering of whole transcriptome data revealed 7 major cell populations - T cells, neutrophils, monocytic cells, B cells, plasmacytoid dendritic cells, mast cells and platelets. Sub cluster analysis of T cells resolved naive (CD4+ and CD8+), CD4+ effector T cells, CD8+ cytotoxic T cells and γδ T cells. Cross species analysis revealed a high conservation of T cell subsets along an effector gradient with equitable representation of veterinary species (horse, dog, pig) and humans with the cat. Our V(D)J repertoire analysis identified a subset of CD8+ cytotoxic T cells with skewed TRA and TRB gene usage, conserved TRA and TRB junctional motifs, restricted TRA/TRB pairing and reduced diversity in TRG junctional length. We also identified a public γδ T cell subset with invariant TRD and TRG chains and a CD4+ TEM-like phenotype. Among monocytic cells, we resolved three clusters of classical monocytes with polarization into pro- and anti-inflammatory phenotypes in addition to a cluster of conventional dendritic cells. Lastly, our neutrophil sub clustering revealed a larger mature neutrophil cluster and a smaller exhausted/activated cluster.

Discussion: Our study is the first to characterize subsets of circulating T cells utilizing an integrative approach of single cell RNA-sequencing, V(D)J repertoire analysis and cross species analysis. In addition, we characterize the transcriptome of several myeloid cell subsets and demonstrate immune cell relatedness across different species.

Keywords: T cells; T-cell receptor repertoire; V(D)J; cross species analysis; feline; myeloid Cells; single cell RNA-sequencing (scRNA-seq).


Conflict of interest statement

The authors declare that the research was conducted in the absence of any commercial or financial relationships that could be construed as a potential conflict of interest.

Figures

Figure 1
Figure 1
scRNA-seq atlas of CD5+ enriched circulating feline immune cells revealed 7 major types across 21 clusters. (A) Table of cell counts from each age group. (B) UMAP plot demonstrating the unsupervised clustering results for feline circulating immune cells from 4 healthy cats of different age groups. (C) UMAP plot of global clustering colored by age. (D) Table of cell type counts across clusters by age. (E) Dot plot demonstrating cell type specific marker expression of the 7 major cell types. (F–O) Feature UMAP plots demonstrating expression profile of key markers for each of the 7 different cell types.
Figure 2
Figure 2
CD5+ enriched T cells segregate into naïve T cell subtypes and effectors. Unsupervised clustering of T cells reveals 7 subtypes. (A) UMAP of the scRNA-seq atlas of T cells. (B) UMAP of T cells colored by Pseudotime. (C) Dot plot of marker genes expressed by T cell type. (D) Table of cell type frequencies across ages by cluster. (E) Feature plots of expression and co-expression of TRG and TRDC. (F–Q) UMAP of T cells colored by classical T marker genes defining CD4/CD8 status, naive (SELL, CCR7), effectorness (ANXA2, LGALS3, GZMK, PRF1), terminal differentiation (CCL5) and T exhaustion (TIGIT, PDCD1).
Figure 3
Figure 3
Feline Effector T cells (TEM) segregate into transcriptionally similar clusters and reveal the presence of helper T phenotypes. Unsupervised clustering of TEM reveals 13 subtypes. (A) UMAP of scRNA-seq atlas of TEM. (B) Dot plot demonstrating up to 3 top differentially expressed genes for each cluster determined via Wilcoxon rank sum testing (Adj P <0.05). (C, E, G, I) UMAP of TEM colored by helper T subtype gene modules. (D, F, H, J) Expression UMAP of a representative gene from each helper T gene module presented in parallel.
Figure 4
Figure 4
Cross-species integrative analysis of T cells reveals missing cytotoxic effectors in the cat. Unsupervised clustering revealed 12 clusters across 5 species. (A) UMAP of scRNA-seq atlas of T cells. (B–F) UMAP split by species- dog, horse, cat, human and pig. (G) UMAP of T cells colored by T cell phenotype. (H) Dot plot of marker gene sets for T cell subtypes. (I) Percentage bar chart of clusters stacked by species. (J) UMAP colored by CD5 expression. (K) Bar chart of percentage CD5+ cells per cluster. (L) Bar chart of average CD5 expression across cells in each cluster. (M) Scatter plot of percentage CD5+ cells per cluster versus number of cat cells within the corresponding cluster.
Figure 5
Figure 5
(A) TCR chain expression of T cell subsets (top). TRA/TRB transcripts dominate in all αβ T cell subsets except for CD8+ cytotoxic T cells, which primarily express TRA/TRB/TRG transcripts. Of note, CD8+ cytotoxic T cells were markedly less abundant than other αβ subsets (bottom) and were almost exclusively found in a single cat (22-007). (B) TRAV (top) and TRBV (bottom) gene usage of αβ T cell subsets. CD8+ cytotoxic T cells show differential gene usage compared to other αβ T cell subsets. The most abundant V genes are highlighted in either red (CD8+ cytotoxic) or blue (other αβ T cell subsets). (C) Junctional length and V/J usage of ab T cell subsets stratified by TRA/TRB vs. TRA/TRB/TRG expression. CD8+ cytotoxic T cells with TRA/TRB/TRG transcripts use distinct TRA and TRB but not TRG V/J gene combinations. TRG transcripts in this group are characterized by a limited junctional diversity. The most abundant V/J gene combinations in CD8+ cytotoxic T cells have been highlighted. (D) Position weight matrix of the most common TRA (top), TRB (middle) and TRG (bottom) junctional motifs in CD8+ cytotoxic T cells with TRA/TRB/TRG expression. (E) Combinatorial diversity of TRA and TRB chains in αβ T cells with TRA/TRB/TRG expression. Each stratum in the left and right axes represent a unique TRA V/J and TRB V/J combination, respectively. The connections between the left (TRA) and right (TRB) strata represent the pairing of specific TRA and TRB combinations. Compared to other subsets, CD8+ cytotoxic T cells (blue lines) have more frequent pairings between specific TRA and TRB combinations, suggesting that CD8+ cytotoxic T cells exhibit more focused TRA/TRB pairing patterns and lower combinatorial diversity. The three dominant pairings are: (1) TRAV23/TRAJ25 TRBV25/TRBJ2-6 (51 cells), (2) TRAV25/TRAJ41 TRBV25/TRBJ2-6 (35 cells), and (3) TRAV8-6/TRAJ30 TRBV4-2/TRBJ2-6 (27 cells).
Figure 6
Figure 6
Characterization of γδ T cells with one TRG & TRD rearrangement each. (A) Correlation of TRG/TRD V gene pairing and functional phenotype. Three TRD V genes (TRDV3, TRDV5-1, TRDV5-2, TRDV5-3) pair with three TRG V genes (TRGV2-1, TRGV2-2, TRGV2-4) in an all-vs-all fashion (white strata) while TRDV4 genes exclusively pair with TRDV5-3 genes (grey strata). Cells with TRDV4/TRDV5-3 gene usage have a CD4+ TEM phenotype (orange alluvium), while other cells have a predominant γδ phenotype (green alluvium). (B) Junctional diversity of γδ T cell subsets. TRDV4/TRDV5-3 γδ T cells have a highly skewed TRD & TRG junctional length and are found in all 4 cats. (C) Junctional sequence diversity of the TRD (top) & TRG (bottom) rearrangements. All TRDV4/TRDJ3 rearrangements and 16/19 TRG5-3/TRGJ5-1 rearrangements share the same junctional sequence, respectively. The three divergent TRG sequences were highly similar and either had a single amino acid variation in position 6 (2/3) or contained one additional histidine between positions 5 and 6 (CACWDHESGWIKIF, not shown).
Figure 7
Figure 7
(A) Shared clonotypes across 4 cats. The TRA locus exhibits the highest degree of publicity. The TRD and TRG clonotypes that are shared by all four cats are ‘CASDIGGSSWDTRQMFF’ and ‘CACWDESGWIKIF‘, respectively (see also Figure 6C) (B) Characterization of clusters based on mean centrality and cluster density. Higher values reflect larger and more connected clusters. (C) Network plots of TRA clusters with high centrality and density. Each node represents a unique clonotype, all clonotypes have identical junctional lengths and edges connect clonotypes with one amino acid sequence difference in the junctional region. The clusters contain clonotypes from all four cats and different T cell subsets. (D) Position weight matrices of TRA junctional regions of two representative clusters with high centrality and density (identified in Figure 7B).
Figure 8
Figure 8
Feline circulating monocytes include classical monocytes with more differentiated clusters with traditional proinflammatory and unconventional anti-inflammatory phenotypes. Unsupervised clustering revealed 5 clusters. (A) UMAP of scRNA-seq atlas of monocytes. (B–F) UMAP of monocytes colored by expression levels of canonical markers. (G) Dot plot of genes of monocytic phenotypes across the 4 monocytic clusters. (H–J) Dot plots of top GO biological process terms called based on sets of positive differentially expressed genes identified via Seurat FindMarker function (Wilcoxon rank sum, Adj P <0.05). CM, Classical monocyte; cDC, Conventional dendritic cell; Pro-inf, proinflammatory; Anti-inf, anti-inflammatory..
Figure 9
Figure 9
Feline circulating neutrophils separate into 2 clusters based on activation state. (A) UMAP of scRNA-seq atlas of neutrophils. (B–G) UMAP of neutrophils colored by expression levels of canonical and functional neutrophil markers. (H) Dot plots of top GO biological process terms in cluster 1 called based on sets of positive differentially expressed genes identified via Seurat FindMarker function (Wilcoxon rank sum, Adj P <0.05). (I–K) UMAP of neutrophils colored by expression levels of select differentially upregulated genes in cluster 1. (L, M) Violin plots of RNA counts and feature (unique RNA) counts per cell by cluster; (****) indicates P value less than 0.001 by T-test. (N) UMAP of neutrophils colored by interferon (IFN) gene composite score per cell; genes included are named in figure.

Update of

Similar articles

Cited by

References

    1. Rowan AN. Companion Animal Statistics in the USA. (2018). Available online at: https://www.wellbeingintlstudiesrepository.org/demscapop/7/. (Accessed February 20, 2024).
    1. Larkin M, Radich R, AVMA. Am Vet Med Assoc . Pet population still on the rise, with fewer pets per household (2021). Available online at: https://avmajournals.avma.org/display/post/news/pet-population-still-on-.... (Accessed February 20, 2024).
    1. Fromont E, Artois M, Langlais M, Courchamp F, Pontier D. Modelling the feline leukemia virus (FeLV) in natural populations of cats (Felis catus). Theor Popul Biol. (1997) 52:60–70. doi: 10.1006/tpbi.1997.1320 - DOI - PubMed
    1. Powers JA, Chiu ES, Kraberger SJ, Roelke-Parker M, Lowery I, Erbeck K, et al. . Feline leukemia virus (FeLV) disease outcomes in a domestic cat breeding colony: relationship to endogenous feLV and other chronic viral infections. J Virol. (2018) 92. doi: 10.1128/JVI.00649-18 - DOI - PMC - PubMed
    1. Helfer-Hungerbuehler AK, Shah J, Meili T, Boenzli E, Li P, Hofmann-Lehmann R. Adeno-associated vector-delivered CRISPR/saCas9 system reduces feline leukemia virus production in vitro . Viruses. (2021) 13. doi: 10.3390/v13081636 - DOI - PMC - PubMed

Substances