. 2024 Dec;15(1):2431239.
doi: 10.1080/19491034.2024.2431239. Epub 2024 Dec 2.

Locus-specific differential expression of human satellite sequences in the nuclei of cancer cells and heat-shocked cells

Affiliations

Locus-specific differential expression of human satellite sequences in the nuclei of cancer cells and heat-shocked cells

Christina Rabeler et al. Nucleus. 2024 Dec.

Erratum in

  • Correction.
    [No authors listed] [No authors listed] Nucleus. 2025 Dec;16(1):2443274. doi: 10.1080/19491034.2024.2443274. Epub 2025 Jan 21. Nucleus. 2025. PMID: 39835659 No abstract available.

Abstract

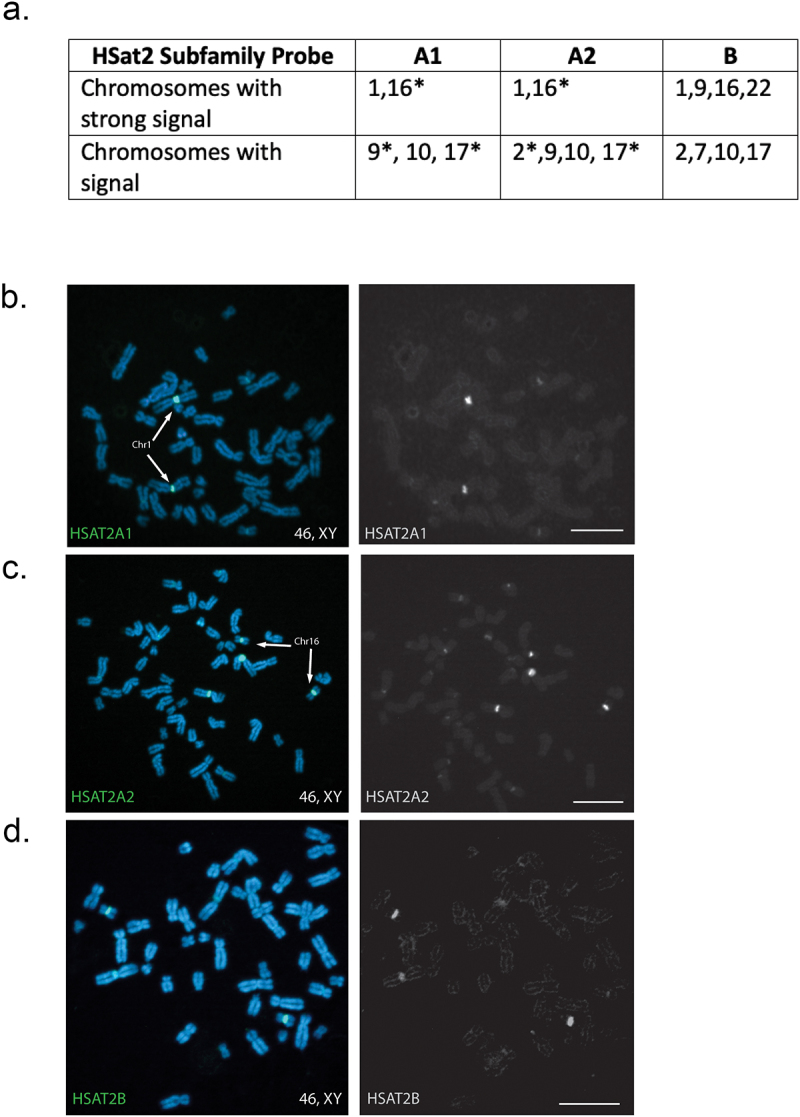
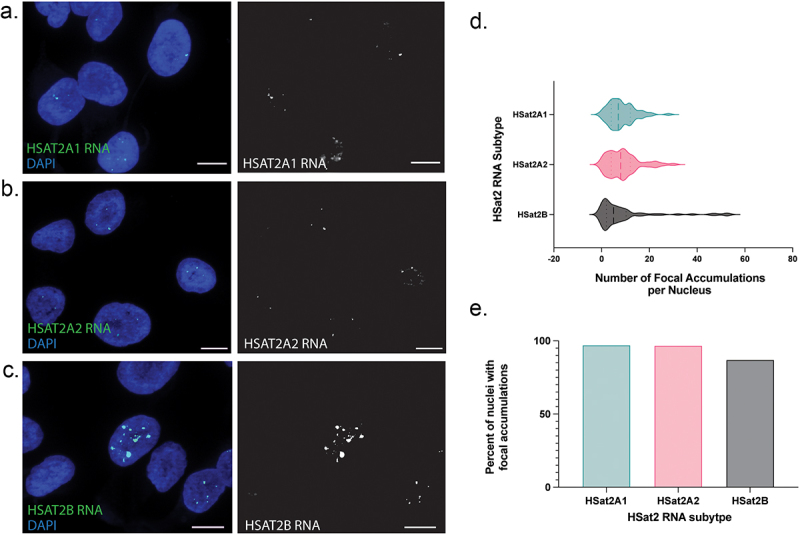
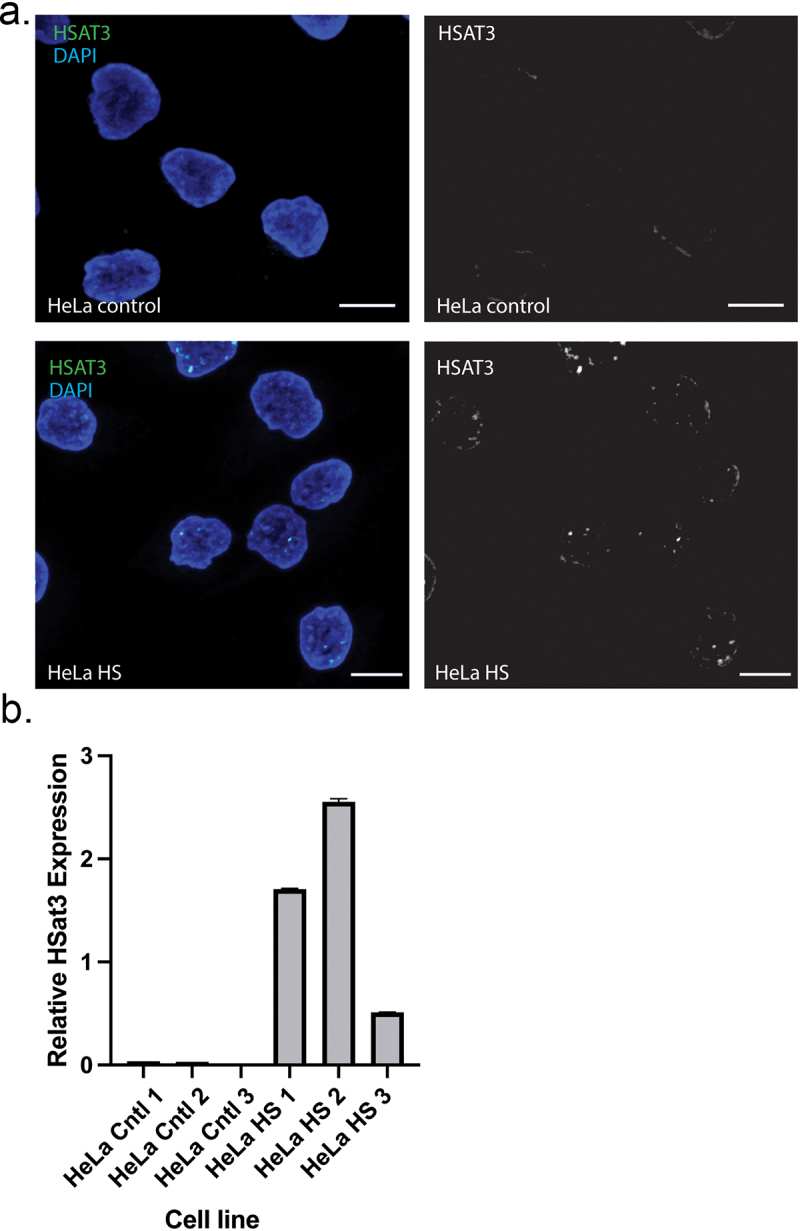
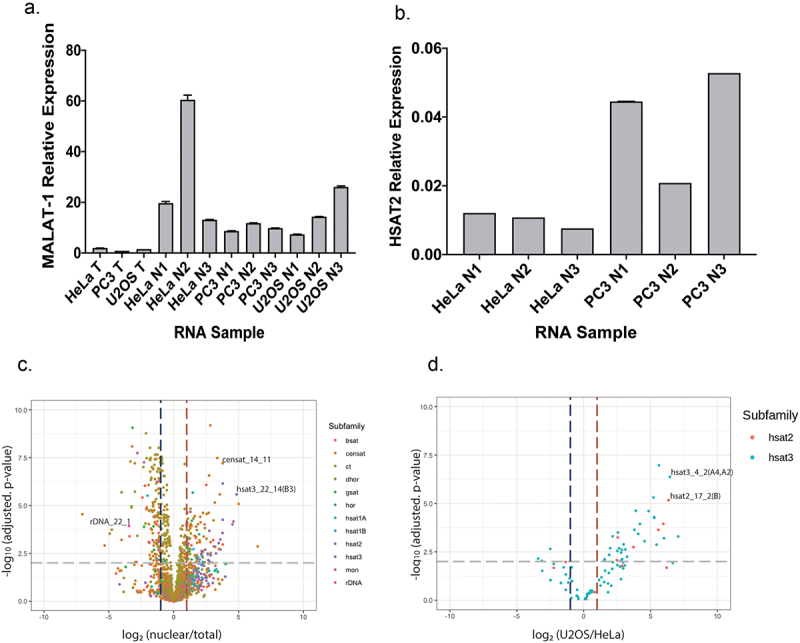
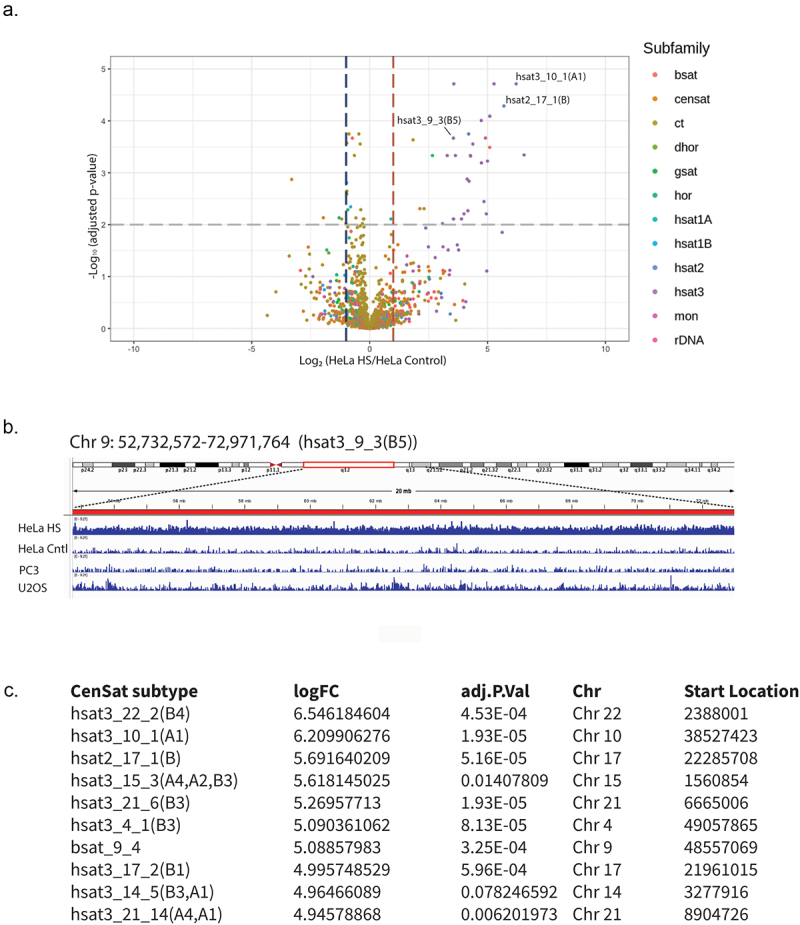
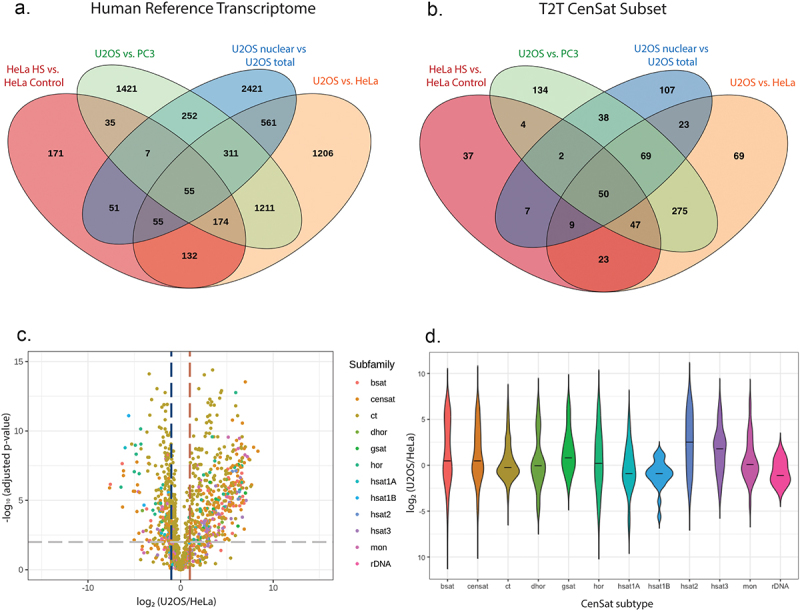
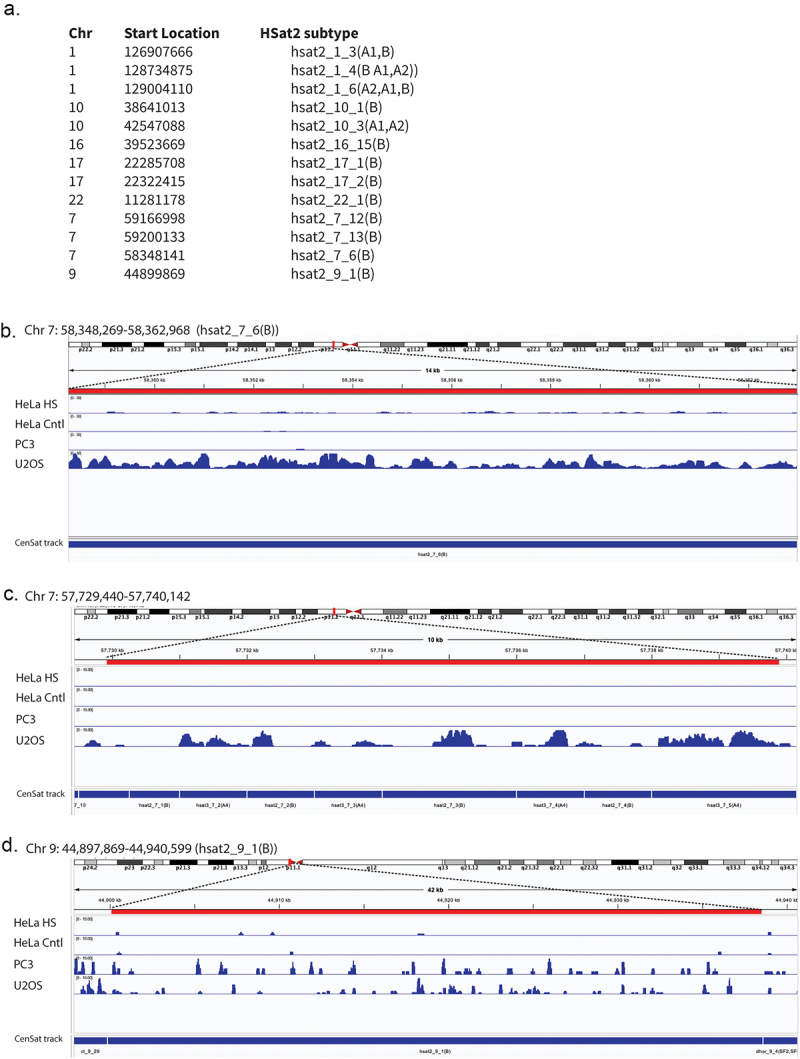
Human satellitess(HSats) are pericentric, tandemly repeating satellite DNA sequences in the human genome. While silent in normal cells, a subset of HSat2 noncoding RNA is expressed and accumulates in the nucleus of cancer cells. We developed a FISH-based approach for identification of the distribution of three subfamilies of HSat2 (A1, A2, B) sequences on individual human chromosomes. Further, using the HSat subfamily annotations in the T2T completed centromere satellite (CenSat) sequence, we isolated, defined and mapped differentially expressed sequence variants of nuclear-restricted HSat2 and HSat3 RNA from cancer cell lines and heat-shocked cells. We identified chromosome-specific and subfamily-specific expression of HSat2 and HSat3 and established a computational pipeline for differential expression analysis of tandemly repeated satellite sequences. Results suggest the differential expression of chromosome-specific HSat2 arrays in the human genome may underlie their accumulation in cancer cells and that specific HSat3 loci are upregulated upon heat shock.

Keywords: Cancer; RNA-seq; Satellite DNA; centromere; heat shock; nucleus; pericentromere; repetitive DNA.


Conflict of interest statement

No potential conflict of interest was reported by the author(s).

Figures

(a) Table showing which chromosome numbers have signal for A1, A2, B probes. (b) Color image of human chromosomes with green signal for probe HSAT2A1 on left. Signals on chr1 and chr16 are indicated with arrows. Grayscale photo of same image on right. (c) Color image of human chromosomes with green signal for probe HSAT2A2 on left. Grayscale photo of same image on right. (d) Color image of human chromosomes with green signal for probe HSAT2A2 on left. Grayscale photo of same image on right.
Figure 1.
DNA FISH mapping of HSat2 subfamilies in human male fibroblast cells. (a) Table showing the presence of each HSat2 subfamily on human chromosomes with FISH signals. Chromosomes with greater than 75% of chromosome spreads with signal on both homologous chromosomes were considered to have strong signal. Asterisks indicate chromosomes for which the DNA FISH results differed from the T2T-CHM13 CenSat HSat2 subfamily distributions. (b) Representative image of DNA FISH with HSat2A1 probe with FITC channel separated and shown in grayscale to the right. (c) Representative image of DNA FISH with HSatA2 probe with FITC channel separated and shown in grayscale to the right. (d) Representative image of DNA FISH with HSat2B probe with FITC channel separated and shown in grayscale to the right. Chromosomes are DAPI stained (blue) and all images shown are from hybridizations performed at 42°C. Scale bars indicate 10uM.
(a) Color image of U2OS cell nuclei with HSat2A1 RNA FISH signal in green (left). Grayscale signal shown to right. (b) Color image of U2OS cell nuclei with HSat2A2 RNA FISH signal in green (left). Grayscale signal shown to right. (c) Color image of U2OS cell nuclei with HSat2B RNA FISH signal in green (left). Grayscale signal shown to right. (d) Violin plot with ‘HSat2 RNA subtype’ on Y axis and ‘number of focal accumulations per nucleus’ on X axis. (e) Bar graph with ‘percent of nuclei with focal accumulations’ on Y axis and ‘HSat2RNA subtype’ on X axis.
Figure 2.
HSat2 subtype RNA FISH in U2OS cells. (a) Representative image of RNA FISH with HSat2A1 probe in U2OS cells. (b) Representative image of RNA FISH with HSat2A2 probe in U2OS cells. (c) Representative image of RNA FISH with HSat2B probe in U2OS cells. (d). Violin plot showing distribution of number of HSat2 RNA focal accumulations per nucleus for each of the 3 HSat2 subtype probes. A minimum of 60 nuclei were analyzed for each probe. Thick dashed line shows median while thin dashed lines show first and third quartiles for each dataset. (e) Bar graph depicting percent of nuclei with at least 1 RNA focal accumulation for each of the HSat2 subtype FISH probes. Scale bars indicate 10uM.
(a) (upper panels) Color images of HeLa control cell nuclei with HSat3 RNA FISH signal in green (left). Grayscale signal shown to right. (bottom panels) Color images of heat-shocked HeLa cell nuclei with HSat3 RNA FISH signal in green (left). Grayscale signal shown to right. (b) Bar graph with ‘Relative HSat3 expression’ on Y axis and ‘Cell line’ on X axis.
Figure 3.
HSat3 is overexpressed upon heat shock. (a) (upper panels) RNA FISH with a HSat3 probe (green) on control HeLa cells (non heat-shocked) and heat-shocked HeLa cells (bottom panels). Large accumulations of HSat3 RNA (green, separated channel shown in grayscale to the right) within the nucleus (DAPI) are evident in a subset of heat-shocked cells. Scale bars indicate 10uM. (b) RT-qPCR from cDNA isolated from 3 control HeLa cell lines and 3 heat-shocked HeLa cell lines. HSat3 expression is normalized to B-actin. Error bars denote 95% confidence interval.
(a) (Top left) Bar graph with ‘MALAT-1 Relative Expression’ on Y axis and ‘RNA Sample’ on X axis. (b) (Top right) Bar graph with ‘HSAT2 Relative Expression’ on Y axis and ‘RNA Sample’ on X axis. (c) (Bottom left) Volcano plot with ‘-log10(adjusted p-value)’ on Y axis and ‘log2 (nuclear/total)’ on X axis. CenSat subfamilies are indicated as different color dots. (d) (bottom right) Volcano plot with ‘-log10(adjusted p-value)’ on Y axis and ‘log2 (U2OS/HeLa)’ on X axis. HSat subfamilies are indicated as different color dots.
Figure 4.
Nuclear isolation of RNA from various cell lines for RNA-seq. (a) RT-qPCR relative enrichment of nuclear MALAT-1 noncoding RNA in nuclear RNA samples (N) compared to total RNA samples (T) for U2OS, HeLa, and PC3 cell lines. Data are shown normalized to B-actin housekeeping gene. Error bars indicate 95% confidence interval. (b) RT-qPCR relative enrichment of HSat2 RNA in nuclear RNA from HeLa and PC3 cells. Data are shown normalized to B-actin housekeeping gene. Error bars indicate 95% confidence interval. (c) Volcano plot of differentially expressed T2T-CHM13 annotated CenSat subfamily mapping RNA-seq reads from U2OS nuclear versus total RNA. Vertical dashed blue and red lines indicate Log2 change of − 1/1, respectively. Horizontal dashed line indicates -log10 (0.01) adjusted p-value significance cutoff. CenSat subfamilies are labeled by color as indicated to the right, with a few individual sequences labeled on the plot. (d) Volcano plot of differentially expressed HSat2/3 mapping RNA-seq reads from U2OS nuclear versus HeLa indicates overabundance of HSat2/3 sequences in RNA derived from U2OS nuclear RNA compared to HeLa nuclear RNA. Vertical dashed blue and red lines indicate Log2 change of − 1/1, respectively. Horizontal dashed line indicates -log10 (0.01) adjusted p-value significance cutoff. HSat2 subfamilies are labeled in cyan and HSat2 sequences are labeled in red, with the most overrepresented of each family labeled.
(a) Volcano plot with ‘-log10(adjusted p-value)’ on Y axis and ‘log2 (HeLa HS/HeLa Control)’ on X axis. CenSat subfamilies are indicated as different color dots. (b) Image showing distribution of RNA-seq mapping reads for Hela HS, HeLa control, PC3, and U2OS libraries to human chromosome 9 location containing HSat3. (c) Table showing CenSat locations that have the most changed expression upon heat shock in HeLa cells.
Figure 5.
HSat3 expression is induced in a locus-dependent manner in heat-shocked HeLa cells. (a) Volcano plot of T2T-CHM13 annotated Censat subfamily repeats differentially expressed in HeLa heat-shocked versus control cells. Each dot represents a unique genomic sequence. Grey dashed line indicates -log10 (adj.P-value) of significance threshold (0.01). Blue and red dashed lines indicate Log2 fold change of − 1 and 1, respectively. CenSat annotated repeat families are shown color-coded in the key to the right. (b) IGV screenshot of Chr9 hSat3_9_3(B5) region at Chr9: 52,732,572 -72,971,764. Mapped reads are shown for each cell line as labeled for each track. Tracks are shown to the same scale and triplicates of each were combined to create merged tracks for each cell line. (c) List of HSat3 loci most differentially expressed upon heat shock in HeLa cells. Genomic coordinates, log2 of folded change, and adjusted p-value are included.
(a) (top left) Color coded Venn diagram showing 4 comparisons for human reference transcriptome mapping reads: HeLa HS vs. HeLa Control, U2OS vs. PC3, U2OS nuclear vs. U2OS total, U2OS vs. HeLa. (b) (top right) Color coded Venn diagram showing 4 comparisons for T2T CenSat subset mapping reads : HeLa HS vs. HeLa Control, U2OS vs. PC3, U2OS nuclear vs. U2OS total, U2OS vs. HeLa. (c) (middle left) Volcano plot with ‘-log10(adjusted p-value)’ on Y axis and ‘log2 (U2OS/HeLa)’ on X axis. CenSat subfamilies are indicated as different color dots. (d) (middle right) Violin plot with ‘log2 (U2OS/HeLa)’ on Y axis and ‘CenSat subtype’ on X axis. Cen Sat subtypes are shown in different colors.
Figure 6.
Differential expression analysis of annotated CenSats (a) Venn diagram of up-regulated differentially expressed genes annotated in the human reference transcriptome for 4 comparisons: HeLa HS versus HeLa control (non heat-shocked) (red), U2OS versus PC3 (green), U2OS nuclear RNA vs. U2OS total RNA (blue), U2OS versus HeLa (orange). Number within each section indicated the number of up-regulated differentially expressed genes belonging to that group. (b) Venn diagram of up-regulated differentially expressed genes annotated in the T2T-CHM13 CenSat subset for 4 comparisons: HeLa HS versus HeLa control (red), U2OS versus PC3 (green), U2OS nuclear RNA vs. U2OS total RNA (blue), U2OS versus HeLa (orange). Number within each section indicated the number of differentially expressed genes up-regulated belonging to that group. (c) Volcano plot of CenSat subset differentially expressed in U2OS compared to HeLa. Each dot represents a unique genomic sequence. Grey dashed line indicates -log10(adj.P-value) of significance threshold (0.01). Blue and red dashed lines indicate Log2 fold change of − 1 and 1, respectively. Censat annotated repeat families are shown color-coded in the key to the right. (d) Violin plot of CenSat subtypes differentially expressed in U2OS compared to HeLa nuclear RNA. Horizontal black line within each violin shape represents the mean of log2 fold change.
(a) Table showing chromosomal locations of HSat2 subtypes that are expressed in cancer cells. (b) Image showing distribution of RNA-seq mapping reads for Hela HS, HeLa control, PC3, and U2OS libraries to a human chromosome 7 location containing HSat2B. (c) Image showing distribution of RNA-seq mapping reads for Hela HS, HeLa control, PC3, and U2OS libraries to a human chromosome 7 location containing HSat2 and HSat3 subtypes. (d) Image showing distribution of RNA-seq mapping reads for Hela HS, HeLa control, PC3, and U2OS libraries to a human chromosome 9 location containing HSat2B.
Figure 7.
Analysis of overexpressed HSAT sequences. (a) Filtered list of HSat2 loci that are considered expressed based on the abundance of reads in at least 3 RNA-seq libraries. Genome coordinates and subtype information included. (b) Genome view of HSat2_7_6(B) region on Chr 7 showing distribution of mapped reads. Track height is identical (0-50) for all cell lines and triplicate browser extensible data (bed) files for each biological replicate were combined for each track. Dashed line indicates where the HSat2 genomic region maps to the pericentric region on Chr 7 denoted by the red bar. (c) Genome view of an HSat2 and HSat3-containing locus on Chr 7 that is highly expressed across its length in U2OS cells. Track height is identical (0-10) for all cell lines and triplicate browser extensible data (bed) files for each biological replicate were combined for each track. Dashed line indicates where the genomic region maps to the pericentric region on Chr 7 denoted by the red bar. (d) Genome view of HSat2_9_1(B) region on Chr 9 showing distribution of mapped reads. Track height is identical (0-10) for all cell lines and triplicate browser extensible data (bed) files for each biological replicate were combined for each track. Dashed line indicates where the genomic region maps to the pericentric region on Chr 9 denoted by the red bar. Integrated Genomics Viewer (IGV)45 was used to visualize bed tracks aligned to the Human T2T CHM13-v2.0 reference and generate images.

Similar articles

Cited by

  • Noncoding RNAs in nuclear organization.
    Dube T, Carone DM. Dube T, et al. Nucleus. 2025 Dec;16(1):2477848. doi: 10.1080/19491034.2025.2477848. Epub 2025 Mar 13. Nucleus. 2025. PMID: 40083045 Free PMC article. No abstract available.

References

    1. Henikoff S, Ahmad K, Malik HS.. The centromere paradox: stable inheritance with rapidly evolving DNA. Science. 2001;293(5532):1098–19. doi: 10.1126/science.1062939 - DOI - PubMed
    1. Kit S. Equilibrium sedimentation in density gradients of DNA preparations from animal tissues. J Mol Biol. 1961;3(6):711–IN2. doi: 10.1016/s0022-2836(61)80075-2 - DOI - PubMed
    1. Britten RJ, Kohne DE. Repeated sequences in DNA. Hundreds of thousands of copies of DNA sequences have been incorporated into the genomes of higher organisms. Science. 1968;161(3841):529–540. doi: 10.1126/science.161.3841.529 - DOI - PubMed
    1. Corneo G, Ginelli E, Polli E. Renaturation properties and localization in heterochromatin of human satellite DNA’s. Biochim Biophys Acta. 1971;247(4):528–534. doi: 10.1016/0005-2787(71)90689-7 - DOI - PubMed
    1. Corneo G, Zardi L, Polli E. Elution of human satellite DNAs on a methylated albumin kieselguhr chromatographic column: isolation of satellite DNA. IV. Biochim Biophys Acta. 1972;269(2):201–204. doi: 10.1016/0005-2787(72)90427-3 - DOI - PubMed

LinkOut - more resources