One Health approach probes zoonotic non-typhoidal Salmonella infections in China: A systematic review and meta-analysis
- PMID: 39620281
- PMCID: PMC11610537
- DOI: 10.7189/jogh.14.04256
One Health approach probes zoonotic non-typhoidal Salmonella infections in China: A systematic review and meta-analysis
Abstract
Background: Zoonotic infections, particularly those caused by non-typhoidal Salmonella (NTS), pose a significant disease burden. However, there is a notable lack of comprehensive and integrated studies employing the One Health approach to address Salmonella prevalence. In this study, we aimed to analyse NTS spatiotemporal prevalence, serovar distribution, and antimicrobial resistance (AMR) across China.
Methods: We conducted a systematic review and meta-analysis to understand the dynamics of NTS in a One Health context in China. We searched the CNKI, Wanfang, and PubMed databases for Chinese and English peer-reviewed articles published before 1 January 2022 dealing with Salmonella in the context of China. We examined the dynamic prevalence along the food chain, the risk of dominant serovars and the carriers' regional contribution by principal component analysis, and the AMR burden before and after the ban on using antimicrobials as feed additives across five decades. We used the inverse variance index as an indicator of the inconsistency across studies, and we adopted the restricted maximum likelihood model due to high heterogeneity for analysis with a 95% confidence level for the pooled prevalence estimate.
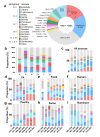
Results: Based on 562 retrieved high-quality studies during 1967-2021, representing 5 052 496 samples overall and 80 536 positive samples for NTS isolates, the overall average prevalence was 7.35% (95% confidence interval (CI) = 0.069-0.087), which was regionally relatively higher in northern China (8.19%; 95% CI = 0.078-0.117) than in southern China (6.94%; 95% CI = 0.067-0.088). Poultry was the primary vehicle for serovars Enteritidis and Indiana (especially in the north), while swine and ruminants for Typhimurium and Derby were the first to highlight the regional livestock contribution to serovar prevalence. The overall AMR rate was 73.63% (95% CI = 0.68-0.99), decreasing after the ban on excessive use of feed-based antibiotics in livestock since 2020, with a relatively low resistance towards front-line and last-resort drugs.
Conclusions: Our study emphasises the importance of adopting a One Health framework to better understand the zoonotic nature of human NTS and highlights the dominant serovars on food contamination and human infection. The similarity in AMR patterns between poultry and human isolates further emphasises the integrated approach for evaluating disease burden and implementing targeted interventions.
Copyright © 2024 by the Journal of Global Health. All rights reserved.
Conflict of interest statement
Disclosure of interests: The authors completed the ICMJE Disclosure of Interest Form (available upon request from the corresponding author) and disclose no relevant interest.
Figures


Similar articles
-
Serovars, virulence factors, and antimicrobial resistance profile of non-typhoidal Salmonella in the human-dairy interface in Northwest Ethiopia: A one health approach.PLoS Negl Trop Dis. 2024 Nov 20;18(11):e0012646. doi: 10.1371/journal.pntd.0012646. eCollection 2024 Nov. PLoS Negl Trop Dis. 2024. PMID: 39565761 Free PMC article.
-
Antimicrobial drug resistant non-typhoidal Salmonella enterica in commercial poultry value chain in Chitwan, Nepal.One Health Outlook. 2020 Oct 1;2:18. doi: 10.1186/s42522-020-00025-4. eCollection 2020. One Health Outlook. 2020. PMID: 33829137 Free PMC article.
-
Identifying emerging trends in antimicrobial resistance using Salmonella surveillance data in poultry in Spain.Transbound Emerg Dis. 2020 Jan;67(1):250-262. doi: 10.1111/tbed.13346. Epub 2019 Sep 13. Transbound Emerg Dis. 2020. PMID: 31484211 Free PMC article.
-
A review and meta-analysis of non-typhoidal Salmonella in Vietnam: Challenges to the control and antimicrobial resistance traits of a neglected zoonotic pathogen.One Health. 2024 Mar 2;18:100698. doi: 10.1016/j.onehlt.2024.100698. eCollection 2024 Jun. One Health. 2024. PMID: 38468610 Free PMC article. Review.
-
Epidemiology of streptomycin resistant Salmonella from humans and animals in Ethiopia: A systematic review and meta-analysis.PLoS One. 2020 Dec 17;15(12):e0244057. doi: 10.1371/journal.pone.0244057. eCollection 2020. PLoS One. 2020. PMID: 33332438 Free PMC article.
Cited by
-
Detection of Salmonella spp. Related Co-Infections Among Children with Diarrheal Diseases in Guangzhou, China.Infect Drug Resist. 2025 Apr 16;18:1895-1903. doi: 10.2147/IDR.S515033. eCollection 2025. Infect Drug Resist. 2025. PMID: 40259994 Free PMC article.
-
Disinfectants and one health review: The role of reactive oxygen species in the bactericidal activity of chlorine against Salmonella.One Health. 2025 Feb 6;20:100989. doi: 10.1016/j.onehlt.2025.100989. eCollection 2025 Jun. One Health. 2025. PMID: 40035020 Free PMC article. Review.
-
Avian-specific Salmonella transition to endemicity is accompanied by localized resistome and mobilome interaction.Elife. 2025 Mar 4;13:RP101241. doi: 10.7554/eLife.101241. Elife. 2025. PMID: 40035424 Free PMC article.
-
Prevalence of Salmonella enterica Serotype 4,[5],12:i:- from Human Sources: Antimicrobial Resistance, Genotypic Diversity and Emergence of Carbapenem Resistance - China, 2017-2023.China CDC Wkly. 2025 Jun 13;7(24):821-830. doi: 10.46234/ccdcw2025.134. China CDC Wkly. 2025. PMID: 40620292 Free PMC article.
-
Sociodemographic and clinical factors influencing typhoid fever prevalence and multidrug resistance in Niger State, Nigeria.PLoS One. 2025 Jul 8;20(7):e0327740. doi: 10.1371/journal.pone.0327740. eCollection 2025. PLoS One. 2025. PMID: 40627588 Free PMC article.
References
Publication types
MeSH terms
Substances
LinkOut - more resources
Full Text Sources
Medical
