. 2025 Apr 1;31(7):1275-1291.
doi: 10.1158/1078-0432.CCR-24-2669.

Noninvasive Multicancer Detection Using DNA Hypomethylation of LINE-1 Retrotransposons

Affiliations

Noninvasive Multicancer Detection Using DNA Hypomethylation of LINE-1 Retrotransposons

Marc Michel et al. Clin Cancer Res. .

Abstract

Purpose: The detection of ctDNA, which allows noninvasive tumor molecular profiling and disease follow-up, promises optimal and individualized management of patients with cancer. However, detecting small fractions of tumor DNA released when the tumor burden is reduced remains a challenge.

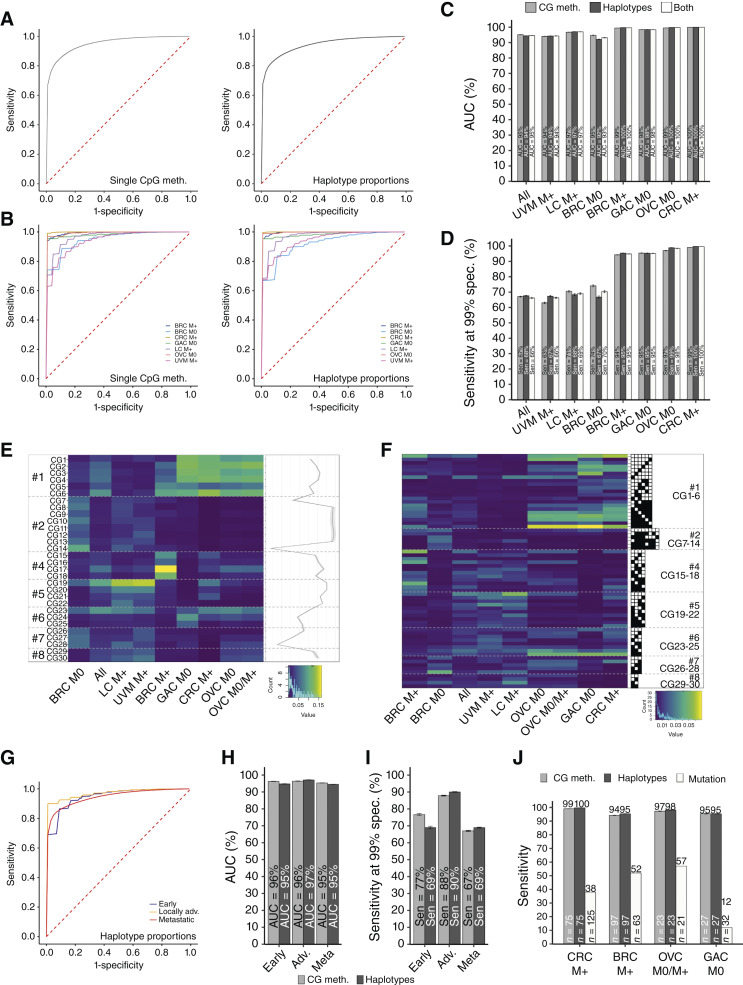
Experimental design: We implemented a new, highly sensitive strategy to detect bp resolution methylation patterns from plasma DNA and assessed the potential of hypomethylation of long interspersed nuclear element-1 retrotransposons as a noninvasive multicancer detection biomarker. The Detection of Long Interspersed Nuclear Element Altered Methylation ON plasma DNA method targets 30 to 40,000 young long interspersed nuclear element-1 retrotransposons scattered throughout the genome, covering about 100,000 CpG sites and is based on a reference-free analysis pipeline.

Results: Resulting machine learning-based classifiers showed powerful correct classification rates discriminating healthy and tumor plasmas from six types of cancers (colorectal, breast, lung, ovarian, and gastric cancers and uveal melanoma, including localized stages) in two independent cohorts (AUC = 88%-100%, N = 747). The Detection of Long Interspersed Nuclear Element Altered Methylation ON plasma DNA method can also be used to perform copy number alteration analysis that improves cancer detection.

Conclusions: This should lead to the development of more efficient noninvasive diagnostic tests adapted to all patients with cancer, based on the universality of these factors. See related commentary by Szymanski et al., p. 1179.


Conflict of interest statement

M. Michel reports a patent for PCT/EP2023/074092—Sensitive and Specific Determination of DNA Methylation Profiles pending. M. Heidary reports grants from the European Research Council (ERC-StG EpiDetect), the Ligue contre le cancer (RS17-75-75), the prematuration program of the Centre National pour la Recherche Scientifique, the SiRIC 2 Curie program (INCa-DGOS-Inserm_12554), the DEEP Strive funding (LABEX DEEP 11-LBX0044), ANR-10-EQPX-03 (Equipex), ANR-10-INBS-09-08 (France Genomique Consortium), and ANR-19-P3IA-0001 (PRAIRIE 3IA Institute) during the conduct of the study, as well as a patent for “PCT/EP2023/074092—Sensitive and Specific Determination of DNA Methylation Profiles—Inventors: Proudhon, Charlotte; Azencott, Chloé-Agathe; Michel, Marc; Heidary, Maryam” pending. M. Kamal reports personal fees from Roche outside the submitted work. C. Le Tourneau reports personal fees from MSD, Bristol Myers Squibb, Merck, AstraZeneca, Celgene, Seattle Genetics, Roche, Novartis, Rakuten, Nanobiotix, and GSK outside the submitted work. M.-H. Stern reports a patent for US20190256921A1 pending, a patent for ES2978017T3 issued, a patent for PCT/EP2019/056445 issued, and a patent for PCT/EP2023/057543 issued. C.-A. Azencott reports grants from Agence Nationale de la Recherche during the conduct of the study, as well as grants from Janssen Research & Development outside the submitted work; in addition, C.-A. Azencott reports a patent for WO2024047250—Sensitive and Specific Determination of DNA Methylation Profiles pending. C. Proudhon reports grants from the European Research Council, the Ligue contre le cancer, the French National Center for Scientific Research, grants from SiRIC 2 Curie program, and the DEEP Strive funding during the conduct of the study, as well as a patent for PCT/EP2023/074092—Sensitive and Specific Determination of DNA Methylation Profiles—Inventors: Proudhon, Charlotte; Azencott, Chloé-Agathe; Michel, Marc; Heidary, Maryam pending. No disclosures were reported by the other authors.

Figures

Figure 1.
Figure 1.
Targeting primate-specific LINE-1 elements reveals genome-wide plasma DNA methylation patterns. A, CpG density along the structure of an L1HS element, which contains 95 CpG. The DIAMOND assay targets 30 CpG. Each target amplicon is highlighted by a black bar below the structure. The number of CpG sites detected per amplicon is displayed in blue. B, L1PA copy number hit by uniquely and/or randomly mapped reads, obtained from a healthy plasma vs. ovarian (OVC, top track) or uveal melanoma (UVM, middle track) tumor tissue samples “deep sequenced” (54M, 44M, or 46M reads, respectively) over the distribution of L1PA elements annotated in the genome (RepeatMasker on hg38, gray bottom track). C, Histogram summarizing the most represented subfamilies of L1 targeted by the DIAMOND assay in the three “deep-sequenced” samples, in descending order (sum of copies across the three samples). The colors highlight the relative contribution of L1PA copies hit by reads uniquely mapped, randomly mapped, or both. D, Methylation pattern observed across the eight regions targeted along the L1 element in the healthy plasma sample “deep-sequenced.” Metaplot showing the average methylation levels at each CpG position. Amplicon limits are delineated with gray dotted lines. The dark line marks the end of the 5′UTR. Average levels per amplicon are indicated. UTR, untranslated region.
Figure 2.
Figure 2.
L1PA hypomethylation is detectable from plasma DNA in multiple forms of cancer. A, Global DNA methylation of fully methylated (healthy WBC DNA treated with SssI) and unmethylated (whole-genome amplified healthy WBC DNA) controls, cancer cell lines, or tissues. Ovarian healthy tissues were collected next to ovarian tumors. The global methylation levels for each sample correspond to the percentage of CG dinucleotides at each CpG site averaged by the number of CpG sites. Statistical differences between controls, cell lines, or tissues and healthy WBCs were computed using the Mann–Whitney U test (PFully_meth. = 9.97e−07, PUnmeth. = 1.86e−06, PCRC_Cells = 0.266, POVC_Cells = 1.20e−02, PBRC_Cells = 2.47e−06, PUVM_Cells = 6.77e−05, PHealthy_OVC_Tissues = 0.063, POVC_Tissues = 8e−03, PBRC_Tissues = 4.10e−04, and PUVM_Tissues = 0.88; Supplementary Table S3). B, Global DNA methylation in cancer plasma including metastatic stages (M+) and nonmetastatic stages (M0) as well as HD plasmas. Statistical differences between each cancer subgroup and healthy samples were computed using the Mann–Whitney U test (PCRC_M+ = 1.27e−29, PBRC_M+ = 3.79e−19, PUVM_M+ = 8.29e−06, PLC_M+ = 0.655, POVC_M0 = 1.94e−05, PGAC_M0 = 4.28e−08, and PBRC_M0 = 9.10e−01; Supplementary Table S3). Black dotted lines represent the median. C, Methylation level at each targeted CpG site (x-axis), for each healthy sample (y-axis), depicted as a heatmap. CpG numbers are indicated. The metaplot represents the average methylation levels of the population. Amplicon numbers are indicated. D, Differential methylation levels between healthy samples and patients for each type of cancer, represented as metaplots. E, Proportion of methylation motifs, called haplotypes, for each amplicon (mean centered per amplicon). Only the most important features are represented (see Fig. 3F; “Materials and Methods”). Blue arrows highlight the most abundant haplotype in each amplicon. F, Mean centered abundance of the most important haplotypes with the highest co-methylation patterns (mostly fully methylated or fully unmethylated molecules) in cancer subgroups compared with HDs. Statistical significances were computed using the Mann–Whitney U test on raw haplotype proportions (Supplementary Table S5). HD, healthy donor; WBC, white blood cell.
Figure 3.
Figure 3.
L1PA hypomethylation–based classifiers recognize samples from multiple forms of cancer. A and B, ROC curves obtained for plasma sample classification using single CpG methylation levels (n = 30) or haplotype proportions (n = 372) with the “all cancers” model (A) or the “cancer-types” models (B). All classifications include 5,000 stratified random repetitions of learning on 60% of the samples and testing on the 40% left, with undersampling for classes equilibrium (results with and without undersampling are presented in Supplementary Fig. S3A and S3B). NCRC_M+ = 75, NBRC_M+ = 97, NLC_M+ = 50, NUVM_M+ = 55, NOVC_M+ = 4 (included only in “all cancers” testing), NOVC_M0 = 18, NGAC_M0 = 27, and NBRC_M0 = 23 tested vs. 123 HDs. ROC curves shown are obtained by averaging the sensitivity and specificity of each repetition of learning. C and D, Performances for classifiers using single CpG methylation levels (gray), haplotype proportions (black), or both (white) presented as AUCs (C) or sensitivities at 99% specificity (D). Average AUCs are computed from the 5,000 AUCs generated by each repetition of learning. Bars indicate 95% CI. E and F, Importance (mean decrease in impurity) of the features used by the classifiers depicted as clustered heatmaps. The features correspond to the CpG targets (E) or the haplotypes (F). Only the most important haplotypes (feature importance level >1%) are shown. G, ROC curves obtained for plasma sample classification with the three-stage model, using haplotype features. H and I, Performances for the three-stage classifiers using single CpG methylation levels (gray) or haplotype proportions (black) presented as AUCs (H) or sensitivities at 99% specificity (I). Early stages (I/II, N = 31), locally advanced stages (III, N = 30), and metastatic stages (IV, N = 281). J, Cancer detection rates with the methylation-based DIAMOND assay (haplotypes and CG methylation) vs. common recurrent mutations for samples assessed in previous studies [(13, 14, 62, 63)] or with NGS (Supplementary Table S6). HD, healthy donor. NGS, next-generation sequencing.
Figure 4.
Figure 4.
Multicancer classification performances are reproducible on an independent cohort. A, Number of patients and HDs in the discovery cohort (C1) and in the validation cohort (C2) for each cancer type and dissemination stage (nonmetastatic: M0 vs. metastatic: M+, NA, stage not available). Generated using Servier Medical Art. B, Methylation level at each targeted CpG sites (x-axis), for each healthy sample (y-axis) from C1 vs. C2, depicted as a heatmap. No clustering is done on the data, which come ordered by targeted CpG site on the x-axis (amplicon numbers are indicated). The metaplots represent the average levels for donors of C1 vs. C2 at each CpG site. C, Mean centered abundance of the most important haplotypes, with the highest co-methylation patterns, in HDs from C1 vs. C2. (Statistical differences computed using the Mann–Whitney U test are available in Supplementary Table S9) D, Comparison of the global levels of methylation in C1 vs. C2. Methylation levels are calculated as explained previously in Fig. 2. The P values are computed using the Mann–Whitney U test (PCRC_M+ = 0.680, POVC_M+ = 0.816, PBRC_M+ = 0.783, PLC_M+ = 0.596, PHealthy = 0.316, POVC_M0 = 4.74e−05, PBRC_M0 = 0.132; Supplementary Table S10). Black dotted lines represent the median. E, Performances for validation classifiers using haplotype features presented as ROC curves, AUCs, and sensitivities at 99% specificity obtained with the “all” cancers model or the “expert” models for cancer subgroups. All classifications include 5,000 stratified random repetitions of learning on the whole discovery cohort and testing on the whole validation cohort without undersampling. ROC curves shown are obtained by averaging the sensitivity and specificity of each repetition of learning. Average AUCs are computed from the 5,000 AUCs generated by each repetition of learning. Bars indicate 95% CI. F, Performances for three-stage “expert” classifiers: early stages (I/II, NC1 = 31, NC2 = 38), locally advanced stages (III, NC1 = 30, NC2 = 54), and metastatic stages (IV, NC1 = 281, NC2 = 113), presented as mean ROC curves, AUCs, or sensitivities at 99% specificity. G, Performances for integrated models (“all” or “stack”) when training for the specific group tested (seen) vs. when not training for this subgroup (blind). These classifications have been performed on the whole sample set, including C1 and C2. HD, healthy donor.
Figure 5.
Figure 5.
DIAMOND data contain signal to infer the tumor burden, which improves cancer detection. A and B, Comparison of the average levels of methylation observed in localized vs. metastatic plasma samples (A, PEarly/Adv. = 0.327, PAdv./Meta. = 3.14e−11, PEarly/Meta. = 2.82e−14; PBRC_M0/M+ = 1.3e−18, POVC_M0/M+ = 0.006, and PGAC_M0/M+ = 0.005; Supplementary Table S13) or in primary vs. metastatic tissues (B, POVC = 0.257; PUVM = 0.820; Supplementary Table S14). C, L1PA unique hits obtained for 15 breast cancer cell lines compared with the distribution of CytoScan probes distributed throughout the human genome. D, Genome-wide z-score for all cancer (N = 564) vs. healthy plasma samples (N = 120, 63 of the total 183 HDs are used as references to compute the z-score and are not displayed here, p = 1.21e−20). E, Genome-wide z-score by cancer subgroups vs. healthy samples. The P values are computed using the Mann–Whitney U test (PCRC_M+ = 2.05e−18, PBRC_M+ = 1.01e−18, PUVM_M+_ = 0.169, PLC_M+ = 0.769, POVC_M+_ = 1.84e−11, PGAC_M+ = 0.003, PBRC_M0 = 5.12e−17, POVC_M0 = 1.09e−12, and PGAC_M0 = 8.40e−06; Supplementary Table S15). F, Correlation analysis for genome-wide z-score vs. global methylation (roverall = −0.62; P = 1.25e−69). G, Performances of the two-step model incorporating CNA with DNA methylation analysis (classification is done as follows: ProbaCancer ≤ Threshold C1 AND GZ-score ≤ 121: prediction = Healthy; ProbaCancer > Threshold C1 OR GZ-score > 121: prediction = Cancer, see “Materials and Methods”). HD, healthy donor.

References

    1. Bettegowda C, Sausen M, Leary RJ, Kinde I, Wang Y, Agrawal N, et al. . Detection of circulating tumor DNA in early- and late-stage human malignancies. Sci Transl Med 2014;6:224ra24. - PMC - PubMed
    1. Newman AM, Bratman SV, To J, Wynne JF, Eclov NCW, Modlin LA, et al. . An ultrasensitive method for quantitating circulating tumor DNA with broad patient coverage. Nat Med 2014;20:548–54. - PMC - PubMed
    1. Garcia-Murillas I, Schiavon G, Weigelt B, Ng C, Hrebien S, Cutts RJ, et al. . Mutation tracking in circulating tumor DNA predicts relapse in early breast cancer. Sci Transl Med 2015;7:302ra133. - PubMed
    1. Bidard F-C, Weigelt B, Reis-Filho JS. Going with the flow: from circulating tumor cells to DNA. Sci Transl Med 2013;5:207ps14. - PubMed
    1. Diaz LA, Bardelli A. Liquid biopsies: genotyping circulating tumor DNA. J Clin Oncol 2014;32:579–86. - PMC - PubMed