. 2025 Sep;66(3):623-636.
doi: 10.1007/s13353-024-00917-5. Epub 2024 Dec 2.

Development of a novel gene expression panel for the characterization of MSCs for increased biological safety

Affiliations

Development of a novel gene expression panel for the characterization of MSCs for increased biological safety

Anna M Różycka-Baczyńska et al. J Appl Genet. 2025 Sep.

Abstract

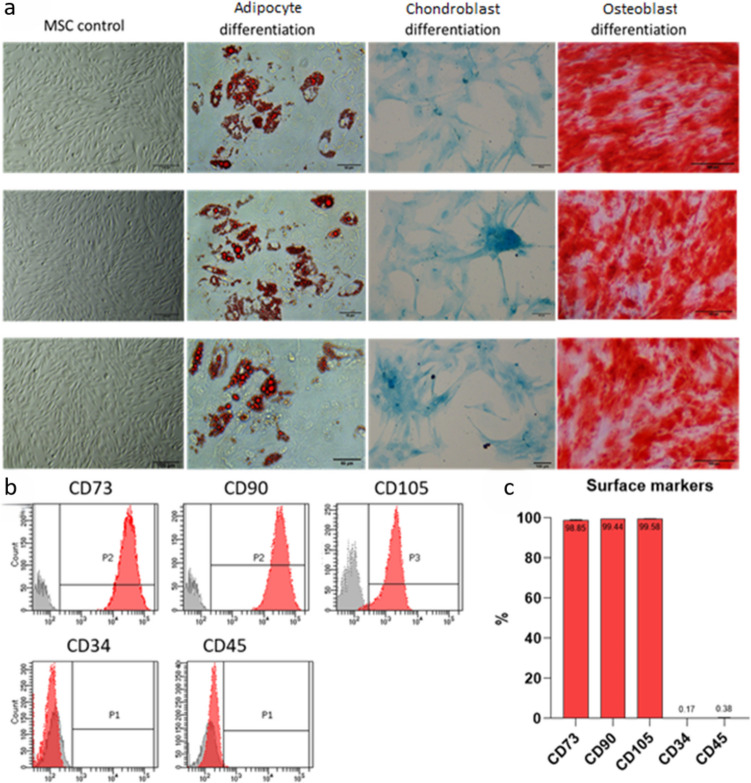
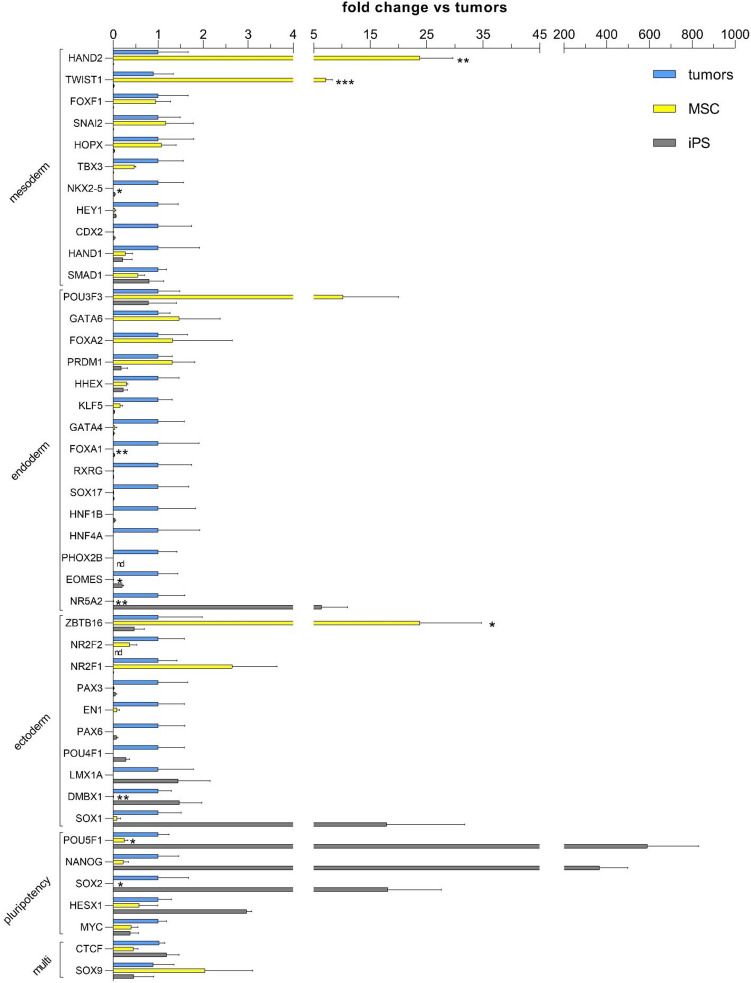
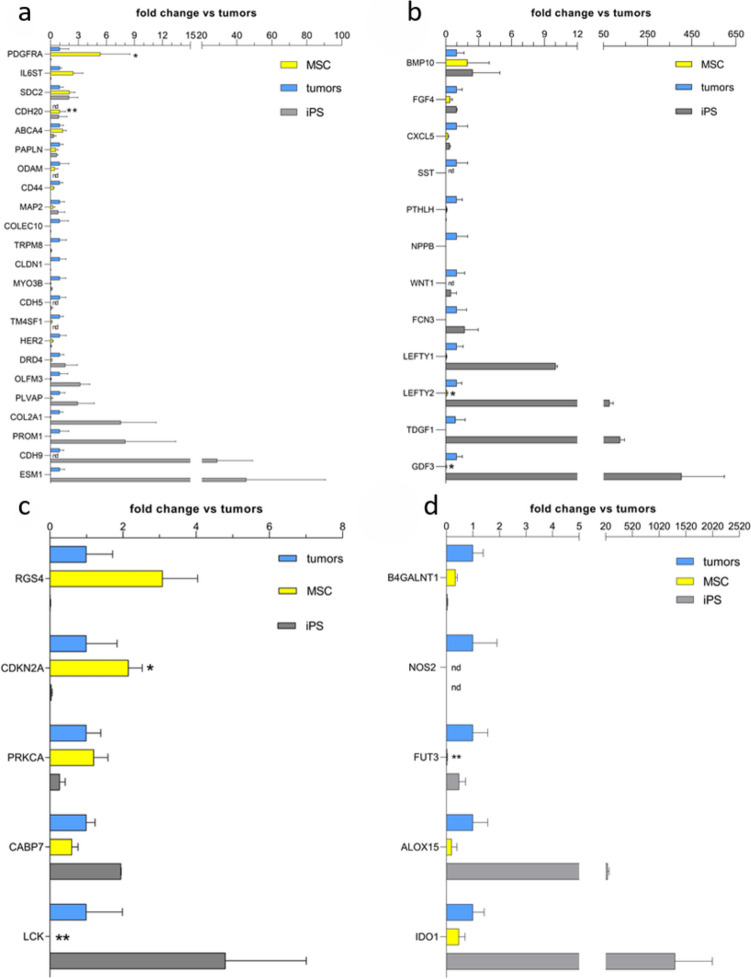
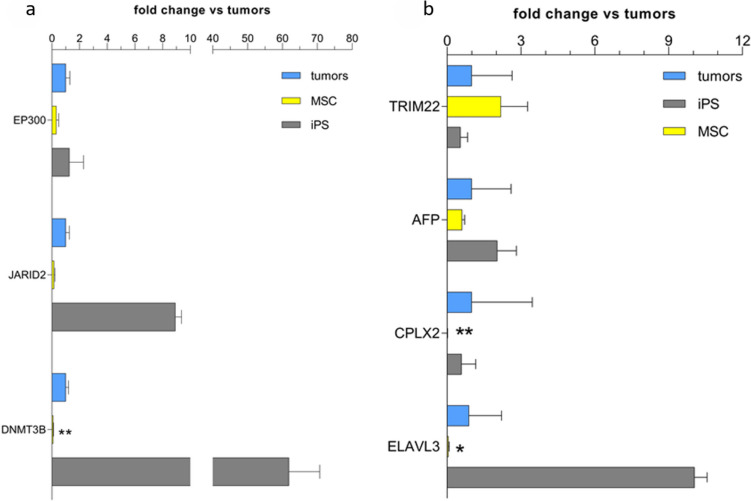
Mesenchymal stromal cells (MSCs) have a wide range of therapeutic applications due to their multipotency, immunomodulatory, and anti-inflammatory properties. Their ability to migrate and recolonize damaged tissues is also remarkable. However, the controversial occurrence of spontaneous tumorigenesis or malignant transformation of MSCs raises concerns about proposed cell-based therapies for patients that researchers must address. There are several in vitro and in vivo strategies for MSC safety approval, but there is still no described coherent scheme that allows the assessment of MSC oncogenic potential in a simple, robust, and reproducible manner. Here, we have developed a diagnostic panel of molecular markers that allows for the accurate verification of the quality and safety of MSCs. Moreover, presented in this article diagnostic panel that can define the origin and tumorigenicity of MSCs can be easily introduced into the routine quality control processes of MSC-based product manufacturing which will improve further clinical applications of MSCs.

Keywords: Cancer risk assessment; Cell therapy; MSCs; Mesenchymal stromal cells; Oncogenic potential.


Conflict of interest statement

Declarations. Ethical approval: This study was performed in line with the principles of the Declaration of Helsinki. Approval was granted by the Ethics Committee. Consent to participate: Written informed consent for the transfer of biological material for research purposes was obtained from all MSC donors. Competing interests: TO is an employee of Polski Bank Komórek Macierzystych S.A. (FamiCord Group), Board Member of FamiCord Group. TK is Director of Research and Development Department, Polski Bank Komórek Macierzystych S.A. IZM is employee of Polski Bank Komórek Macierzystych S.A. (FamiCord Group). ARB, IMS, and MW are past employees of Polski Bank Komórek Macierzystych S.A. (FamiCord Group). NR is an external expert of Polski Bank Komórek Macierzystych S.A. (FamiCord Group).

Figures

Fig. 1
Fig. 1
Multilineage differentiation and immunophenotype characterization at passage 3 (p3) (n = 10). a Representative images from three different MSC donors in conventional culture: unstained control (left-most panel), Oil red O showing differentiation into adipocytes (left panel), alcian blue showing differentiation into chondroblasts (right panel), and Alizarin red showing differentiation into osteoblasts (right-most panel). Size bar 50 µm for images showing differentiation into adipocytes and 100 µm for the other images. b Representative flow cytometry analysis of the surface markers CD45, CD34, CD90, CD73, and CD105 for MSCs used in further experiments (red peaks). The isotype controls are represented by the gray peaks. c The percentage of surface marker expression from different MSCs
Fig. 2
Fig. 2
Expression of lineage-specific transcription factors and transcriptional regulators in all cancer cell lines, iPSCs, and MSC lines (n = 3 for cancer cell lines, n = 2 for iPSC cell lines, and n = 10 for MSC cell lines). 2-ΔΔCT values for each individual gene were averaged for biological groups and calculated as the fold change of cancer cells vs. MSCs and iPSC lines. Data are presented as the mean ± SEM. Statistical analysis was performed in GraphPad using the Mann–Whitney test; *p < 0.05, **p < 0.01, and ***p < 0.001; nd, not detected
Fig. 3
Fig. 3
Expression of gene markers of different panels in cancer cell, iPSC, and MSC lines (n = 3 for cancer cell lines, n = 2 for iPSC cell lines, and n = 10 for MSC cell lines). The 2-ΔΔCT values for each individual gene were averaged for biological groups and calculated as the fold change in cancer cells vs. MSCs and iPSC lines, except for CDH20 in cancer cell lines for which all expression values were 0; thus, normalization was performed on iPS cell line expression. Gene coding membrane-associated and cell structure proteins are shown in a, b genes coding extracellular signaling proteins, c genes coding signal transduction proteins, and d genes coding metabolic regulator proteins. Data are presented as the mean ± SEM. Statistical analysis was performed using the Mann–Whitney test; *p < 0.05; **p < 0.01; nd, not detected
Fig. 4
Fig. 4
Expression of gene markers of different panels in cancer cells, iPSC, and MSC lines. The 2-ΔΔCT values for each individual gene were averaged for biological groups and calculated as the fold change in cancer cells vs. MSCs and iPSC lines, except for CDH20 in cancer cell lines for which all expression values were 0. Gene coding epigenetic regulator proteins (a) and other genes (b). Data are presented as the mean ± SEM. Statistical analysis was performed using the Mann–Whitney test; *p < 0.05; **p < 0.01; nd, not detected
Fig. 5
Fig. 5
Comparison of marker relative expression in MSCs of early (p3) to late (p10) passages (8 independent lines) based on a custom-designed assay. a A comparison of relative gene expression from late passage (p10) to early passage (p3) for each donor. The 2-ΔΔCT values were log2 transformed to obtain a uniform distribution in the heatmap presentation. Due to the minimal expression of the TDGF1, it represents the lowest values on the heat map. Genes that were amplified beyond Ct 36 were considered negative and were assigned the lowest value, − 16,61. b Graphs showing the expression of pluripotency, MSCs, and 2-ΔΔCT values were prepared in GraphPad. Data are presented as box plots incorporating individual values with the mean ± SEM. Statistical analysis was performed in GraphPad using the Mann–Whitney test; *p < 0.05; **p < 0.01; ns, not significant

References

    1. Abdelalim EM, Tooyama I (2012) The p53 inhibitor, pifithrin-α, suppresses self-renewal of embryonic stem cells. Biochem Biophys Res Commun 420(3):605–610. 10.1016/j.bbrc.2012.03.041 - PubMed
    1. Abdulrazzak H, Moschidou D, Jones G, Guillot PV (2010) Biological characteristics of stem cells from foetal, cord blood and extraembryonic tissues. J R Soc Interface 7(Suppl 6):S689–S706. 10.1098/rsif.2010.0347.focus - PMC - PubMed
    1. Ball SG, Shuttleworth CA, Kielty CM (2007) Mesenchymal stem cells and neovascularization: role of platelet-derived growth factor receptors. J Cell Mol Med 11(5):1012–1030. 10.1111/j.1582-4934.2007.00120.x - PMC - PubMed
    1. Barkholt L, Flory E, Jekerle V et al (2013) Risk of tumorigenicity in mesenchymal stromal cell based therapies — bridging scientific observations and regulatory viewpoints. Cytotherapy 15(7):753–759. 10.1016/j.jcyt.2013.03.005 - PubMed
    1. Bianco P (2014) Mesenchymal stem cells. Annu Rev Cell Dev Biol 30:677–704. 10.1146/annurev-cellbio-100913-013132 - PubMed

MeSH terms

LinkOut - more resources