. 2024 Dec 2;134(23):e181044.
doi: 10.1172/JCI181044.

HO-1 impairs the efficacy of radiotherapy by redistributing cGAS and STING in tumors

Affiliations

HO-1 impairs the efficacy of radiotherapy by redistributing cGAS and STING in tumors

Chuqing Zhang et al. J Clin Invest. .

Abstract

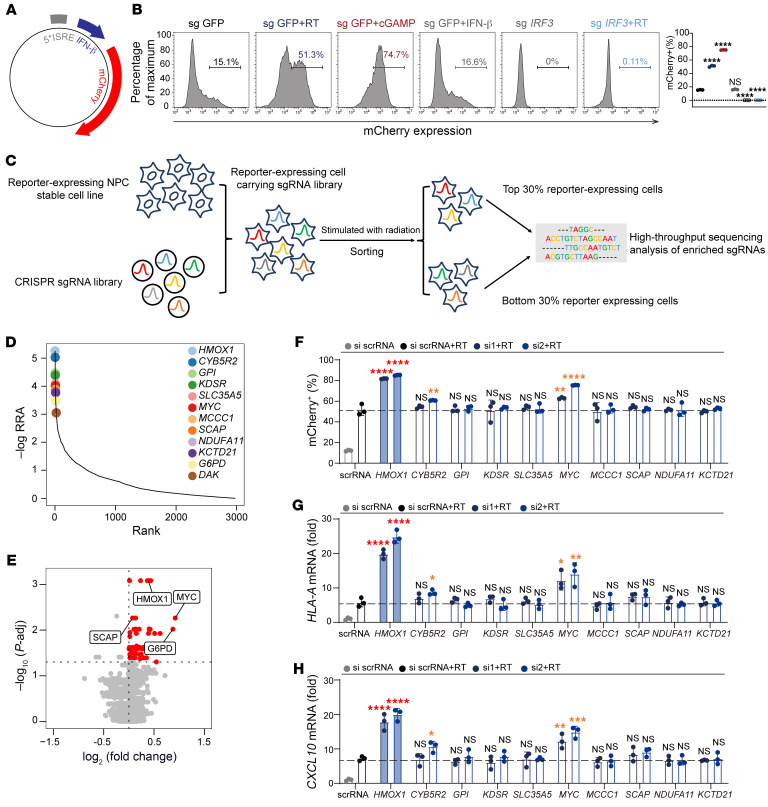
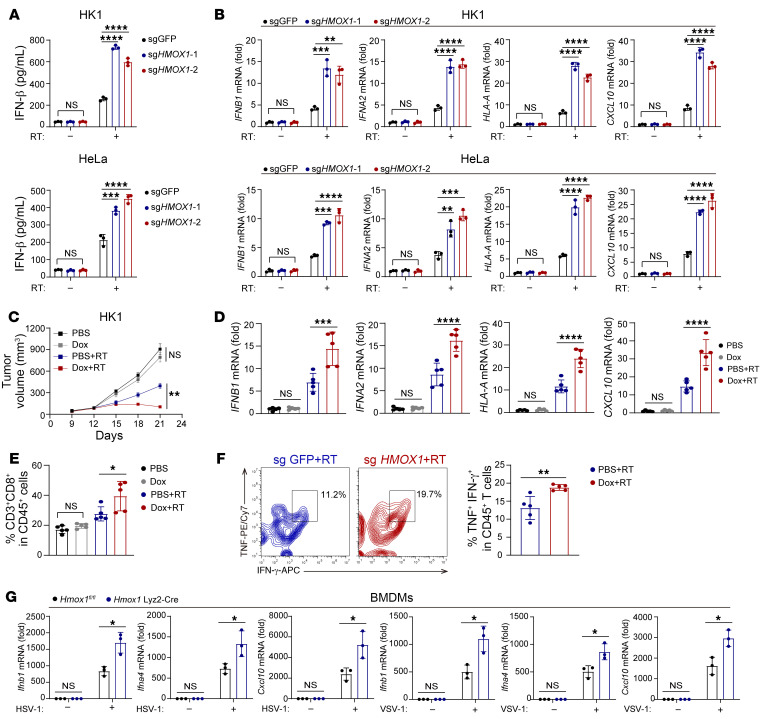
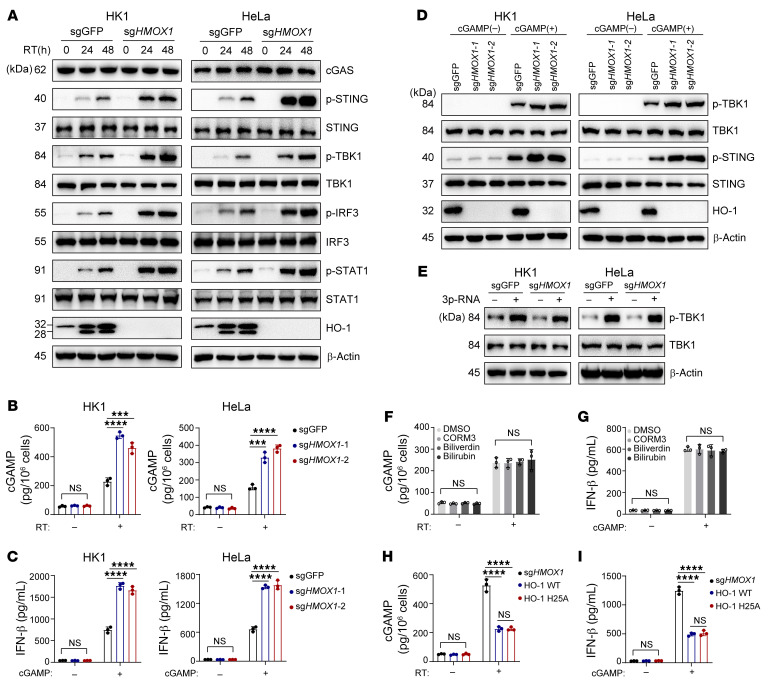
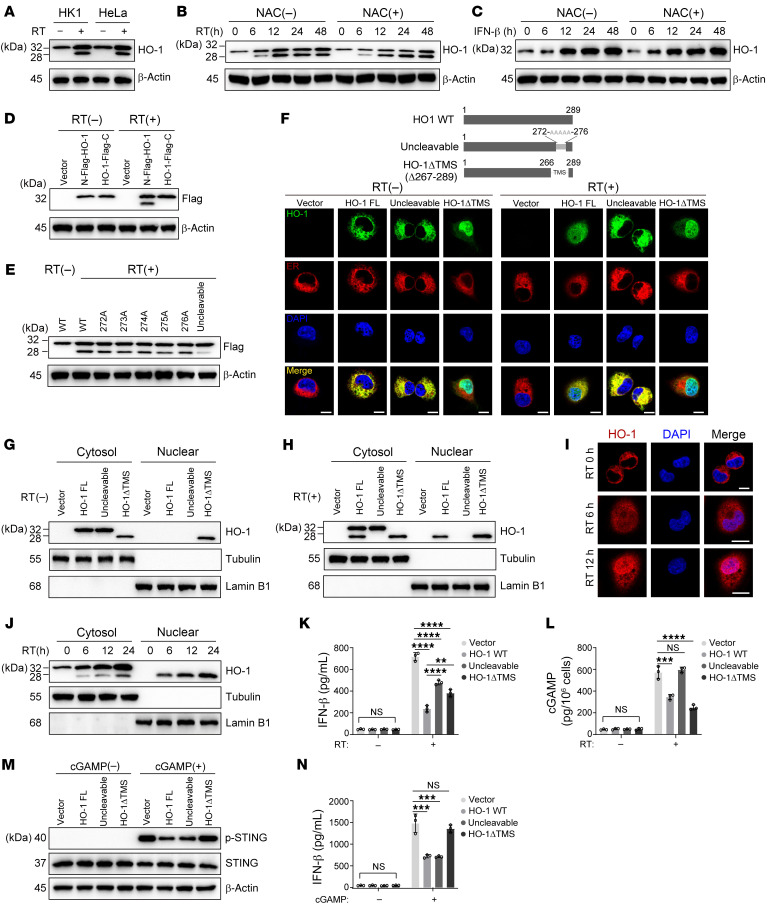
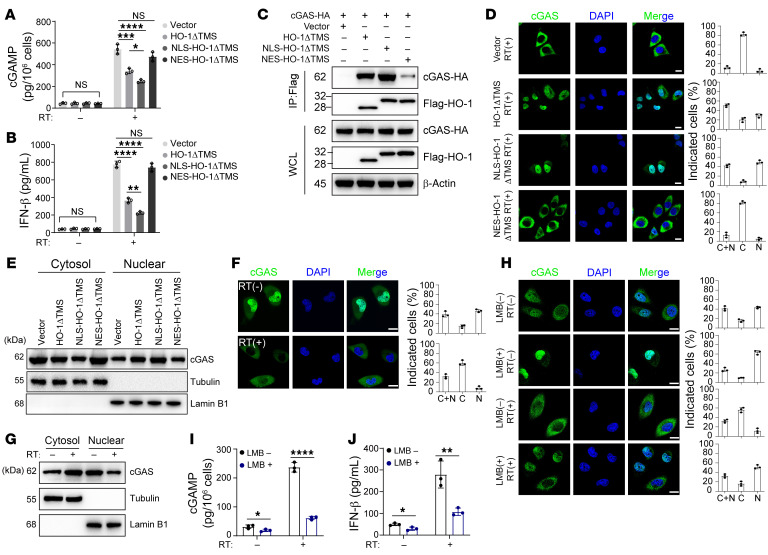
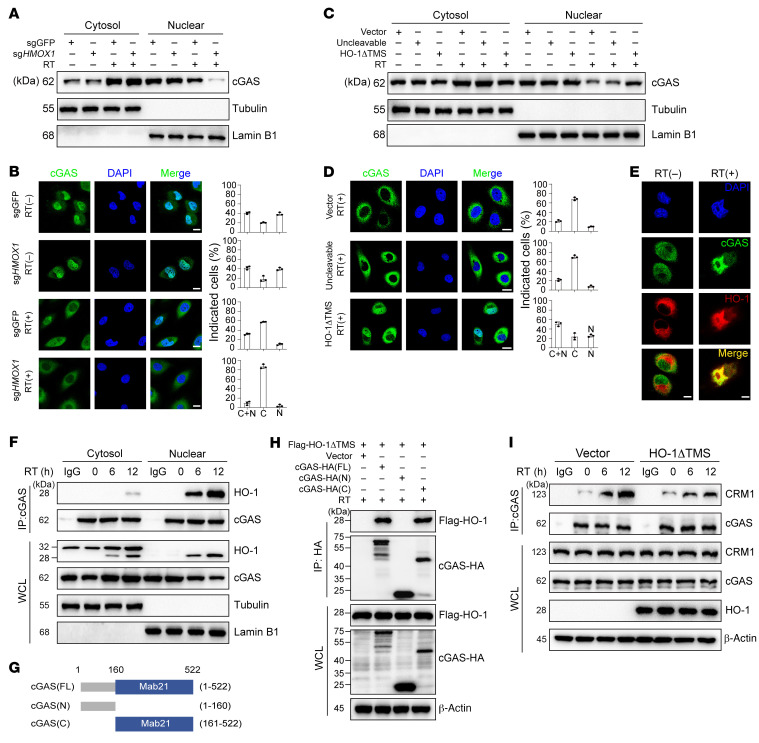
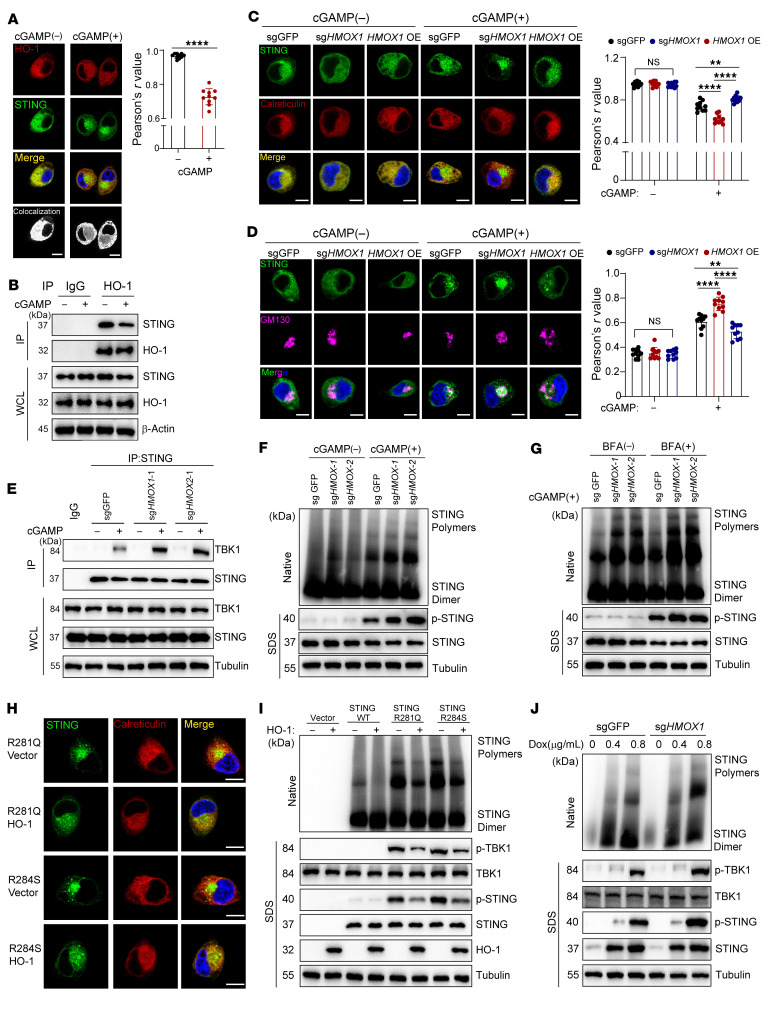
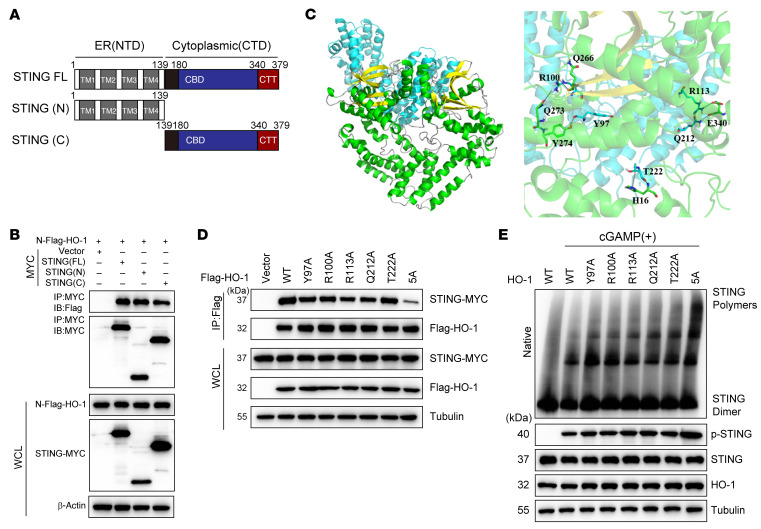
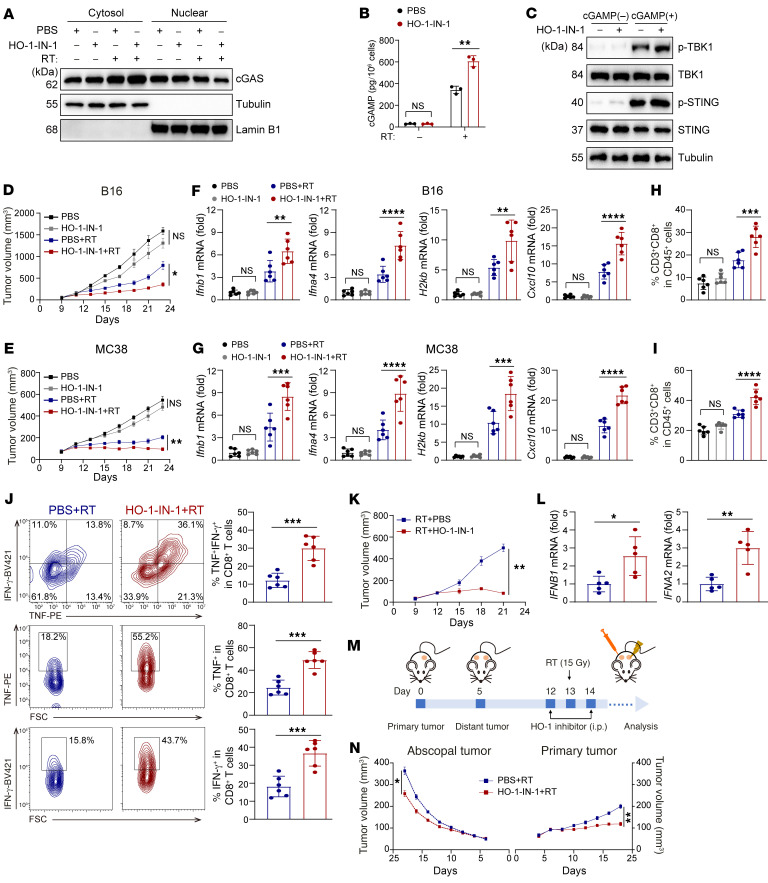
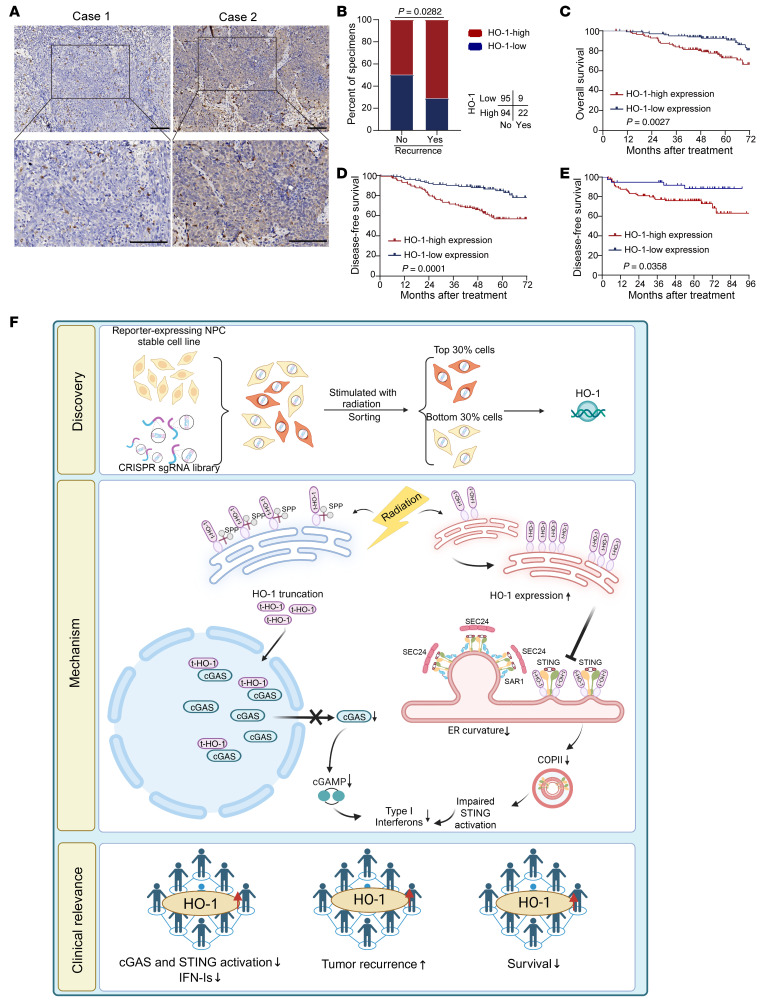
Type I IFNs (IFN-Is) induced by radiotherapy (RT) are critical for its efficacy, while the mechanism by which tumor cells inhibit IFN-I production remains largely unsolved. By an unbiased CRISPR screen, we identified hemeoxygenase 1 (HO-1) as an RT-related regulator of IFN-I production. Mechanistically, the ER-anchored, full-length HO-1 disrupted stimulator of IFN genes (STING) polymerization and subsequent coat protein complex II-mediated (COPII-mediated) ER-Golgi transportation, leading to hampered activation of downstream signaling. This process was exacerbated by the upregulation of HO-1 expression under RT. Importantly, RT also induced HO-1 cleavage. Cleaved HO-1 underwent nuclear translocation, interacted with cyclic GMP-AMP synthase (cGAS), and inhibited its nuclear export upon irradiation, leading to suppressed 2'3'-cyclic GMP-AMP (cGAMP) production. Furthermore, we revealed that HO-1 inhibitors could enhance local and distant tumor control of RT in vivo. Clinically, higher HO-1 expression was associated with a poorer prognosis and earlier tumor relapse after RT in multiple types of patient tumors. Collectively, through comprehensive inhibition of the cGAS/STING pathway, HO-1 strongly inhibited RT-induced IFN-I production, and targeting HO-1 was shown to be a promising RT-sensitizing therapeutic strategy.

Keywords: Cellular immune response; Immunology; Oncology; Radiation therapy.


Figures

Figure 1
Figure 1. A metabolic CRISPR/Cas9 screen identifies HO-1 as a potent IFN-I production inhibitor in response to RT.
(A) Schematic overview of the mCherry reporter construct. mCherry expression is driven by ISREs followed by the IFN-β promoter. (B) Control HK1 cells and IRF3-KO HK1 cells were stimulated with radiation, cGAMP (10 μM), or IFN-β (100 ng/mL). mCherry reporter expression was further analyzed by flow cytometry. (C) Overview of the CRISPR screen. Reporter-expressing HK1 cells were transduced with the sgRNA library. After radiation, the cells were sorted by flow cytometer according to mCherry expression and divided into the highest 30% and the lowest 30% mCherry-expressing populations. Genomic DNA from the sorted cells was deep sequenced to reveal gRNA enrichment. (D) Distribution of the RRA score of the top hits enriched in the mCherry high expression group versus the low expression group. (E) Volcano plot illustrating the important candidates based on the comparison of high mCherry-expressing group versus the low mCherry-expressing group. P-adj, adjusted P value. (FH) Reporter expression (F), HLAA (G), and CXCL10 (H) mRNA levels after knocking down the top 10 candidates in a post-RT CRISPR screen. *P < 0.05, **P < 0.01, ***P < 0.001, and ****P < 0.0001, by 1-way ANOVA (B and FH). Data are shown as the mean ± SD (n = 3 biologically independent samples).
Figure 2
Figure 2. HO-1 inhibits RT-mediated IFN-I production.
(A) ELISA for IFN-β content in the supernatant of control or HMOX1-KO cells before and after RT. (B) Typical IFN-Is and ISGs mRNA levels of control or HMOX1-KO cells before and after RT. (C) Tumor growth of HMOX1-inducible knockdown HK1 tumors in HuHSC-NCG mice, following with or without RT (10 Gy) (n = 5 in each group). (DF) RT-qPCR analysis for mRNA levels of typical IFN-I and ISG genes (D) and flow cytometric analysis of CD8+ T cell infiltration (E) and TNF-α and IFN-γ expression of CD8+ T cells (F) in the HK1 model (n = 5 in each group). APC, allophycocyanin. (G) Ifnb1, Ifna4, and Cxcl10 mRNA levels in BMDMs from Hmox1fl/fl and Hmox1fl/fl LyzCre/Cre mice. BMDMs were infected with HSV-1 or VSV. Data are shown as the mean ± SD (A, B, and DG) and the mean ± SEM (C). *P < 0.05, **P < 0.01, ***P < 0.001, and ****P < 0.0001, by 1-way ANOVA (A, B, D, and E), 2-way ANOVA (C), and unpaired, 2-tailed, Student’s t test (F and G). n = 3 biologically independent experiments, unless otherwise stated. Dox, doxycycline.
Figure 3
Figure 3. HO-1 inhibits the activity of cGAS and STING under RT independent of its enzymatic activity.
(A) Immunoblot analysis of essential molecules in IFN-I signaling from control or HMOX1-KO cells before and after RT. (B) ELISA of cGAMP production of control or HMOX1-KO cells before and after RT. (C) ELISA of IFN-β production in the supernatant of control or HMOX1-KO cells with or without cGAMP stimulation. (D and E) Immunoblot analysis of the indicated proteins from control or HMOX1-KO cells with the indicated treatment. (F and G) ELISA of cGAMP (F) or IFN-β (G) production in HK1 cells treated with the indicated metabolites. (H and I) HMOX1-KO HK1 cells were stably transfected with WT HO-1 or HO-1H25A. ELISA of cGAMP (H) or IFN-β (I) production with or without the indicated stimulation. Data are shown as the mean ± SD. ***P < 0.001 and ****P < 0.0001, by 1-way ANOVA (B, C, and FI). n = 3 biologically independent experiments. p-, phosphorylated.
Figure 4
Figure 4. RT induces HO-1 and promotes its cleavage.
(A) Immunoblot analysis of HO-1 expression and truncation in the indicated cells before and after RT. (B and C) Immunoblot analysis of HO-1 expression and truncation in HK1 cells after RT (B) or IFN-β treatment (C) combined with or without NAC treatment. (D and E) Immunoblot analysis of Flag–HO-1 expression in HK1 cells before and after RT. (D) Flag tag was fused to N-terminus or C-terminus of HO-1, respectively. (E) Mutating S272-F276 of HO-1 individually or mutating all 5 amino acids between S272 and F276. (F) Subcellular distribution (ER and nucleus) of full-length HO-1, uncleavable HO-1 mutant, cleaved HO-1 (HO-1ΔTMS) in HK1 cells with or without RT. Calreticulin staining for the ER; DAPI staining for the nucleus (scale bars: 10 μm). FL, full-length. (G and H) Nuclear and cytoplasmic protein extraction experiment was performed to determine the cellular localization of exogenous HO-1 or its mutants before (G) and after (H) RT in HK1 cells. (I) Subcellular distribution of endogenous HO-1 was determined with immunofluorescence staining in HK1 cells stimulated with RT (scale bars: 10 μm). (J) Nuclear and cytoplasmic protein extraction experiment was performed to determine the cellular localization of endogenous HO-1 at the indicated time point of RT in HK1 cells. (K and L) HMOX1-KO HK1 cells were stably transfected with the indicated HO-1 mutants. With or without RT, cGAMP (K) and IFN-β (L) production was determined with ELISA. (M and N) HMOX1-KO HK1 cells were stably transfected with indicated HO-1 mutants. With or without cGAMP, STING activation was determined with immunoblot analysis (M), and IFN-β production was determined by ELISA (N). Representative data from 1 experiment are shown (n = 3 biologically independent experiments). *P < 0.05, **P < 0.01, ***P < 0.001, and ****P < 0.0001, by 1-way ANOVA (K, L, and N). Data are shown as the mean ± SD.
Figure 5
Figure 5. Cleaved HO-1 inhibits the nuclear export of cGAS.
(AE) HMOX1-KO HK1 cells were stably transfected with cleaved HO-1 (HO-1ΔTMS), exclusively nucleus-located cleaved HO-1 (NLS-HO-1ΔTMS), or exclusively cytoplasm-located cleaved HO-1 (NES-HO-1ΔTMS) individually. (A and B) ELISA of cGAMP (A) or IFN-β (B) production before and after RT. (C) The interaction of Flag-tagged HO-1 mutants and HA-tagged cGAS in HEK293T cells was analyzed by immunoprecipitation under RT. WCL, whole-cell lysate. (D, F, and H) Subcellular distribution (cytoplasm and nucleus) of cGAS was determined by immunofluorescence staining of HK1 cells with the indicated mutants or RT stimulation (scale bars: 10 μm). The percentages of cells (n = 200) in the nucleus, cytoplasm, or both the cytoplasm and nucleus were calculated. (E and G) The cytoplasmic and nuclear protein fractions were extracted for immunoblot analysis to determine the subcellular localization of cGAS in HK1 cells with the indicated mutants or RT stimulation. (I and J) ELISA of cGAMP (I) or IFN-β (J) production before and after RT (related to Figure 5H). Data are shown as the mean ± SD. *P < 0.05, **P < 0.01, ***P < 0.001, and ****P < 0.0001, by 1-way ANOVA (A and B) and unpaired, 2-tailed Student’s t test (I and J). All representative data from 1 experiment are shown (n = 3 biologically independent experiments). N, predominantly in the nucleus; C, predominately in the cytoplasm; C+N, evenly distributed in the nucleus and cytoplasm.
Figure 6
Figure 6. Cleaved HO-1 directly interacts with cGAS in the nucleus.
(A and C) Cytoplasmic and nuclear protein fractions were extracted for immunoblot analysis to determine the subcellular localization of cGAS in HK1 cells with the indicated cell lines and stimulation. (B and D) Subcellular distribution (cytoplasm and nucleus) of cGAS was determined with immunofluorescence staining of HK1 cells with the indicated cell lines and stimulation (scale bars: 10 μm). The percentages of cells (n = 200) in the nucleus, cytoplasm, or both the cytoplasm and nucleus were calculated (E) Confocal microscopy images of cGAS and HO-1 in HK1 cells before and after RT (scale bars: 10 μm). (F) The cytoplasmic and nuclear protein fractions of HK1 cells at the indicated RT time points were extracted for coimmunoprecipitation. (G and H) The interaction of HA-tagged full-length cGAS (aa 1–522), N-terminus of cGAS (aa 1–160), C-terminus of cGAS (aa 161–522), and Flag-tagged HO-1ΔTMS in HEK293T cells was analyzed by immunoprecipitation. (I) HMOX1-KO HK1 cells were stably transfected with cleaved HO-1 (HO-1ΔTMS). The interaction of endogenous cGAS and CRM1 in HK1 cells was analyzed by immunoprecipitation. All representative data from 1 experiment are shown (n = 3 biologically independent experiments).
Figure 7
Figure 7. HO-1 inhibits STING oligomerization and consecutive ER-to-Golgi translocation by direct interaction.
(A) Confocal microscopy images of STING and HO-1 in HK1 cells with the indicated treatment. Pearson’s r value was used as a statistical measure to determine the extent of colocalization between HO-1 and STING. (B) The interaction of endogenous HO-1 and STING in HK1 cells was analyzed by immunoprecipitation with the indicated treatment. (C and D) Control, HMOX1-KO, and HMOX1-overexpressing HK1 cells were stained with anti-STING (C and D), anti-calreticulin (C), and anti-GM130 (D) antibodies. Pearson’s r value was used as a statistical measure to determine the extent of colocalization between STING and calreticulin or GM130. (E) The interaction of endogenous STING and TBK1 in HK1 cells was analyzed by immunoprecipitation with the indicated treatment. (F and G) STING polymerization in control and HMOX1-KO HK1 cells with the indicated treatments, followed by native PAGE and SDS-PAGE. (H) HEK293T cells were transfected with the indicated STING mutant plus vector or STING mutant plus HO-1, followed by confocal imaging. (I) HEK293T cells were cotransfected with plasmids expressing HO-1 and STING, or its mutants, followed by native PAGE and SDS-PAGE. (J) HK1 cells were stably transfected with doxycycline-induced (Dox) STING expression plasmids. After doxycycline treatment at the indicated dose, native PAGE for detection of STING polymers and SDS-PAGE were performed. (A) Imaging data were analyzed with Fuji software to reveal colocalization as white dots. (A, C, and D) Pearson’s correlation coefficient was quantified using ImageJ (NIH). n = 10 cells (quantified in a blinded manner). Data are shown as the mean ± SD. Scale bars: 10 μm. **P < 0.01 and ****P < 0.0001 by unpaired, 2-tailed Student’s t test (A) and 1-way ANOVA (C and D).
Figure 8
Figure 8. Molecular docking of HO-1 and STING.
(A and B) The interaction of MYC-tagged full-length STING (aa 1–379), N-terminus of STING (aa 1–139), C-terminus of STING (aa 140–379) and Flag-tagged HO-1 in HEK293T cells was analyzed by immunoprecipitation. (C) View of binding modes between the STING dimer and the HO-1 dimer based on MD simulations. (D) The interaction of MYC-tagged full-length STING and Flag-tagged WT HO-1 or its mutants in HEK293T cells was analyzed by immunoprecipitation. (E) HEK293T cells were cotransfected with plasmids expressing STING and HO-1, or its mutants and stimulated or not with cGAMP, followed by native PAGE and SDS-PAGE. (B, D, and E) All representative data from 1 experiment are shown (n = 3 biologically independent experiments).
Figure 9
Figure 9. HO-1 inhibitor enhances the efficacy and abscopal effect of RT in vivo.
(A) The cytoplasmic and nuclear protein fractions were extracted for immunoblot analysis to determine the subcellular localization of cGAS in MC38 cells treated as indicated. (B) ELISA of cGAMP production in MC38 cells treated as indicated. (C) Immunoblot analysis of STING and TBK1 phosphorylation in MC38 cells treated as indicated. (DJ) Effect of the HO-1 inhibitor combined with RT on tumor growth (D and E), mRNA levels of typical IFN-Is and ISGs (F and G), CD8+ T cell infiltration (H and I), and IFN-γ and TNF-α expression in CD8+ T cells (J) from B16 (D, F, and H) and MC38 (E, G, I, and J) tumors (n = 6 in each group). (K and L) Effect of the HO-1 inhibitor combined with RT on tumor growth (K), mRNA levels of typical IFN-Is (L) of HK1 tumors implanted into HuHSC-NCG mice (n = 5 in each group). (M and N) Schematic illustration and tumor growth of nonirradiated abscopal tumors and irradiated primary tumors with the indicated treatment (n = 6 in each group). Data are shown as the mean ± SD (B, FI, J, and L) and the mean ± SEM (D, E, K, and N). *P < 0.05, **P < 0.01, ***P < 0.001, and ****P < 0.0001, by unpaired, 2-tailed Student’s t test (B, J, and L), 2-way ANOVA (D, E, K, and N), and 1-way ANOVA (FI).
Figure 10
Figure 10. High expression of HO-1 correlates with unfavorable RT prognosis.
(A) Representative images of immunohistochemical staining for HO-1 protein expression, which is graded according to the staining intensity in 220 NPC tissues. Scale bars: 100 μm. (B) Correlations of the locoregional recurrence status with HO-1 expression detected by IHC. P value was determined by 2-tailed χ2 test. (C and D) Kaplan-Meier analysis of OS (C) and DFS (D) according to HO-1 expression. (E) Kaplan-Meier analysis of DFS based on HO-1 expression in the published bulk RNA-Seq dataset. (CE) P values were determined using the log-rank test. (F) Proposed working model of HO-1. By an unbiased CRISPR screen, we identified HO-1 as an irradiation-related regulator of IFN-I production. Mechanistically, irradiation induced HO-1 expression and promoted its cleavage. Cleaved HO-1 underwent nuclear translocation, interacted with cGAS, inhibited its nuclear export upon radiation, and suppressed its enzymatic activity. ER-anchored full-length HO-1 disturbed STING polymerization and subsequent COPII-mediated ER-Golgi transportation, leading to impaired activation of downstream signaling.

Comment in

  • Taking the STING out of radiotherapy: STING checkpoints mediate radiation resistance

References

    1. Schaue D, McBride WH. Opportunities and challenges of radiotherapy for treating cancer. Nat Rev Clin Oncol. 2015;12(9):527–540. doi: 10.1038/nrclinonc.2015.120. - DOI - PMC - PubMed
    1. Deng L, et al. STING-dependent cytosolic DNA sensing promotes radiation-induced Type I interferon-dependent antitumor immunity in immunogenic tumors. Immunity. 2014;41(5):843–852. doi: 10.1016/j.immuni.2014.10.019. - DOI - PMC - PubMed
    1. Schaue D, McBride WH. Opportunities and challenges of radiotherapy for treating cancer. Nat Rev Clin Oncol. 2015;12(9):527–540. doi: 10.1038/nrclinonc.2015.120. - DOI - PMC - PubMed
    1. Kachikwu EL, et al. Radiation enhances regulatory T cell representation. Int J Radiat Oncol Biol Phys. 2011;81(4):1128–1135. doi: 10.1016/j.ijrobp.2010.09.034. - DOI - PMC - PubMed
    1. Xu J, et al. CSF1R signaling blockade stanches tumor-infiltrating myeloid cells and improves the efficacy of radiotherapy in prostate cancer. Cancer Res. 2013;73(9):2782–2794. doi: 10.1158/0008-5472.CAN-12-3981. - DOI - PMC - PubMed

MeSH terms