. 2024 Dec 2;134(23):e173593.
doi: 10.1172/JCI173593.

Dysregulated Treg repair responses lead to chronic rejection after heart transplantation

Affiliations

Dysregulated Treg repair responses lead to chronic rejection after heart transplantation

Jordan Jp Warunek et al. J Clin Invest. .

Abstract

Chronic rejection (CR) after organ transplantation is alloimmune injury manifested by graft vascular remodeling and fibrosis that is resistant to immunosuppression. Single-cell RNA-Seq analysis of MHC class II-mismatched (MHCII-mismatched) heart transplants developing chronic rejection identified graft IL-33 as a stimulator of tissue repair pathways in infiltrating macrophages and Tregs. Using IL-33-deficient donor mice, we show that graft fibroblast-derived IL-33 potently induced amphiregulin (Areg) expression by recipient Tregs. The assessment of clinical samples also confirmed increased expression of Areg by intragraft Tregs also during rejection. Areg is an EGF secreted by multiple immune cells to shape immunomodulation and tissue repair. In particular, Areg is proposed to play a major role in Treg-mediated muscle, epithelium, and nerve repair. Assessment of recipient mice with Treg-specific deletion of Areg surprisingly uncovered that Treg secretion of Areg contributed to CR. Specifically, heart transplants from recipients with Areg-deficient Tregs showed less fibrosis, vasculopathy, and vessel-associated fibrotic niches populated by recipient T cells. Mechanistically, we show that Treg-secreted Areg functioned to increase fibroblast proliferation. In total, these studies identify how a dysregulated repair response involving interactions between IL-33+ fibroblasts in the allograft and recipient Tregs contributed to the progression of CR.

Keywords: Cellular immune response; Fibrosis; Immunology; Organ transplantation; Transplantation.


Figures

Figure 1
Figure 1. Effect of graft IL-33 on the immune cell landscapes following HTx.
(A) Experimental schematic illustrating the use of scRNA-Seq to analyze Il33+/+ or Il33–/– Bm12 heart grafts at POD14 following heterotopic HTx into B6 recipients (n = 3/group). Created with BioRender.com. (B) t-SNE projection of graft immune cell populations (n = 4,441 cells). Unconv., unconventional. (C) Lineage analysis to identify T cell and myeloid clusters (n = 3 hearts/group).
Figure 2
Figure 2. Local cardiac IL-33 orchestrates reparative macrophage differentiation.
(AE) scRNA-Seq at POD14 examining monocytes and macrophages in donor Il33+/+ or Il33–/– Bm12 hearts transplanted into B6 mice. (A) Volcano plot comparison of differentially expressed macrophage genes. Graft IL-33 significantly upregulated 327 genes, while downregulating 429 genes. (B) Single-cell pseudotime trajectory of monocyte and macrophage Monocle states in Il33+/+ Bm12 grafts. (C) Distribution of Monocle states in Il33+/+ and Il33–/– Bm12 grafts. (D) Heatmap comparing differential gene expression of the specified Monocle states in Il33+/+ Bm12 grafts. Mono, monocytes; Macs, macrophages. (E) Comparison of state 4 and state 5 genes in Il33+/+ and Il33–/– Bm12 grafts (n = 3 hearts/group). (F) MFI of the indicated proteins for recipient macrophages (CD45.1+CD45 i.v., CD3CD11b+Ly6GCD11cF4/80+) in Il33+/+ and Il33–/– Bm12 or Il33+/+ and Il33–/– syngeneic grafts at POD14 (n = 7 for Bm12 grafts; n = 3–5 for syngeneic grafts). The results represent cumulative data from 6 independent experiments. Individual data points are depicted in the graphs, along with the group mean ± SD. *P ≤ 0.05, by 1-way ANOVA with Tukey’s multiple-comparison test.
Figure 3
Figure 3. IL-33 promotes tissue-resident Tregs and enhances tissue repair programs.
(AF) scRNA-Seq analysis of Tregs in Bm12 grafts at POD14 comparing Il33+/+ and II33–/– Bm12 grafts. (A) Volcano plot depicting DEGs in Tregs. (B) Pathways modulated by IL-33. (C) IL-33 contribution to the published Treg pan-tissue signature (28) and (D) selected genes significantly modulated by IL-33 in Il33+/+ versus II33–/– Bm12 grafts. (C) ****P ≤ 0.0001, by Mann-Whitney U test. up, upregulated. (E) t-SNE projection of Areg-expressing cells. (F) Heatmap comparing Areg expression in Il33+/+ versus Il33–/– in conventional T cells and Tregs (n = 3 hearts/group). LSMean, least squares mean. (G) Representative flow cytometry plots and frequency quantification of ST2+Areg+ Tregs (CD45.1+CD45 i.v., CD3+CD4+CD8Foxp3+) in Il33+/+ and II33–/– Bm12 grafts. (H) MFI of Areg and (I) Nurr77 expression in intragraft Tregs at POD14. (GI) n = 7 for Bm12 grafts; n = 4 for syngeneic grafts. *P ≤ 0.05 and **P ≤ 0.01, by 1-way ANOVA with Tukey’s multiple-comparison test. The results represent cumulative data from 6 independent experiments. Individual data points are depicted in the graphs, along with the group mean ± SD.
Figure 4
Figure 4. Areg production by Tregs increases allograft fibrosis and vasculopathy.
(AF) Tissues from Bm12 Il33+/+ HTx into Foxp3YFP-Cre control or Foxp3YFP-Cre Aregfl/fl recipients was histologically analyzed at POD50 and POD90. (A) Representative Masson’s trichrome staining of fibrotic areas. Scale bars: 100 μm. Original magnification, ×140 and ×320 (POD50) and ×200 (POD90). (B) Examples of trichrome quantification (total area/blue trichrome+; red overlay shows trichrome+ areas) using QuPath’s trainable pixel classifier. Scale bars: 50 μm (original magnification, ×320) and 100 μm (original magnification, ×140). (C) Percentage of trichrome+ staining quantification. (D) Representative sections highlighting vascular occlusion at POD90 and (E) POD50, with numbered high-resolution insets for POD90. (D) Scale bars: 1 mm (original magnification, ×30) and 100 μm (original magnification, ×120 and ×200). (E) Scale bars: 50 μm. Original magnification, ×260, ×320, and ×360. (F) Quantification of vascular occlusion (total vessels/occluded vessels). For C and F, 3 syngeneic and 6–9 BM12 grafts/group were evaluated, and 1 or 2 depths/graft were quantitated. Cumulative data from 6 independent experiments are shown. Large symbols represent the means from individual grafts, and color- and (C) symbol-matched small symbols provide the values for each sample section. The thick bar and error bars represent the mean ± SD calculated from the biological sample means. *P ≤ 0.05 and **P ≤ 0.01, by Mann-Whitney U test.
Figure 5
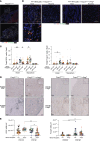
Figure 5. Treg-derived Areg promotes T cell accumulation around graft vessels.
(AE) Bm12 grafts were harvested after POD50 or POD90 from Foxp3YFP-Cre or Foxp3YFP-Cre Aregfl/fl recipient mice. Graphs show quantitative analysis of CD3+ T cells and CD3+Foxp3+ Tregs. (A) Representative POD90 Bm12 heart grafts in Foxp3YFP-Cre recipients stained for IL-33 (white), α-SMA (red), Foxp3 (green), and DAPI (blue). Enlarged inset indicates high-resolution area (original magnification, ×110). Scale bar: 100 μm. (B) Representative POD90 Bm12 graft stained for CD3 (red), Foxp3 (green), CD11b (white) and DAPI. Enlarged inset indicates high-resolution area. Scale bars: 50 μm. (C) Quantification of CD3+ or Foxp3+ cells in myocardial or blood vessel areas. (D) IHC detection of CD3+ or Foxp3+ cells across the entire transplant sections. Scale bars: 50 μm and 100 μm. Insets in D present higher magnification of the indicated areas. (E) Quantification of CD3+ or Foxp3+ cells across the entire transplant sections was normalized to the total area (n = 6–9/group). In these studies, 6 BM12 grafts/group were evaluated, and 2 depths/graft were quantitated. Large symbols in C and E indicate the mean counts from individual grafts and color- and symbol-matched small icons provide the values for each sample section. The thick bar and error bars represent the mean ± SD calculated from the biological sample means. *P ≤ 0.05 and **P ≤ 0.01, by 1-way ANOVA with Tukey’s multiple-comparison test.
Figure 6
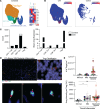
Figure 6. Augmented Areg in Treg is observed during clinical graft rejection and chronic allograft vasculopathy.
(AC) snRNA-Seq of heart samples from patients with severe CAV versus controls (GSE203548). (A) UMAP projection of all samples with T cell classifications labeled and highlighted by color. Heatmap depicts the expression of lineage markers used to assign neighborhoods. (B) Nuclei from the CAV samples or control samples were separated in the UMAP projection, respectively. (C) Counts of the T cell types in CAV and control samples and mean expression of Areg in the T cell types. (D and E) Assessment of EMBs for Areg (red), Foxp3 (green), and DAPI (blue). (D) Representative immunofluorescence images of an EMB displaying QuPath trainable cell detection to identify Tregs and Areg+ Tregs. White arrows indicate Areg staining. Scale bars: 50 μm. Insets present higher magnification of the indicated areas (original magnification, ~×2,000). (E) Number of Tregs and their level of Areg expression grouped by EMBs with minimal, mild, and moderate/severe allograft inflammation (n = 3–4 minimal, 7 = mild, 8 = moderate/severe). Large symbols depict the mean cell counts for individual patients, and color- and symbol-matched small symbols provide the cell values for each sample section. The thick bar and error bars represent the mean ± SD calculated from the individual patient means. *P ≤ 0.05 and **P ≤ 0.01, by 1-way ANOVA with Tukey’s multiple-comparison test.
Figure 7
Figure 7. Treg-secreted Areg increases fibroblast proliferation.
(A) Representative POD90 Bm12 heart grafts from Foxp3YFP-Cre or Foxp3YFP-Cre Aregfl/fl recipient mice stained for α-SMA (white), CD3 (red), Foxp3 (green), and DAPI (blue). Graph shows quantitative analysis of α-SMA invasion around blood vessels (7–9/group were evaluated, and 2 depths/graft were quantitated). The results represent cumulative from 4 independent experiments. Large symbols represent the mean counts from individual grafts, and color- and symbol-matched small symbols provide the values from each sample section. The thick bar and error bars represent the mean ± SD calculated from the biological sample means. **P ≤ 0.01, by 1-tailed Student’s t test. (B) Representative immunofluorescence images depicting Gp38 (green), Ki67 (red), CD45 (teal), and DAPI (dark blue) staining of B6 St2–/– fibroblasts following 4 days of coculturing with Foxp3YFP-Cre control or Foxp3YFP-Cre Aregfl/fl Tregs in the presence of IL-2 and IL-33. Data were pooled from 2 independent experiments (9–11/group), and each point is an individual well represented as the mean ± SD. *P ≤ 0.05, by Kruskal-Wallis test. (C) t-SNE projection of IL-33–expressing cells in Il33+/+ or Il33–/– Bm12 grafts at POD14 (n = 3 hearts/group). (D) Gene set enrichment analysis of fibroblasts from Il33+/+ or Il33–/– Bm12 grafts. (E) Heatmap depicts selected fibroblast-expressed molecules modulated by the presence of IL-33.
Figure 8
Figure 8. Modulation of Treg Areg secretion through ST2 and the TCR.
(A and B) Tregs from Foxp3YFP-Cre mice were cultured under various conditions: (A) different combinations of IL-33, plate-bound anti-CD3, and anti-CD28 antibody or (B) IL-33 and specific signaling pathway inhibitors (i). After 4 days of culturing, the Areg concentration was quantified by ELISA. The results represent cumulative data from 3 independent experiments, with a total of n = 6/group. Individual data points are depicted in the graphs, along with the group mean ± SD. ***P ≤ 0.005 and ****P ≤ 0.0001, by 1-way ANOVA with Tukey’s multiple-comparison test.

References

    1. Hariharan S, et al. Long-term survival after kidney transplantation. N Engl J Med. 2021;385(8):729–743. doi: 10.1056/NEJMra2014530. - DOI - PubMed
    1. Dwyer GK, Turnquist HR. Untangling local proinflammatory, reparative, and regulatory damage-associated molecular-patterns (DAMPs) pathways to improve transplant outcomes. Front Immunol. 2021;12:611910. doi: 10.3389/fimmu.2021.611910. - DOI - PMC - PubMed
    1. Braza MS, et al. Inhibiting inflammation with myeloid cell-specific nanobiologics promotes organ transplant acceptance. Immunity. 2018;49(5):819–828. doi: 10.1016/j.immuni.2018.09.008. - DOI - PMC - PubMed
    1. Zou H, et al. HMGB1 is involved in chronic rejection of cardiac allograft via promoting inflammatory-like mDCs. Am J Transplant. 2014;14(8):1765–1777. doi: 10.1111/ajt.12781. - DOI - PubMed
    1. Terasaki PI, et al. High survival rates of kidney transplants from spousal and living unrelated donors. N Engl J Med. 1995;333(6):333–336. doi: 10.1056/NEJM199508103330601. - DOI - PubMed