. 2024;16(1):2422268.
doi: 10.1080/17590914.2024.2422268. Epub 2024 Dec 2.

Amino Acid and Glucose Fermentation Maintain ATP Content in Mouse and Human Malignant Glioma Cells

Affiliations

Amino Acid and Glucose Fermentation Maintain ATP Content in Mouse and Human Malignant Glioma Cells

Derek C Lee et al. ASN Neuro. 2024.

Abstract

Energy is necessary for tumor cell viability and growth. Aerobic glucose-driven lactic acid fermentation is a common metabolic phenotype seen in most cancers including malignant gliomas. This metabolic phenotype is linked to abnormalities in mitochondrial structure and function. A luciferin-luciferase bioluminescence ATP assay was used to measure the influence of amino acids, glucose, and oxygen on ATP content and viability in mouse (VM-M3 and CT-2A) and human (U-87MG) glioma cells that differed in cell biology, genetic background, and species origin. Oxygen consumption was measured using the Resipher system. Extracellular lactate and succinate were measured as end products of the glycolysis and glutaminolysis pathways, respectively. The results showed that: (1) glutamine was a source of ATP content irrespective of oxygen. No other amino acid could replace glutamine in sustaining ATP content and viability; (2) ATP content persisted in the absence of glucose and under hypoxia, ruling out substantial contribution through either glycolysis or oxidative phosphorylation (OxPhos) under these conditions; (3) Mitochondrial complex IV inhibition showed that oxygen consumption was not an accurate measure for ATP production through OxPhos. The glutaminase inhibitor, 6-diazo-5-oxo-L-norleucine (DON), reduced ATP content and succinate export in cells grown in glutamine. The data suggests that mitochondrial substrate level phosphorylation in the glutamine-driven glutaminolysis pathway contributes to ATP content in these glioma cells. A new model is presented highlighting the synergistic interaction between the high-throughput glycolysis and glutaminolysis pathways that drive malignant glioma growth and maintain ATP content through the aerobic fermentation of both glucose and glutamine.

Keywords: Fermentation; glioblastoma; glutaminolysis; mitochondrial substrate level phosphorylation; succinate.

Plain language summary

Malignant gliomas, regardless of cell of origin or species, rely on fermentation mechanisms for ATP production due to OxPhos insufficiency. Glucose and glutamine together are necessary and sufficient for dysregulated tumor cell growth, whereas OxPhos is neither necessary nor sufficient.


Figures

Figure 1.
Figure 1.
Influence of glucose and glutamine on the bioluminescence of VM-M3 cells. (A) Cells were seeded at a density of 5.0 × 103 and cultured for 48 hours with indicated media compositions. Glucose was added at 12 mM and glutamine (Q) added at 2 mM. Basal media represents DMEM with no added glucose or glutamine. Data are shown as mean ± SEM with an n = 3 independent experiments for each time point. (B) Bioluminescence of cells cultured in varying glucose and glutamine concentrations after 24 hours. Data are shown as mean percent increase in cell number relative to the hour 0 time point. BM indicates basal media (DMEM without added glucose or glutamine). Bars represent means of 3 independent experiments of 4 technical replicates per group.
Figure 2.
Figure 2.
Influence of supplemented amino acids in basal media or phosphate buffered saline. (A) VM-M3 cells cultured in basal media or (B) phosphate buffered saline (PBS) with the indicated amino acid supplemented at 4 mM. The bioluminescence value at hour 0 is represented by a dashed line. Amino acids are ordered by descending percent change at hour 24. Cells were seeded at a density of 5.0 x 10³ cells/well. Quantitative values and statistical analysis can be found in Table 1 (2 A) and Table 2 (2B). Values are shown as mean ± SEM with three independent experiments.
Figure 3.
Figure 3.
Influence of supplemented amino acids with glucose in basal media or phosphate buffered saline. (A) VM-M3 cells cultured in basal media or (B) PBS in 12 mM glucose with the indicated amino acid supplemented at 4 mM. The bioluminescence value at hour 0 is represented by a dashed line. Amino acids are ordered by descending percent change at hour 24. Cells were seeded at a density of 5.0 x 10³ cells/well. Quantitative values and statistical analysis can be found in Table 3 (3 A) and Table 4 (3B). Values are shown as mean ± SEM with three independent experiments.
Figure 4.
Figure 4.
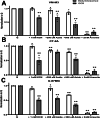
Oxygen Consumption is Independent of ATP Synthesis. (A) VM-M3, (B) CT-2A, and (C) U-87MG cells cultured glutamine only media with sodium azide (200 or 500 µM), potassium cyanide (1 mM), or sodium arsenite (2 mM) for 6 hours. Black and grey bars indicate bioluminescence and oxygen consumption rate, respectively. All values are normalized and compared to control (Q) in three independent experiments. Values are plotted as mean ± SEM. Dunnett’s multiple comparison tests were used to evaluate statistical significance. Statistical significance is represented as: *p < 0.05; ** p < 0.01.
Figure 5.
Figure 5.
Labeled succinate as an end-product of glutamine breakdown. (A) Simplified schematic of C13-glutamine tracing experiment. Glutamine enters the cell and is converted via glutaminolysis toward succinate. In GBM, succinate deviates from the TCA cycle and is exported from the mitochondria. Succinate has multiple fates within the cytosol including the stabilization of HIF-1a (Selak et al., 2005). Small amounts of remaining succinate are protonated and exported into the extracellular space. Image created using BioRender. (B) Extracellular C13-succinate measured by mass spectrometry as described in Materials and Methods. (C) Extracellular succinate measured by two-step colorimetric enzymatic assay. (D) Extracellular succinate measured in the presence of 6-diazo-5-oxo-norleucine (DON) in glutamine only media after 6 hours. (E) Trypan blue exclusion assay was performed on cells treated with DON in glutamine only media. (F) Extracellular succinate measured in the presence of DON in glucose and glutamine containing media after 6 hours. (G) Trypan blue exclusion assay was performed on cells treated with DON in glucose and glutamine containing media. Values are shown as mean ± SEM with three independent experiments. Unpaired student’s t-tests were used to evaluate statistical significance compared to control. Statistical significance is represented as: *p < 0.05; **p < 0.01.
Figure 6.
Figure 6.
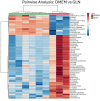
Clustering analysisof differentially expressed metabolites by presence or absence of glutamine in VM-M3 cells. (A) Metabolites quantified using mass spectrometry and analyzed by MetaboAnalyst 4.0 to generate a heat map ranked by fold change. Each column represents one sample with rows associated with the indicated metabolite. Red represents the fold change increase while blue represents the fold change decrease based on the presence (green, GLN) or absence (red, DMEM) of glutamine.
Figure 7.
Figure 7.
Global metabolomics of VM-M3 cells in hypoxia and normoxia. (A) Metabolites were quantified using mass spectrometry and analyzed by MetaboAnalyst 4.0 as previously described. VM-M3 cells were grown in 12 mM glucose (GLC), 2 mM glutamine (GLN), or both. Cells were incubated in either normoxia (21% O2) or hypoxia (0.1% O2) for 18 hours. B) Bioluminescence measurements in VM-M3 cells cultured in hypoxia or normoxia after 18 hours. Values are shown as mean ± SEM with three independent experiments. Student’s t-tests were used to evaluate statistical significance: *p < 0.05; **p < 0.01.
Figure 8.
Figure 8.
High-throughput synergy between the glycolysis and the glutaminolysis pathways drive the dysregulated growth of glioma cells. Glioma cells are dependent on both glucose and glutamine for maintaining dysregulated growth. This dual dependency can be explained largely through the synergy between these two pathways that facilitate the synthesis of ATP and biomass. Glucose (blue) enters the cell through GLUT1 transporters and is metabolized through the Embden-Meyerhof-Parnas glycolytic pathway. This 10-step pathway contributes to several pro-biomass pathways including the pentose phosphate pathway (PPP) for nucleotide synthesis, the hexosamine pathway for N- and O-linked glycosylation precursors, glycine synthesis for glutathione production, and serine for one-carbon metabolism. Some glucose carbons are diverted to synthesize fatty acids in normoxia. Glucose carbons that reach pyruvate kinase are exported as lactate which contributes to extracellular acidification. Glutamine (green) enters the cell primarily through the SLC1A5 transporter and enters the glutaminolysis pathway. Glutamine is essential for producing glucosamine-6-phosphate, a key intermediate in the hexosamine pathway that contributes to N- and O-linked glycosylation. The amide nitrogen released from the conversion of glutamine to glutamate contributes to nucleotide synthesis. Glutamate is combined with glycine and cysteine to form glutathione, an antioxidant that protects tumor cells from ROS. The remaining glutamate is converted first to alpha-ketoglutarate (a-KG). a-KG will divert in the reductive TCA cycle through citrate and be used for fatty acid synthesis in hypoxia. Otherwise, a-KG follows the oxidative pathway and is converted to succinyl-CoA. Succinyl-CoA is the substrate for mitochondrial substate level phosphorylation (mSLP) that produces ATP and succinate. Succinate has been shown to stabilize HIF1a via inhibition of prolyl hydroxylase (Selak et al., 2005) – a key protein that upregulates glycolysis. Lastly, both succinate and glutamate have been found to be excreted into the extracellular matrix and contribute toward acidification of the microenvironment. Figure created using BioRender.

References

    1. Aisenberg, A. C. (1961). The glycolysis and respiration of tumors. Academic Press.
    1. Arcos, J. C., Tison, M. J., Gosch, H. H., & Fabian, J. A. (1969). Sequential alterations in mitochondrial inner and outer membrane electron transport and in respiratory control during feeding of amino azo dyes; stability of phosphorylation. Correlation with swelling-contraction changes and tumorigenesis threshold. Cancer Research, 29(6), 1298–1305. - PubMed
    1. Arismendi-Morillo, G. (2009). Electron microscopy morphology of the mitochondrial network in human cancer. The International Journal of Biochemistry & Cell Biology, 41(10), 2062–2068. 10.1016/j.biocel.2009.02.002 - DOI - PubMed
    1. Arismendi-Morillo, G. J., & Castellano-Ramirez, A. V. (2008). Ultrastructural mitochondrial pathology in human astrocytic tumors: Potentials implications pro-therapeutics strategies. Journal of Electron Microscopy, 57(1), 33–39. 10.1093/jmicro/dfm038 - DOI - PubMed
    1. Astiarraga, B., Martínez, L., Ceperuelo-Mallafré, V., Llauradó, G., Terrón-Puig, M., Rodríguez, M. M., Casajoana, A., Pellitero, S., Megía, A., Vilarrasa, N., Vendrell, J., & Fernández-Veledo, S. (2020). Impaired succinate response to a mixed meal in obesity and type 2 diabetes is normalized after metabolic surgery. Diabetes Care, 43(10), 2581–2587. 10.2337/dc20-0460 - DOI - PMC - PubMed

Publication types

LinkOut - more resources